. 2018 Mar 27;115(13):3392-3397.
doi: 10.1073/pnas.1717815115. Epub 2018 Mar 12.

Lateral cerebellum is preferentially sensitive to high sonic hedgehog signaling and medulloblastoma formation

Affiliations

Lateral cerebellum is preferentially sensitive to high sonic hedgehog signaling and medulloblastoma formation

I-Li Tan et al. Proc Natl Acad Sci U S A. .

Abstract

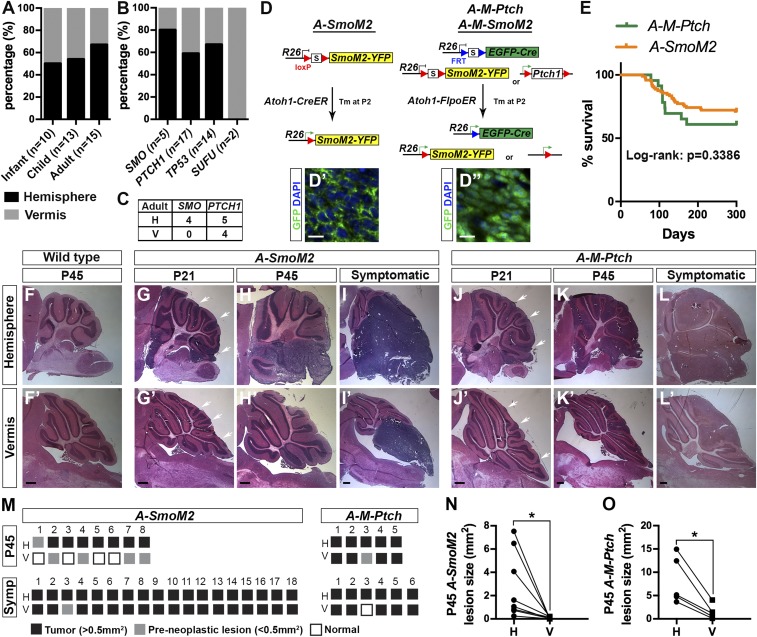
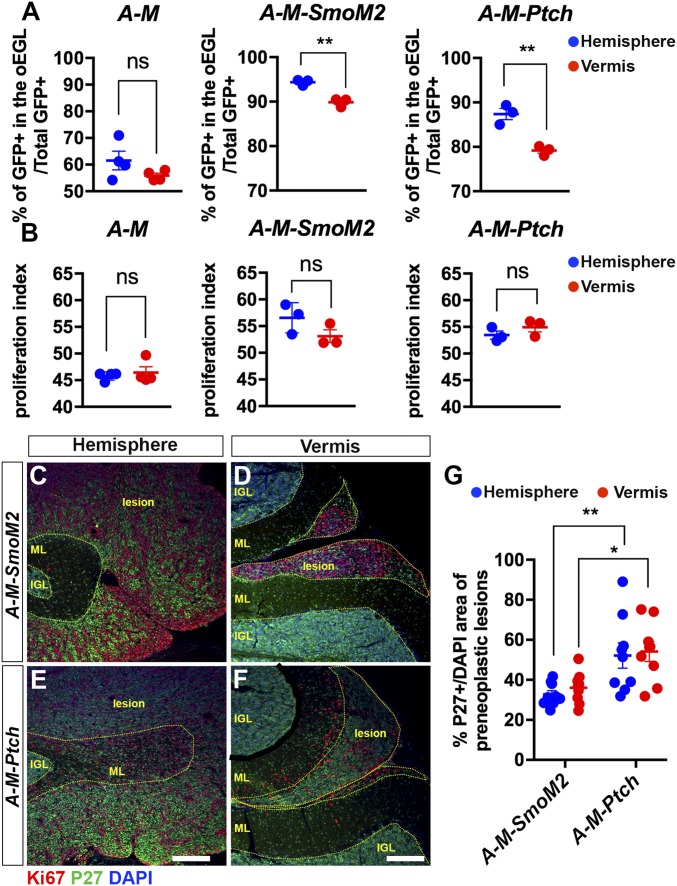
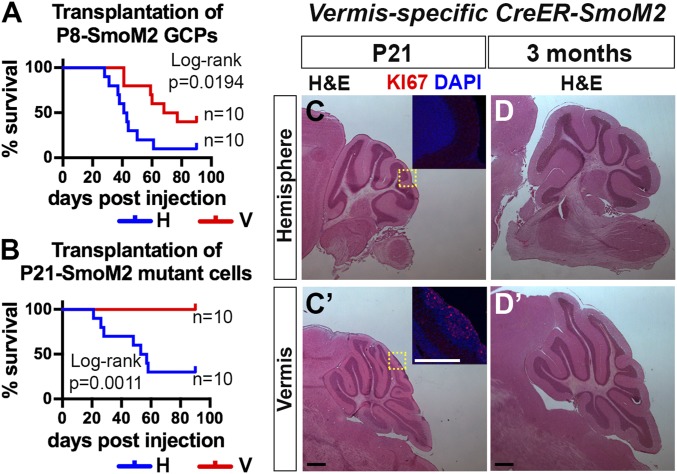
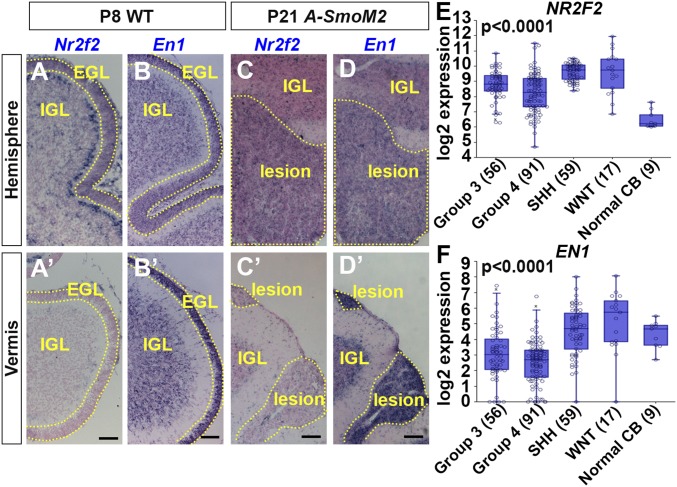
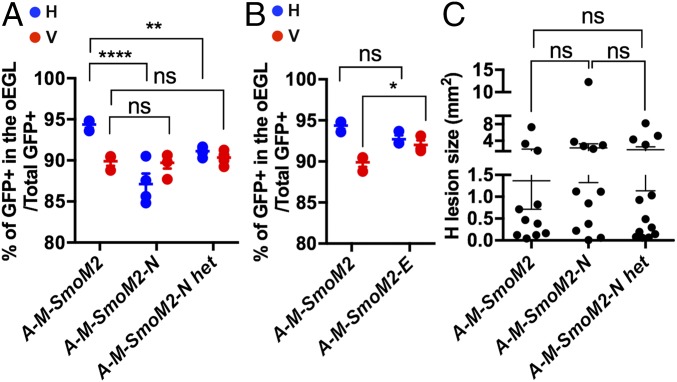
The main cell of origin of the Sonic hedgehog (SHH) subgroup of medulloblastoma (MB) is granule cell precursors (GCPs), a SHH-dependent transient amplifying population in the developing cerebellum. SHH-MBs can be further subdivided based on molecular and clinical parameters, as well as location because SHH-MBs occur preferentially in the lateral cerebellum (hemispheres). Our analysis of adult patient data suggests that tumors with Smoothened (SMO) mutations form more specifically in the hemispheres than those with Patched 1 (PTCH1) mutations. Using sporadic mouse models of SHH-MB with the two mutations commonly seen in adult MB, constitutive activation of Smo (SmoM2) or loss-of-Ptch1, we found that regardless of timing of induction or type of mutation, tumors developed primarily in the hemispheres, with SmoM2-mutants indeed showing a stronger specificity. We further uncovered that GCPs in the hemispheres are more susceptible to high-level SHH signaling compared with GCPs in the medial cerebellum (vermis), as more SmoM2 or Ptch1-mutant hemisphere cells remain undifferentiated and show increased tumorigenicity when transplanted. Finally, we identified location-specific GCP gene-expression profiles, and found that deletion of the genes most highly expressed in the hemispheres (Nr2f2) or vermis (Engrailed1) showed opposing effects on GCP differentiation. Our studies thus provide insights into intrinsic differences within GCPs that impact on SHH-MB progression.

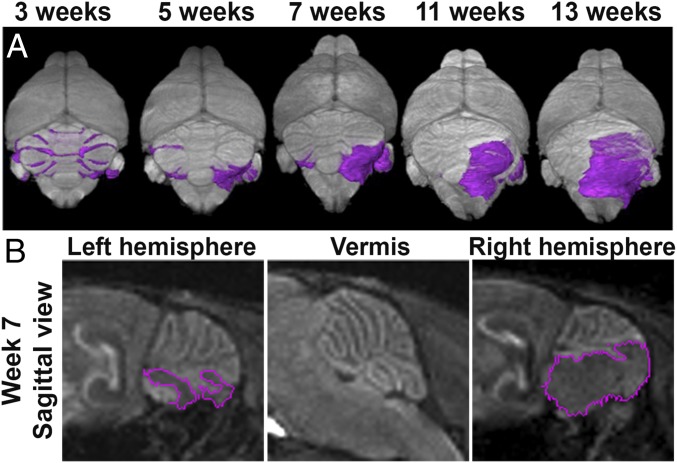
Keywords: En1; MRI; Nr2f2; cerebellar hemispheres; granule cell precursors.


Conflict of interest statement

The authors declare no conflict of interest.

Figures

Fig. 1.
Fig. 1.
Human and mouse SHH-MBs are preferentially located in the cerebellar H. (A and B) Percentage of tumors located in H and V from 38 SHH-MBs separated by patient age group (A) or mutation types (B). (C) Number of adult tumors located in H and V with SMO or PTCH1 mutations (one-tailed χ2 test, P = 0.0545). (DD″) Schematic showing the three sporadic SHH-MB mouse models used. (Scale bars, 10 μm.) (E) Survival curves for two models. (FL) H&E staining of sagittal sections in H and V (F′–L′) from mice of the indicated genotypes and ages. White arrows indicate lesions. (Scale bars, 500 μm.) (M) Schematic showing the presence of tumors or preneoplastic lesions in individual P45 and symptomatic A-SmoM2 or A-M-Ptch mice. (N and O) Graphs showing the size of H and V lesions in P45 A-SmoM2 (n = 8) (N) and A-M-Ptch (n = 5) (O) mice, with lines connecting data from each animal. Significance was determined using two-tailed Student’s t test, *P < 0.05. Statistics are provided in Table S2.
Fig. 2.
Fig. 2.
MEMRI longitudinal imaging of A-SmoM2 mice demonstrates tumors arise in the lateral cerebellum. (A) Representative 3D volume renderings of the brain (gray) and lesions/tumors (purple) from MEMRI longitudinal imaging of A-SmoM2 mice at the indicated time points. (B) MEMRI sagittal views in left/right H and V in 7 wk A-SmoM2 mice. Lesions/tumors are marked by purple lines.
Fig. 3.
Fig. 3.
GCPs located in the hemispheres are more sensitive to elevated HH signaling, which maintains them in an undifferentiated state. (A and B) Graphs of the proportions of undifferentiated GCPs (GFP+ in the proliferating outer EGL/total GFP+ cells) (A) and the proliferation index (percent GFP+ EdU+ cells/GFP+ in outer EGL) (B) in H and V of P8 A-M (n = 4), A-M-SmoM2 (n = 3), and A-M-Ptch (n = 3) mice. Significances determined using paired Student’s t test to compare H and V within an animal of each genotype. (CF) Flourescent immunohistochemical (FIHC) detection of Ki67, P27, and DAPI on sagittal sections of P21 A-M-SmoM2 and A-M-Ptch mice. Internal granule cell layer (IGL), molecular layer (ML), and lesions are indicated with yellow dotted lines. (Scale bars, 200 μm.) (G) Quantification of cell differentiation (P27+ over DAPI+ area) in preneoplastic lesions located in H and V of P21 A-M-SmoM2 (n = 3) and A-M-Ptch (n = 3) mice. Significances determined using two-way ANOVA (overall P = 0.0001) followed by a Sidak post hoc test. All data are expressed as mean ± SEM. **P < 0.01, *P < 0.05, ns, nonsignificant. Statistics are provided in Table S2.
Fig. 4.
Fig. 4.
SmoM2-mutant cells in the H show higher tumor-initiating potential compared with in the V. (A and B) Survival curves of nude mice transplanted with SmoM2-mutant GCPs or preneoplastic cells isolated at P8 (A) or P21 (B) from the H or V of A-SmoM2 mice. Ninety days postinjection was the experimental endpoint. (C) H&E staining of sagittal H (C) and V (C′) sections from P21 V-specific CreER-SmoM2 (En1CreER/+) mice given Tm at P2. FIHC detection of Ki67 and DAPI in areas indicated by yellow rectangles in C and C′. (D) H&E staining of sagittal H (D) and V (D′) sections of 3-mo-old V-specific CreER-SmoM2 mice. (Scale bars, 500 μm.)
Fig. 5.
Fig. 5.
GCP location-specific gene expression in lesions and tumors. (AD) RNA in situ hybridization of Nr2f2 (A and C) and En1 (B and D) on the sagittal section of H and V (A′–D′) from P8 WT (A and B) and P21 A-SmoM2 (C and D) mice. IGL, EGL, and lesion are marked by dotted lines. (Scale bars, 75 μm.) (E and F) Expression of NR2F2 (E) and EN1 (F) in four subgroups of human MB [R2: Genomics Analysis and Visualization Platform (https://hgserver1.amc.nl/cgi-bin/r2/main.cgi)]; significance is calculated with a one-way ANOVA between groups.
Fig. 6.
Fig. 6.
Nr2f2 and En1/2 influence the differentiation of SmoM2-mutant P8 GCPs but not tumor formation. (A) Graphs comparing the proportions of undifferentiated GCPs between H and V of A-M-SmoM2 (also shown in Fig. 3A), A-M-SmoM2-N (n = 4), and A-M-SmoM2-N het (n = 5) mice. (B) Graphs comparing the proportions of undifferentiated GCPs between the H and V of A-M-SmoM2 and A-M-SmoM2-E (n = 3) mice. (C) Graphs showing the size of H lesions from A-M-SmoM2 (n = 11), A-M-SmoM2-N (n = 12), and A-M-SmoM2-N het (n = 13). Significances determined using a two-way ANOVA followed by a Sidak post hoc test for A and B, or with a one-way ANOVA followed by Tukey post hoc test for C. All data are expressed as mean ± SEM. ****P < 0.0001, **P < 0.01, *P < 0.05, ns, nonsignificant. Statistics are provided in Table S2.

References

    1. Northcott PA, Korshunov A, Pfister SM, Taylor MD. The clinical implications of medulloblastoma subgroups. Nat Rev Neurol. 2012;8:340–351. - PubMed
    1. Kool M, et al. ICGC PedBrain Tumor Project Genome sequencing of SHH medulloblastoma predicts genotype-related response to smoothened inhibition. Cancer Cell. 2014;25:393–405. - PMC - PubMed
    1. Louis DN, et al. The 2016 World Health Organization classification of tumors of the central nervous system: A summary. Acta Neuropathol. 2016;131:803–820. - PubMed
    1. Northcott PA, et al. The whole-genome landscape of medulloblastoma subtypes. Nature. 2017;547:311–317. - PMC - PubMed
    1. Cavalli FMG, et al. Intertumoral heterogeneity within medulloblastoma subgroups. Cancer Cell. 2017;31:737–754.e6. - PMC - PubMed

Publication types

MeSH terms