. 2018 Jun 1;78(11):3002-3013.
doi: 10.1158/0008-5472.CAN-17-2433. Epub 2018 Mar 12.

Activation of the Receptor Tyrosine Kinase AXL Regulates the Immune Microenvironment in Glioblastoma

Affiliations

Activation of the Receptor Tyrosine Kinase AXL Regulates the Immune Microenvironment in Glioblastoma

Hirokazu Sadahiro et al. Cancer Res. .

Abstract

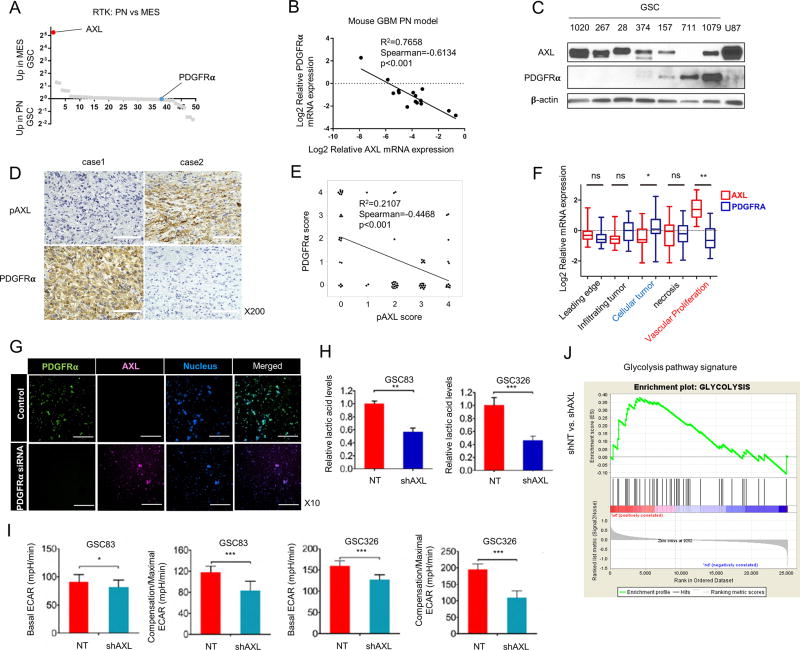
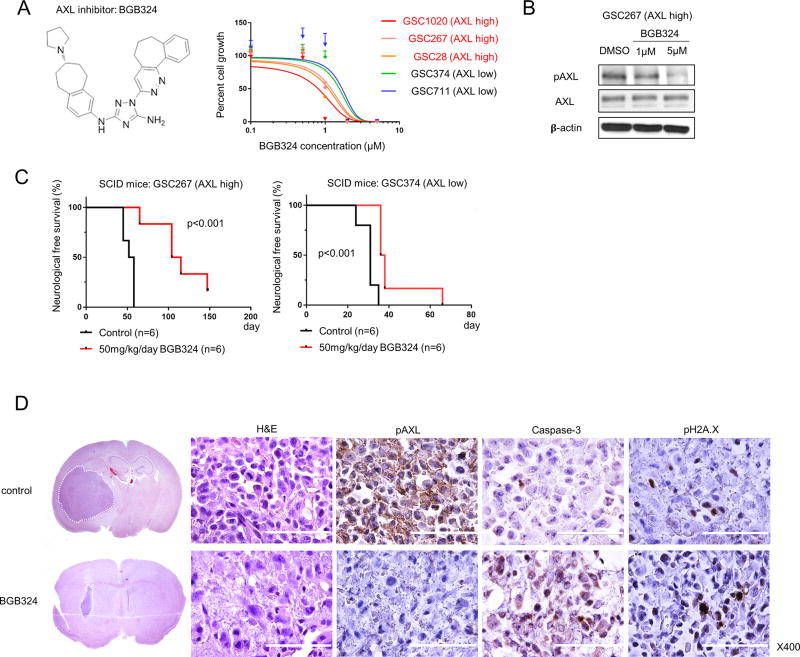
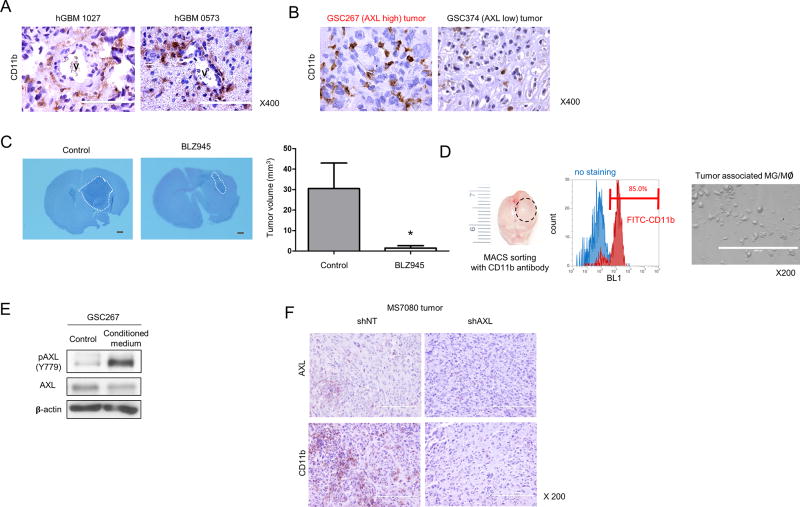
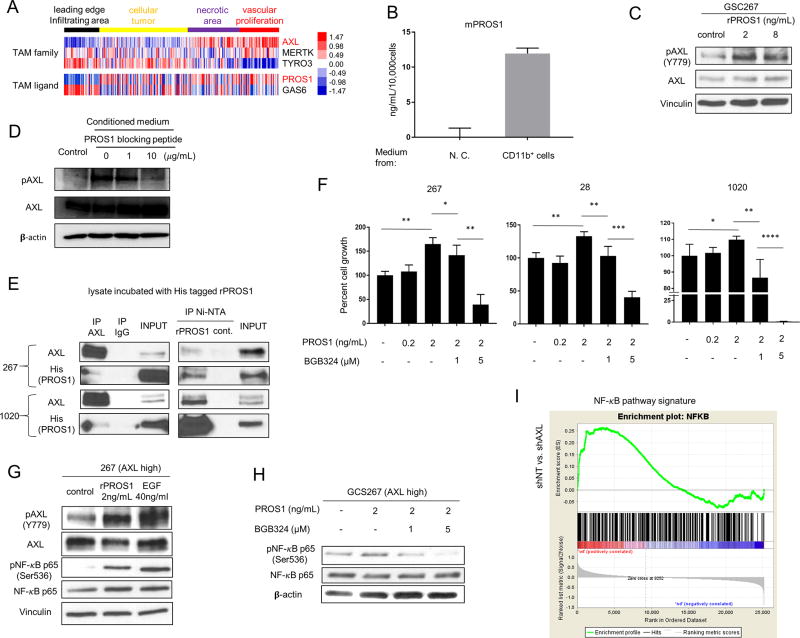
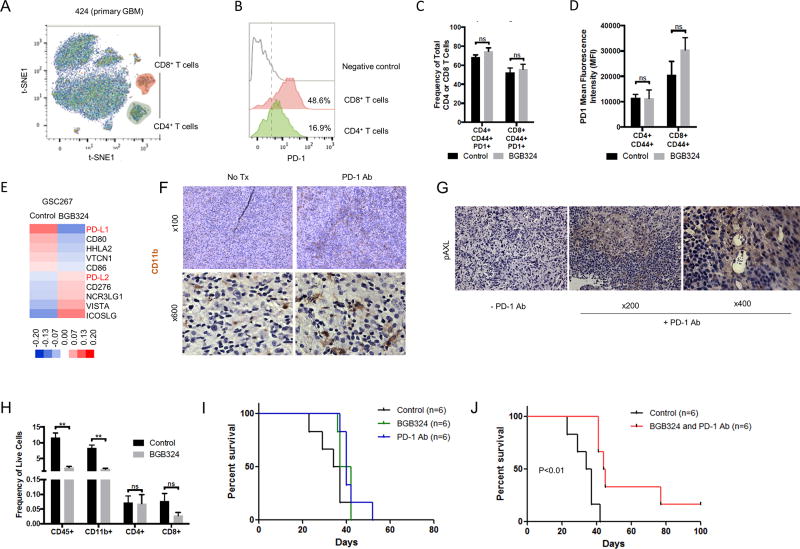
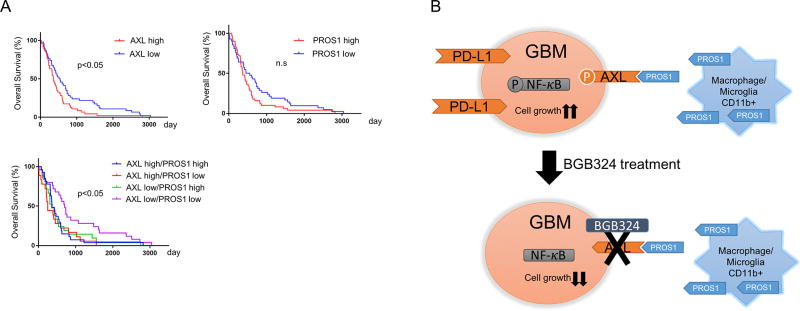
Glioblastoma (GBM) is a lethal disease with no effective therapies available. We previously observed upregulation of the TAM (Tyro-3, Axl, and Mer) receptor tyrosine kinase family member AXL in mesenchymal GBM and showed that knockdown of AXL induced apoptosis of mesenchymal, but not proneural, glioma sphere cultures (GSC). In this study, we report that BGB324, a novel small molecule inhibitor of AXL, prolongs the survival of immunocompromised mice bearing GSC-derived mesenchymal GBM-like tumors. We show that protein S (PROS1), a known ligand of other TAM receptors, was secreted by tumor-associated macrophages/microglia and subsequently physically associated with and activated AXL in mesenchymal GSC. PROS1-driven phosphorylation of AXL (pAXL) induced NFκB activation in mesenchymal GSC, which was inhibited by BGB324 treatment. We also found that treatment of GSC-derived mouse GBM tumors with nivolumab, a blocking antibody against the immune checkpoint protein PD-1, increased intratumoral macrophages/microglia and activation of AXL. Combinatorial therapy with nivolumab plus BGB324 effectively prolonged the survival of mice bearing GBM tumors. Clinically, expression of AXL or PROS1 was associated with poor prognosis for patients with GBM. Our results suggest that the PROS1-AXL pathway regulates intrinsic mesenchymal signaling and the extrinsic immune microenvironment, contributing to the growth of aggressive GBM tumors.Significance: These findings suggest that development of combination treatments of AXL and immune checkpoint inhibitors may provide benefit to patients with GBM. Cancer Res; 78(11); 3002-13. ©2018 AACR.


Conflict of interest statement

The authors declare no potential conflicts of interest.

Figures

Figure 1
Figure 1
Expression of AXL is negatively correlated with PDGFRα expression in glioma sphere models. A. Transcriptome microarray analysis (GSE67089) of the relative mRNA expression levels of 49 RTKs in samples from 15 MES and 12 PN GSCs. AXL is the most highly expressed RTK in MES GSCs, while PDGFRα is expressed at the lowest level in GSCs. B. qRT-PCR analysis of AXL and PDGFRα expression levels in samples from a PDGFB overexpression mouse glioma model. The mRNA expression pattern of the two genes has a negative correlation (n = 15, R2 = 0.7658, Spearman = −0.6134, P < 0.001). C. A representative Western blot showing the negative correlation between PDGFRα and AXL protein expression in samples from 7 GSCs and the U87 cell line; β-Actin served as a loading control. D and E. Expression of PDGFRα and phospho-AXL in human GBM tissues is mutually exclusive. Expression of PDGFRα and pAXL was analyzed in tumor samples from 66 patients (37 males; 29 females; median age, 56) with GBM. Fresh tumor tissues were obtained by biopsy or surgery from 1998 to 2016 at Kanazawa University. Representative IHC images are shown (D). Case 1 GBM shows positive cytoplasmic expression of PDGFRα and negative pAXL expression. Case 2 GBM shows negative PDGFRα expression, but a positive expression of pAXL at the membranes. Scale bars, 100 µm. (E). Analysis of PDGFRα and pAXL expression in 66 samples show that expression is mutually exclusive (n = 66, R2 = 0.2107, Spearman = −0.4468, P < 0.001). F. Data from the IVY Atlas Project Database revealed that AXL and PDGFRα are enriched in different tumor regions (**P < 0.001, ***P < 0.0001, t-test). G. Fluorescent images of control group and PDGFRα siRNA group with PDGFRα (green: FAM) and AXL (red: CY5) molecular beacons. Scale bars, 250 µm. H. Graphical representation of the relative lactic acid levels in MES cell lines expressing non-targeting shRNAs (NT) and shRNAs targeting AXL (shAXL). Two different MES cell lines, GSC83 and GSC326, were tested (**P < 0.05, *** P < 0.001). I. Graphical representation of the basal extracellular acidification rate (ECAR) and compensation/maximal ECAR in MES cell lines expressing NT and shAXL (*P < 0.05, *** P < 0.0001). J. GSEA showing glycolysis (right) signature is reduced in AXL-depleted GSCs. The normalized enrichment score (NES) is shown in the plot.
Figure 2
Figure 2
BGB324 treatment inhibits AXL activity more effectively in cells with high levels of AXL expression. A. The molecular structure of BGB324, an AXL inhibitor (left) and a graphical representation showing that BGB324 inhibition of AXL in several GSCs results in a decrease in cell growth (right). The IC50 for BGB324 in cells expressing high levels of AXL is lower than that in cells expressing low levels of AXL. B. Western blot analysis shows that after 3 days of treatment with 1 or 5 µM BGB324, AXL is dephosphorylated in GSC267 cells. C. Kaplan-Meier survival curves generated from data obtained from xenograft mice inoculated with either GSC267 (AXL high) or GSC374 (AXL low) cells, with and without BGB324 treatment for 10 days (log-rank test). D. Representative hematoxylin and eosin (H&E) staining and IHC of GSC267 xenografts after 10 days of BGB324 treatment. In the H&E-stained coronal sections, white broken lines show the tumor area. Positive staining for Caspase 3 and pH2A.X indicates apoptosis. Scale bars, 100 µm.
Figure 3
Figure 3
Tumor-associated macrophages activate AXL in GSCs. A. IHC analysis of human GBMs using CD11b antibodies; vessels (V) are shown. Scale bars, 100 µm. B. IHC analysis of tumors from xenograft mice inoculated with either GCS267 (AXL high) or GSC374 (AXL low) cells using CD11b antibodies. Scale bars, 100 µm. C. CD11b(+) cell depletion by BLZ945, Csf1b inhibitor, suppresses tumor growth. H&E staining and tumor volume of a MS7080 tumor from mice treated with BLZ945 (* P < 0.05). White broken lines show the tumor area. Scale bars, 1 mm. D. After MACS sorting of xenograft samples with a CD11b antibody (left), data obtained from FACS analysis show that samples consist of more than 85% CD11b positive cells (middle). Ten thousand cells were cultured in 1 mL RPMI-1640 medium without serum for 48 hours (right). Scale bars, 200 µm. E. Western blot analysis of phospho (p) and total AXL in GSC267 cells starved for 24 h, followed by incubation with conditioned medium from CD11b-expressing cells (described in C). β-Actin served as a loading control. F. Representative images of IHC analysis using AXL or CD11b antibodies after the intracranial transplantation of MS7080 transduced with shRNA against AXL (shAXL) or a non-targeting control (shNT). Scale bars, 200 µm.
Figure 4
Figure 4
PROS1 activates AXL in GSCs. A. Heat map obtained from the IVY Atlas Project database showing the localization differences between TAM receptors and ligands. B. ELISA of mouse PROS1 (mPROS1) expression in conditioned medium from tumor-associated MG/Mø or medium alone (no cells, “N.C.”). Ten thousand cells, enriched for CD11b expression (as in Fig. 3D), were cultured in 1 mL RPMI-1640 medium for 48 hours, and the supernatant was used for the ELISA. C. Western blot analysis of total and phospho-AXL in GSC267 cells treated with 2 or 8 ng/mL of recombinant PROS1. D. Western blot analysis of total- and pAXL in GSC267 cells starved for 24h, followed by incubation with conditioned medium treated with 1 or 10 µg/mL of PROS1 blocking peptide. E. Immunoprecipitation (IP) analysis of GSC lysates using an AXL antibody (left panel) or Ni-NTA for PROS1 (right panel), followed by immunoblot for PROS1 and AXL, showing the AXL-PROS1 interaction. Cells were harvested 24 h after EGF, bFGF, and B27 starvation; lysates were then incubated with His-tagged rPROS1. Whole cell lysates with input rPROS1 served as a positive control, and pull-downs with immunoglobin G served as a negative control. F. Cell growth assays for three different GSCs (28, 267, and 1020) expressing high AXL levels treated with PROS1 and BGB324 for 24 h (* P < 0.05, ** P < 0.01, or *** P < 0.001). The cells were cultured in medium without EGF/bFGF and B27. G. Western blot analysis of total AXL, pAXL, and their downstream target, pNF-κB p65. Cells were starved of EGF/FGF and B27 for 24 h, then harvested after 30 min of treatment with 2 ng/mL PROS1 or 40 ng/mL EGF. Vinculin served as a loading control. H. Western blot analysis of pNF-κB p65 and total NF-κB after treatment with PROS1 with or without BGB324; cells were treated as above in (F). β-Actin served as a loading control. I. GSEA showing NF-κB signature is reduced in AXL-depleted GSCs. NES is shown in the plot.
Figure 5
Figure 5
Co-treatment with BGB324 and PD-1 antibodies improves survival in mouse GBM models. A. Detection of CD4 (CD45+ CD3+ CD8+ CD4+) and CD8 T (CD45+ CD3+ CD4− CD8+) cell from primary GBM dissociated cells (424) after selection of CD45+ selection by CyTOF. B. Detection of PD-1 in CD4 and CD8 T infiltrating cells primary GBM tumor (424). Negative control: naïve CD8 T cells from blood. C–D. Effect of BGB324 on activated intratumoral T cells expressing PD-1. (C) Frequency of total CD4(+) or CD8(+) T cells in mouse tumors from mice treated with BGB324 for 10 days (50 mg/kg/day). (D) mean fluorescence intensity (MFI). E. Heat map of the B7 family generated using microarray data obtained from GSC267 xenograft tumors treated with BGB324. F. IHC analysis showing CD11b staining in a representative sample of a MS7080 tumor from mice treated with PD-1 antibody (Ab). G. IHC analysis of mouse tumors from mice treated with PD-1 Ab using pAXL Ab. H. The frequency of infiltrating CD45(+), CD11b(+), CD4(+), or CD8(+) cells in mouse tumors from mice treated with BGB324. F. Kaplan-Meier curve of MS7080 tumor-bearing mice treated with PD-1 Ab four times (10 mg/kg, days 3, 7, 10 and 13) or BGB324 for 10 days (50 mg/kg/day). G. Kaplan-Meier curve for mice with MS7080 tumors treated with PD-1 Ab four times (10 mg/kg, days 3, 7, 10 and 13) and BGB324 for 10 days (50 mg/kg/day).
Figure 6
Figure 6
Expression of either AXL and/or PROS1 were clinically associated with a poor prognosis for GBM patients. A. Kaplan-Meier curve showing patient survival data (TCGA data) stratified based on AXL and PROS1 expression levels. Patients expressing lower levels of AXL survived for a significantly longer period than those expressing higher levels (upper left). Patients expressing lower levels of PROS1 survived for a significantly longer period than those expressing higher levels (upper right). Patients expressing lower levels of both AXL and PROS1 survived longer than other groups (lower left). Statistical analysis was performed with a log-rank test (P < 0.05). B. Schematic representation of the effects of BGB324 treatment on GBM. Tumor-associated macrophages produce PROS1, which binds to AXL resulting in AXL phosphorylation and activation. Downstream targets of AXL, such as NF-κB, are activated, leading to expression of PD-L1 and subsequent cell growth. These events are inhibited by BGB324 treatment.

Similar articles

Cited by

References

    1. Cheng P, Phillips E, Kim SH, Taylor D, Hielscher T, Puccio L, et al. Kinome-wide shRNA screen identifies the receptor tyrosine kinase AXL as a key regulator for mesenchymal glioblastoma stem-like cells. Stem Cell Reports. 2015;4:899–913. - PMC - PubMed
    1. Graham DK, DeRyckere D, Davies KD, Earp HS. The TAM family: phosphatidylserine sensing receptor tyrosine kinases gone awry in cancer. Nature reviews Cancer. 2014;14:769–85. - PubMed
    1. Stitt TN, Conn G, Gore M, Lai C, Bruno J, Radziejewski C, et al. The anticoagulation factor protein S and its relative, Gas6, are ligands for the Tyro 3/Axl family of receptor tyrosine kinases. Cell. 1995;80:661–70. - PubMed
    1. Varnum BC, Young C, Elliott G, Garcia A, Bartley TD, Fridell Y-W, et al. Axl receptor tyrosine kinase stimulated by the vitamin K-dependent protein encoded by growth-arrest-specific gene 6. Nature. 1995;373:623–6. - PubMed
    1. Ben-Batalla I, Schultze A, Wroblewski M, Erdmann R, Heuser M, Waizenegger JS, et al. Axl, a prognostic and therapeutic target in acute myeloid leukemia mediates paracrine crosstalk of leukemia cells with bone marrow stroma. Blood. 2013;122:2443–52. - PubMed

Publication types

MeSH terms