. 2018 Mar 12;8(1):4318.
doi: 10.1038/s41598-018-22438-y.

Understanding the prebiotic potential of different dietary fibers using an in vitro continuous adult fermentation model (PolyFermS)

Affiliations

Understanding the prebiotic potential of different dietary fibers using an in vitro continuous adult fermentation model (PolyFermS)

Sophie A Poeker et al. Sci Rep. .

Abstract

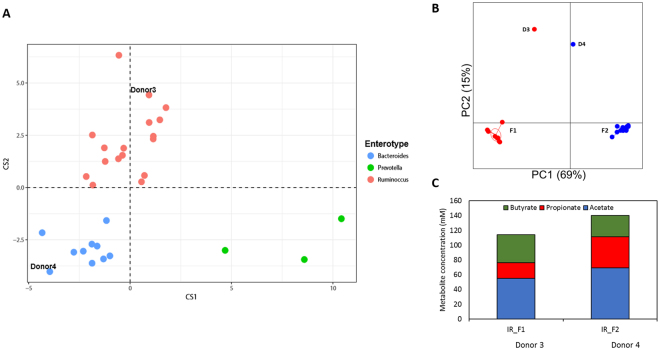
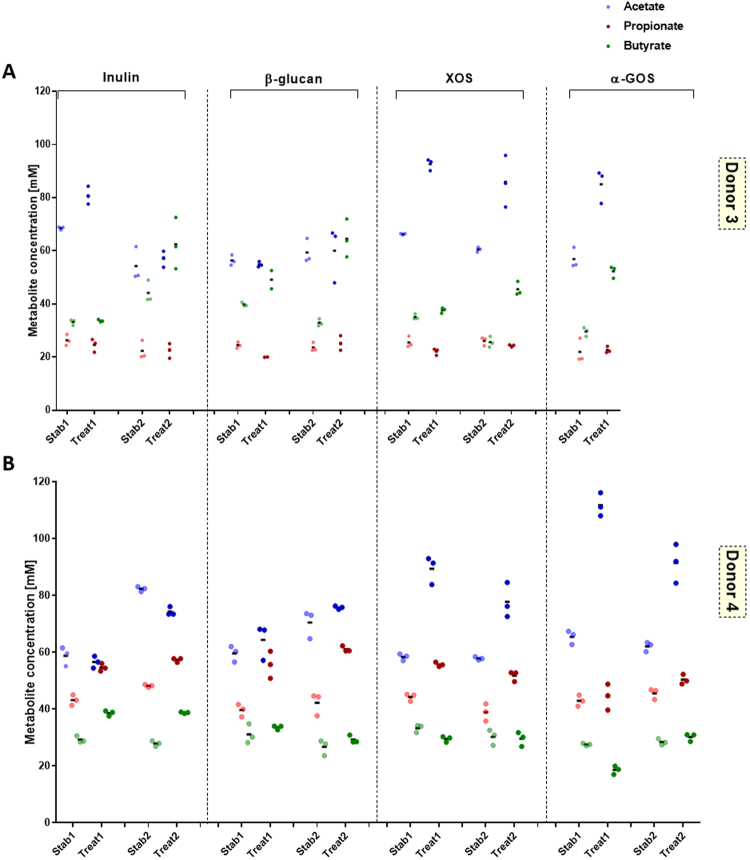
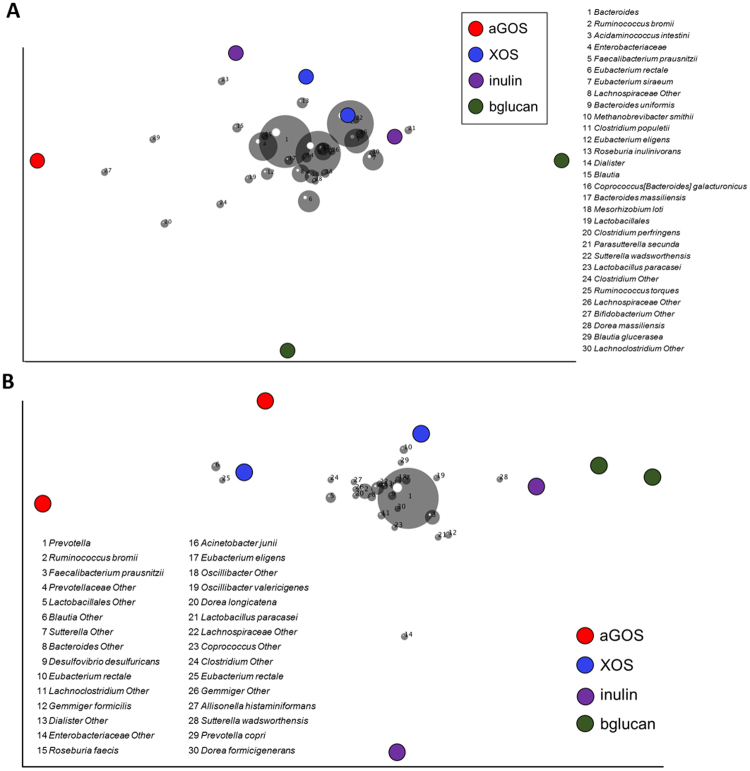
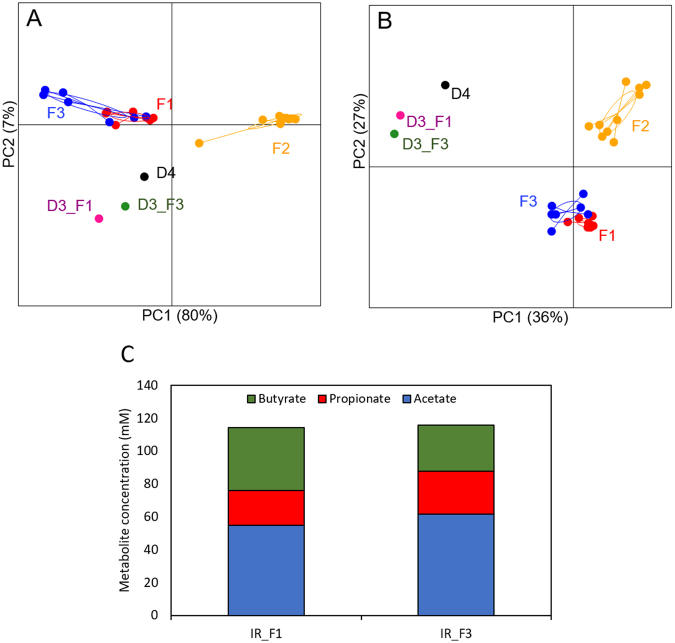
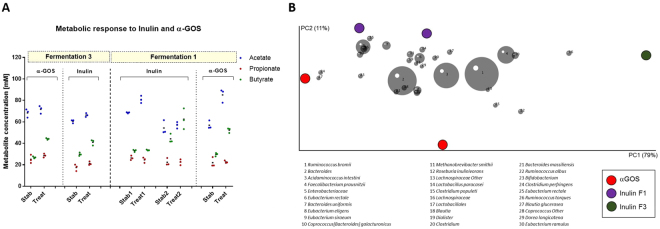
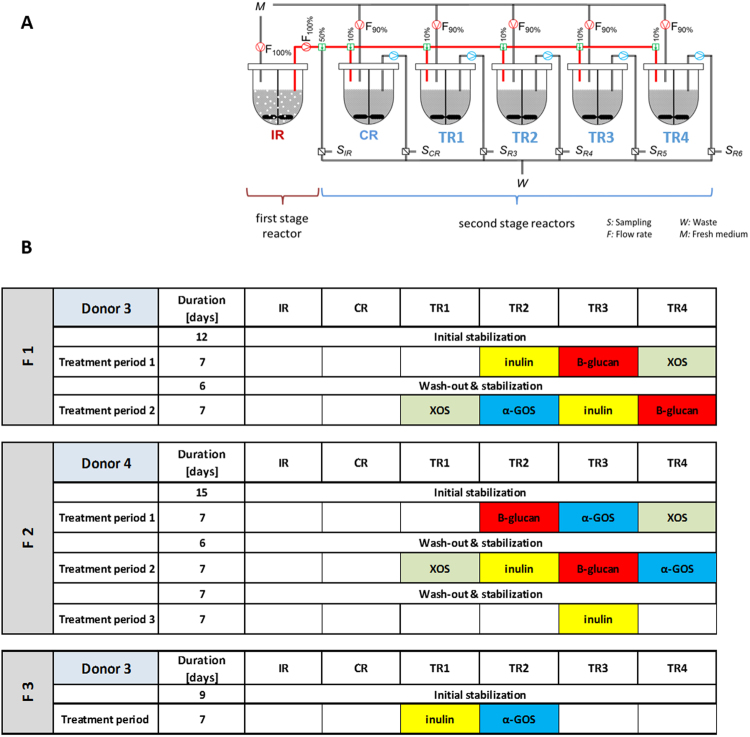
Consumption of fermentable dietary fibers (DFs), which can induce growth and/or activity of specific beneficial populations, is suggested a promising strategy to modulate the gut microbiota and restore health in microbiota-linked diseases. Until today, inulin and fructo-oligosaccharides (FOS) are the best studied DFs, while little is known about the gut microbiota-modulating effects of β-glucan, α-galactooligosaccharide (α-GOS) and xylo-oligosaccharide (XOS). Here, we used three continuous in vitro fermentation PolyFermS model to study the modulating effect of these DFs on two distinct human adult proximal colon microbiota, independently from the host. Supplementation of DFs, equivalent to a 9 g daily intake, induced a consistent metabolic response depending on the donor microbiota. Irrespective to the DF supplemented, the Bacteroidaceae-Ruminococcaceae dominated microbiota produced more butyrate (up to 96%), while the Prevotellaceae-Ruminococcaceae dominated microbiota produced more propionate (up to 40%). Changes in abundance of specific bacterial taxa upon DF supplementation explained the observed changes in short-chain fatty acid profiles. Our data suggest that the metabolic profile of SCFA profile may be the most suitable and robust read-out to characterize microbiota-modulating effects of a DF and highlights importance to understand the inter-individual response to a prebiotic treatment for mechanistic understanding and human application.


Conflict of interest statement

The authors declare no competing interests.

Figures

Figure 1
Figure 1
(A) Variation in fecal microbiota among the 30 healthy individuals represented in an enterotype plot for 16S rRNA gene amplicon sequence dataset generated as described on http://enterotyping.embl.de/. (B) Principle Coordinate Analysis based on the weighted UniFrac distance matrix on OTU level generated from fecal and non-treated PolyFermS microbiota of fermentation 1 (F1 with donor 3 microbiota) and fermentation 2 (F2 with donor 4 microbiota), showing conservation of the two distinct donor microbiota profiles in PolyFermS model. Microbiota included from inoculum reactor (IR) and control reactor (CR) from F1 on day 12, day 19, day 24 and day 31 and for F2 on day 8, day 14, day 19, day 25, day 31 and day 37. (C) Bar-plot representation of mean acetate (blue), propionate (red) and butyrate (green) concentrations (mM) of PolyFermS effluent samples of IR during stable operation phase and connection with experimental reactors (IR_F1: day 1–day 36; IR_F2: day 1–day 42).
Figure 2
Figure 2
Effect of dietary fiber supplementation on fermentation metabolite concentration (A and B) and microbiota of fermentation 1 (F1) (donor 3) and fermentation 2 (F2) (donor 4). Mean (black horizontal line) from 3 consecutive measurements of acetate, propionate and butyrate concentrations (mM) in the respective reactor at end of stabilization and treatment phase for F1 (D3 microbiota) (A) and F2 (D4 microbiota) (B). Two replicates are shown for each dietary fiber treatment.
Figure 3
Figure 3
Effect of dietary fiber supplementation on microbiota (A and B) of fermentation 1 (F1; donor 3) and fermentation 2 (F2; donor 4). Principle components analysis (PCA) biplot showing variation among the PolyFermS microbiota of F1 (B) and F2 (D) after supplementation with dietary fibers XOS, a GOS, b glucan and inulin. Variables included in the PCA were relative abundance of OTUs (>0,05%) and OTUs are represented as numbers.
Figure 4
Figure 4
Reproducability over time of PolyFermS model inoculated with same healthy fecal donor (D3); F3 was operated 15 months after F1. PCoA plots of weighted (A) and unweighted (B) were performed based on the UniFrac distance matrix generated from sequencing V4 region of 16S rRNA genes in samples from donor’s feces and fermentation effluents of F1 (D3), F2 (D4) and F3 (D3). Each circle represents a sample from feces and effluent samples from F1 (D3) (red), F2 (D4) (orange) and F3 (D3) (purple). Bar-plot representation of the mean acetate (blue), propionate (red) and butyrate (green) concentrations (mM) (C) of PolyFermS effluent samples of inoculum reactor (IR) during stable operation phase and connection with experimental reactors (IR_F1: day 1–day 36; IR_F3: day 1–day 23); D3, donor 3; F1, fermentation 1; F2, fermentation 2; D4, donor 4; F3, fermentation 3.
Figure 5
Figure 5
Repetition of α-GOS and inulin supplementation to D3 microbiota in PolyFermS resulted in comparable higher butyrate productions and stimulates specific OTUs (PCA). (A) Mean (black horizontal line) from 3 consecutive measurements of acetate, propionate and butyrate concentrations (mM) in the respective reactor at end of stabilization and treatment phase for fermentation 1(F1) and fermentation 3 (F3) (donor 3).Two replicates are shown for each dietary fiber treatment. (B) Principle components analysis (PCA) biplot showing variation in the PolyFermS microbiota of F1 and F3 after supplementation with dietary fibers a GOS and inulin. Variables included in the PCA were relative abundance of OTUs (>0,05%) and OTUs are represented as numbers.
Figure 6
Figure 6
Experimental set-up (A) and time schedule (B) of the continuous fermentation model with inoculum reactor (IR) and control (CR) and treatment (TR) reactors. CR and TR’s were fed with effluent from IR and with nutritive medium during stabilization and washout periods. TRs were fed with effluent from IR and supplemented fermentation medium (4 g/L dietary fiber) during treatment periods.

References

    1. Qin J, et al. A human gut microbial gene catalogue established by metagenomic sequencing. Nature. 2010;464:59–65. doi: 10.1038/nature08821. - DOI - PMC - PubMed
    1. Turnbaugh PJ, et al. A core gut microbiome in obese and lean twins. Nature. 2009;457:480–484. doi: 10.1038/nature07540. - DOI - PMC - PubMed
    1. De Filippo C, et al. Impact of diet in shaping gut microbiota revealed by a comparative study in children from Europe and rural Africa. PNAS. 2010;107:14691–14696. doi: 10.1073/pnas.1005963107. - DOI - PMC - PubMed
    1. Tremaroli V, Backhed F. Functional interactions between the gut microbiota and host metabolism. Nature. 2012;489:242–249. doi: 10.1038/nature11552. - DOI - PubMed
    1. Walker AW, Lawley TD. Therapeutic modulation of intestinal dysbiosis. Pharmacological research: the official journal of the Italian Pharmacological Society. 2013;69:75–86. doi: 10.1016/j.phrs.2012.09.008. - DOI - PubMed

Publication types