. 2018 Mar 12;8(1):4382.
doi: 10.1038/s41598-018-22380-z.

Spatio-temporal dynamics of soil bacterial communities as a function of Amazon forest phenology

Affiliations

Spatio-temporal dynamics of soil bacterial communities as a function of Amazon forest phenology

Erika Buscardo et al. Sci Rep. .

Abstract

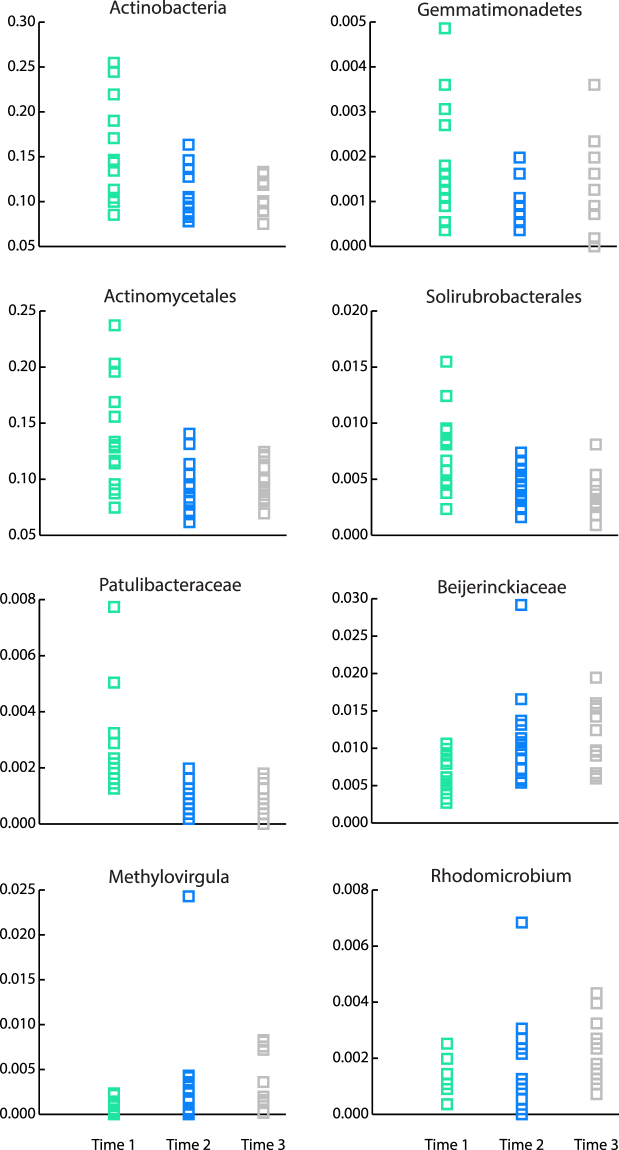
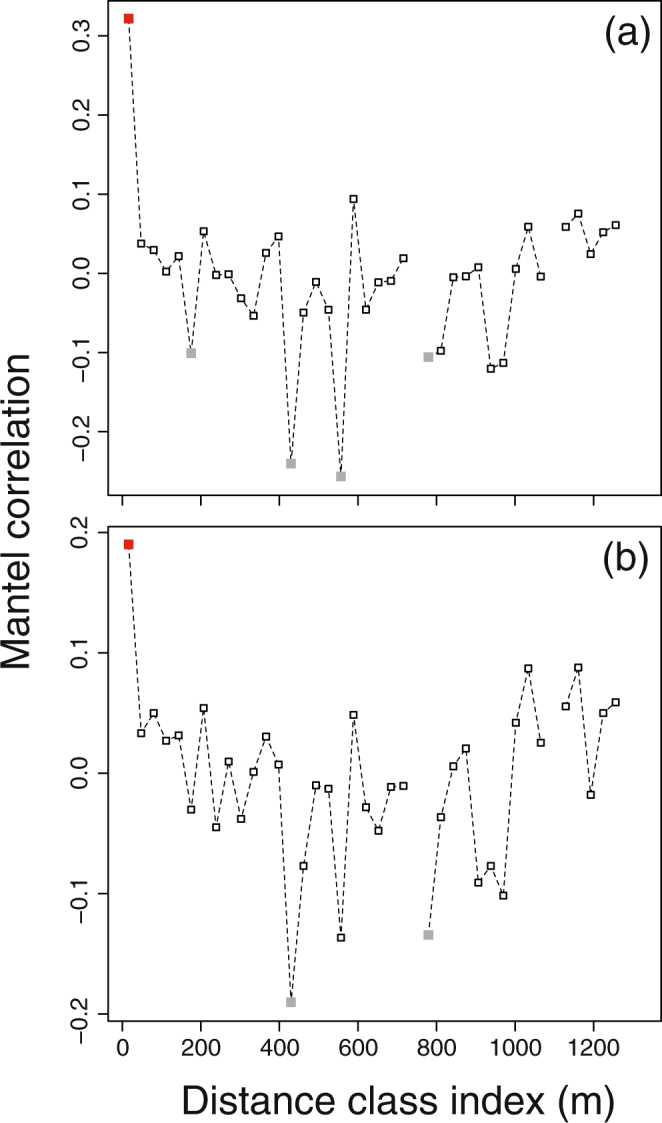
Most tropical evergreen rain forests are characterised by varying degrees of precipitation seasonality that influence plant phenology and litterfall dynamics. Soil microbes are sensitive to soil water:air ratio and to nutrient availability. We studied if within-year seasonality in precipitation and litterfall-derived nutrient input resulted in predictable seasonal variation in soil bacterial diversity/microbial functional groups in an Amazonian forest. We characterised the spatio-temporal dynamics of microbial communities from the plot to the stand scales and related them to precipitation seasonality and spatial variability in soil characteristics. Community composition and functional diversity showed high spatial heterogeneity and was related to variability in soil chemistry at the stand level. Large species turnover characterised plot level changes over time, reflecting precipitation seasonality-related changes in soil nutrient and moisture regimes. The abundance of decomposers was highest during the rainy season, characterised also by anaerobic saprophytes and N2-fixers adapted to fluctuating redox conditions. In contrast, Beijerinckiaceae, likely derived from the phyllosphere, were found at higher abundances when litter inputs and accumulation were highest. We showed that in a mildly seasonal rain forest, the composition of soil microbial communities appears to be following canopy phenology patterns and the two are interlinked and drive soil nutrient availability.


Conflict of interest statement

The authors declare no competing interests.

Figures

Figure 1
Figure 1
Four alternative hypotheses on the potential influence of spatial and temporal (i.e. seasonality) variability on soil bacterial community composition in a LTERF on terra firme in Amazonia, Brazil (modified after Martiny, et al.). H1, bacterial communities are randomly distributed both in space and time (i.e. they are not influenced by resource spatial variability and by seasonality patterns); H2, bacterial community composition is influenced by resource spatial variability, but not by seasonality patterns; H3, bacterial community composition is influenced by seasonality patterns, but not by resource spatial variability; H4, bacterial community composition reflects both spatial and temporal conditions. For readability five sample points of the 15 in the present study are shown. Different colours represent samples collected during the rainy season (green), at the transition between rainy and dry season (blue), and during the dry season (grey).
Figure 2
Figure 2
Rarefaction curves representing the relationship between the number of sequences (obtained by Ion Torrent sequencing of bacterial 16 S rDNA amplicon libraries generated from DNA extracted from soil samples collected in a LTERF during the rainy season - Time 1, at the transition between rainy and dry season - Time 2, and during the dry season - Time 3), and the number of operational taxonomic units (OTUs), assigned at 97% sequence similarity. Time 1, green; Time 2, blue; Time 3, grey.
Figure 3
Figure 3
Canonical correspondence analysis (CCA) ordination plots based on relative abundances of rarefied taxonomic data of soil bacterial communities in response to seasonal dynamics in a LTERF forest. Total inertia, 3.53; Constrained 0.58; Eigenvalues CCA 1, 0.18; CCA 2, 0.13. Identical symbols in different colours refer to the individuals plots at the three sampling time. Time 1, green (rainy season); Time 2, blue (transition into dry season); Time 3, grey (dry season). Significant environmental variables were included in the ordination following a sequential ANOVA significance assessment of each single term. Ellipses denote 95% confidence intervals using standard error of the weighted average plot scores at each sampling time. Vectors representing bacterial taxa at phylum and lower taxonomic levels were fit into the ordination by using the ‘vegan’ envfit function and their significance assessed under 999 permutations. Because of the high number of taxa, vectors are distributed over four identical ordination plots (a), phylum; (b), order; (c), family, (d), genus; identical colour to identify taxa within a phylum). Prec30days, precipitation in the 30 days preceding sampling; OM, soil organic matter; P, phosphate; Ca, calcium; Acidi, Acidimicrobineae Incertae Sedis; Actino, Actinospicaceae; Microba, Microbacteriaceae; Micromo, Micromonosporaceae; Mycoba, Mycobacteriaceae; Noca, Nocardiaceae; Streptomy, Streptomycetaceae; Streptosp, Streptosporangiaceae; Patuli, Patulibacteraceae; Alicy, Alicyclobacillaceae; Baci, Bacillaceae 1; Paenibaci, Paenibacillaceae 1; Planoco, Planococcaceae; Clostrid, Clostridiaceae 1; Gemma, Gemmatimonadaceae; Beijer, Beijerinckiaceae; Brady, Bradyrhizobiaceae; Hypho, Hyphomicrobiaceae; Aceto, Acetobacteraceae; Rhodo, Rhodospirillaceae; Burk, Burkholderiaceae; Poly, Polyangiaceae; Xantho, Xanthomonadaceae.
Figure 4
Figure 4
Relative abundances of bacterial taxa that significantly changed in response to seasonality in precipitation and litterfall in a LTERF. Time 1, green (rainy season); Time 2, blue (transition into dry season); Time 3, grey (dry season). For Gemmatimonadetes identical abundance values were found at all taxonomic levels and therefore only the phylum level figure is shown; for Patulibacteraceae and Patulibacter identical values are represented by Patulibacteraceae.
Figure 5
Figure 5
Mantel correlograms showing the correlations between soil bacterial community composition (ßsor) at different distance classes at taxonomic (a) and phylogenetic (b) levels. Filled squares indicate a significant Mantel r –value (red, positive; grey, negative).
Figure 6
Figure 6
Average annual monthly rainfall and standard errors (SE) measured at the meteorological station of the study site during the period 1966–2014 (filled) and for the year 2013 (unfilled). In green the mean monthly litterfall inputs (±SE) from a LTERF forest in proximity of our study site over a three year period 1979–1982.

References

    1. Wright SJ, van Schaik CP. Light and the phenology of tropical trees. The American Naturalist. 1994;143:192–199. doi: 10.1086/285600. - DOI
    1. Wu J, et al. Leaf development and demography explain photosynthetic seasonality in Amazon evergreen forests. Science. 2016;351:972–976. doi: 10.1126/science.aad5068. - DOI - PubMed
    1. Bardgett RD, Bowman WD, Kaufmann R, Schmidt SK. A temporal approach to linking aboveground and belowground ecology. Trends in ecology & evolution. 2005;20:634–641. doi: 10.1016/j.tree.2005.08.005. - DOI - PubMed
    1. Ettema CH, Wardle DA. Spatial soil ecology. Trends in ecology & evolution. 2002;17:177–183. doi: 10.1016/S0169-5347(02)02496-5. - DOI
    1. Schmidt SK, et al. Biogeochemical consequences of rapid microbial turnover and seasonal succession in soil. Ecology. 2007;88:1379–1385. doi: 10.1890/06-0164. - DOI - PubMed

Publication types

LinkOut - more resources