. 2018 Mar 12;8(1):4346.
doi: 10.1038/s41598-018-22610-4.

Cost-effective generation of precise label-free quantitative proteomes in high-throughput by microLC and data-independent acquisition

Affiliations

Cost-effective generation of precise label-free quantitative proteomes in high-throughput by microLC and data-independent acquisition

Jakob Vowinckel et al. Sci Rep. .

Abstract

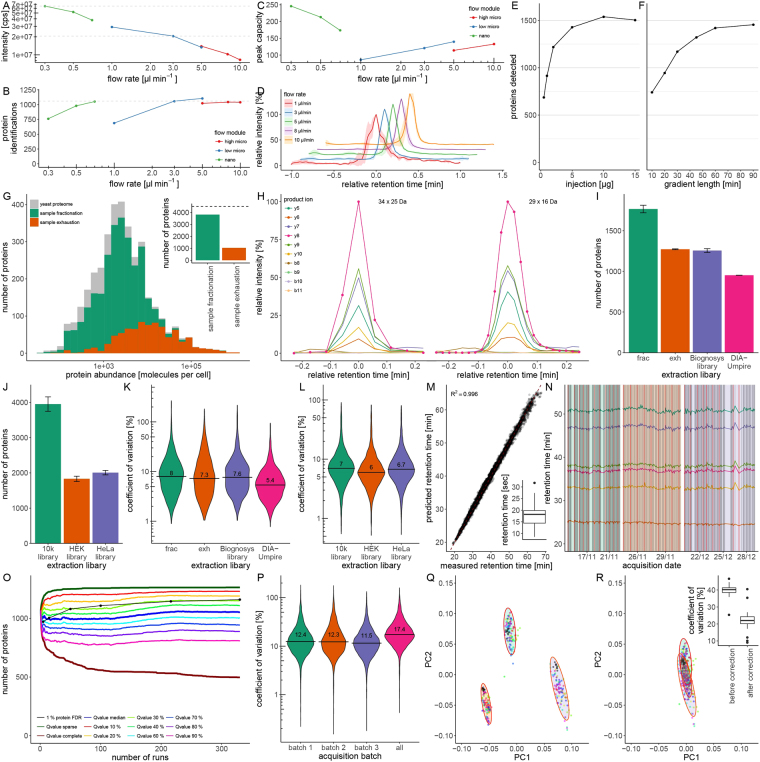
Quantitative proteomics is key for basic research, but needs improvements to satisfy an increasing demand for large sample series in diagnostics, academia and industry. A switch from nanoflowrate to microflowrate chromatography can improve throughput and reduce costs. However, concerns about undersampling and coverage have so far hampered its broad application. We used a QTOF mass spectrometer of the penultimate generation (TripleTOF5600), converted a nanoLC system into a microflow platform, and adapted a SWATH regime for large sample series by implementing retention time- and batch correction strategies. From 3 µg to 5 µg of unfractionated tryptic digests that are obtained from proteomics-typical amounts of starting material, microLC-SWATH-MS quantifies up to 4000 human or 1750 yeast proteins in an hour or less. In the acquisition of 750 yeast proteomes, retention times varied between 2% and 5%, and quantified the typical peptide with 5-8% signal variation in replicates, and below 20% in samples acquired over a five-months period. Providing precise quantities without being dependent on the latest hardware, our study demonstrates that the combination of microflow chromatography and data-independent acquisition strategies has the potential to overcome current bottlenecks in academia and industry, enabling the cost-effective generation of precise quantitative proteomes in large scale.


Conflict of interest statement

The authors J.V., R.B. and L.R. are employees of Biognosys AG (Switzerland). Spectronaut is a trademark of Biognosys AG.

Figures

Figure 1
Figure 1
(A) Dependency of signal intensity on flow rate in a proteomic experiment. Combined intensities of standardized peptides (iRT) determined using nano, low-micro, and high-micro flow regimes on an Eksigent 425 LC system equipped with three respective flow modules and recorded on a TripleTOF5600 mass spectrometer. Signal intensity is a function of the dilution rate, with a factor of 0.3 between 0.3 µL/min and 3 µL/min. (B) Dependency of protein identifications on flow rate in a proteomic experiment. The number of detectable proteins by DDA were determined using nano, low-micro, and high-micro flow regimes on an Eksigent 425 LC system equipped with three respective flow modules and recorded on a TripleTOF5600 mass spectrometer. Number of identified proteins increased moderately with flow rate. (C) Peak capacities on a proteomic microLC set-up. Peak capacity was calculated from the measurement of standard peptides on the same chromatographic setup, varying the flow rate from 300 nL/min to 10 µL/min. Peak capacities of microLC increase with flow rate. (D) Peak characteristics on a proteomic microLC set-up. Average precursor peak shapes of 5 iRT peptides determined using flow rates of 1–10 µL/min on an Eksigent 3C18-CL-120 column. Chromatography is stable and reproducible in flow rates >1 µL/min. Shaded areas represent standard deviation of signal intensity. (E) 2 µg tryptic protein digest is sufficient to quantify >1200 yeast proteins in a single injection in microLC-SWATH-MS. Tryptic digests obtained from 1–15 µg of yeast whole proteome extracts were injected and separated using a 60 min water to acetonitrile gradient at a flow-rate of 3 µL/min. 914 proteins were quantified with 1 µg, 1219 proteins with 2 µg, 1428 proteins with 5 µg and 1504 proteins with 15 µg digested protein. (F) A 30 min LC gradient is sufficient to quantify >1000 yeast proteins in a single injection in microLC-SWATH-MS. A tryptic digest derived from 5 µg yeast protein was injected and separated using water-to-acetonitrile chromatographic gradients of 10–90 min at a flow-rate of 3 µL/min. Extraction of the SWATH spectra yielded quantifiable peptides for 740 proteins (10 min), 946 proteins (20 min), 1170 proteins (30 min), 1322 proteins (45 min), 1420 proteins (60 min) and 1455 proteins (90 min). SWATH-MS data was extracted in Spectronaut 8.0 using a spectral library generated by yeast proteome prefractionation. (G) The coverage of the yeast proteome by microLC-based proteomics upon prefractionation. A yeast tryptic digest obtained from BY4741-pHLUM was first separated by high pH reverse phase chromatography on an analytical HPLC and then analyzed in DDA mode with m/z (gas phase) fractionation at 3 µL/min flow rate. In the sample exhaustion approach, the same digest was instead injected repeatedly until protein identification was saturated. When comparing the proteins identified in both approaches with the abundances of yeast proteins as measured by fluorescence microscopy, the most abundant proteins were consistently identified, while proteins with low expression levels were only identified upon pre-fractionation. Inset: In total, 3822 (84%) or 1037 (23%) out of 4517 expressed yeast proteins were identified using either microLC-SWATH method, respectively. (H) Peak representation in microLC-SWATH-MS. Extracted ion chromatogram (XIC) of the peptide TPVITGAPYYER recorded in microLC-SWATH mode using either 34 × 25 m/z or 29 × 16 m/z windows, respectively. A conventional (nanoLC-optimized) SWATH setting of 34 × 25 m/z with a cycling time of 3.3 s leads to a coverage of 5 points per peak. When limiting the mass range covered to 400–850 m/z which contains precursors for 96% of proteins, and reducing accumulation time to 40 ms, cycling time is 1.3 s to cover microLC chromatographic peaks by >11 data points, (I) Different strategies to construct SWATH spectral libraries and their application in microLC-SWATH-MS. A yeast tryptic digest was analyzed using microLC (0.3 mm × 250 mm Triart-C18, 3 µL/min, 60 min gradient) SWATH-MS by repeated (9×) injection of a tryptic digest derived from 10 µg yeast protein. Data was processed with Spectronaut 8.0 using SWATH libraries generated by either sample fractionation (frac), sample exhaustion (exh; matrix-matched library), using a spectral library recorded in an unrelated lab and instrument set-up (Biognosys library), or with a library generated by DIA-Umpire without physically recording a separate spectral library. Data analysis on the basis of the fractionation allowed quantification of 1766 proteins, the exhaustion library quantified 1271 proteins, the unrelated SWATH library 1256 proteins, and DIA-Umpire 952 proteins. DIA-Umpire yielded the lowest variability. (J) Human protein quantification using microLC-SWATH. A tryptic digest of a whole-cell protein extract from human K562 cells was analyzed using microLC (0.3 mm × 250 mm Triart-C18, 3 µL/min, 60 min gradient) and coupled to a TripleTOF5600 MS operating in SWATH mode by analysing 3 µg tryptic digest six times. Data was processed with Spectronaut 8.0 using a SWATH library obtained from the SWATHAtlas repository (10k library), or using SWATH libraries generated by repeated analysis of HEK293 or HeLa cell extracts (Spectronaut repository). Data extraction by using the rich library quantified 4169 K562 proteins, while 2031 proteins when using a library generated from HEK293 cells, and 1906 using a HeLa library, respectively. (K) Precision of yeast protein quantification using microLC-SWATH-MS. Signal variability (expressed as fold change) of 677 proteins present in all datasets was compared throughout nine replicates. Median coefficients of variation are between 7.3% and 8% for libraries generated using respectively fractionation (frac) and exhaustion (exh) approach, 7.6% for an unrelated yeast library, and 5.4% for DIA-Umpire. (L) Technical variability of human protein quantification is low in microLC-SWATH-MS. Signal variability (expressed as fold-change) of 726 proteins present in all datasets was compared throughout the six replicates. (M) Retention time stability microLC-SWATH-MS over 327 yeast whole-proteome acquisitions in three defined batches. Correlation between measured apex retention time and predicted retention time. Shown is a representative yeast sample acquired in SWATH mode. Inset: Mean retention time standard deviation of 6 iRT peptides across 327 injections is 17.7 s. (N) Retention time stability in large sample series as measured by microLC-SWATH-MS. 327 yeast tryptic digest samples spiked with iRT peptides were analyzed by microLC-SWATH-MS in three batches in a net acquisition time of 16 days (grey vertical lines). Retention times of iRT peptides are shown over time (colored lines), and retention time coefficient of variation for all peptides is lower than 2% over the whole period. Red vertical lines indicate the interspersed quality control samples (QC) sample measurements needed for batch correction. (O) Completeness of a large SWATH dataset is well represented with median Qvalue filtering. The number of proteins in a SWATH dataset of 1 to 327 yeast samples was determined with either sparse or complete Qvalue filtering, Qvalue percentile or Qvalue median filtering as implemented in Spectronaut software (coloured lines). The number of proteins was also determined when applying a 1% protein FDR filter (black line). (P) Quantification precision in large sample series as measured by microLC-SWATH-MS. Coefficient of variation for fold changes of 8686 peptides was calculated in batch 1 (green), batch 2 (orange), batch 3 (purple) or across batches (magenta) prior to batch correction. Intra-batch CVs were around 12%, while variability over the entire 27 day period was 17.4%, as calculated from the repeated measurement of QC samples (as in (N)). (Q) The quantification of 327 yeast proteomes before batch correction. 38 yeast strains were grown in three batches, and each batch was acquired as three technical replicates in SWATH-MS together with 10–12 evenly distributed QC samples. In a PCA, proteomes cluster according to the acquisition batch, with color-coded technical replicates clustering together. (R) The quantification of 327 yeast proteomes after batch correction. After batch correction based on the combined quality control sample profiles, clustering according to batches is reduced, and proteomes cluster according to the color-coded yeast strain. Inset: Median coefficients of variation of peptide intensities between all 9 replicates of each strain are 39.7 ± 3.2 before batch correction and 22.3 ± 5.4 after batch correction.

References

    1. Walzthoeni T, Leitner A, Stengel F, Aebersold R. Mass spectrometry supported determination of protein complex structure. Curr. Opin. Struct. Biol. 2013;23:252–260. doi: 10.1016/j.sbi.2013.02.008. - DOI - PubMed
    1. Angel TE, et al. Mass spectrometry-based proteomics: existing capabilities and future directions. Chem. Soc. Rev. 2012;41:3912–3928. doi: 10.1039/c2cs15331a. - DOI - PMC - PubMed
    1. Cardoza JD, Parikh JR, Ficarro SB, Marto JA. Mass spectrometry-based proteomics: qualitative identification to activity-based protein profiling. Wiley Interdiscip. Rev. Syst. Biol. Med. 2012;4:141–162. doi: 10.1002/wsbm.166. - DOI - PMC - PubMed
    1. Godoy L, de, Olsen JV, Cox J. Comprehensive mass-spectrometry-based proteome quantification of haploid versus diploid yeast. Nature. 2008;455:1251–1254. doi: 10.1038/nature07341. - DOI - PubMed
    1. Wilhelm M, et al. Mass-spectrometry-based draft of the human proteome. Nature. 2014;509:582–587. doi: 10.1038/nature13319. - DOI - PubMed

Publication types