. 2018 Mar 12;8(1):4333.
doi: 10.1038/s41598-018-22660-8.

Microbial metagenome of urinary tract infection

Affiliations

Microbial metagenome of urinary tract infection

Ahmed Moustafa et al. Sci Rep. .

Abstract

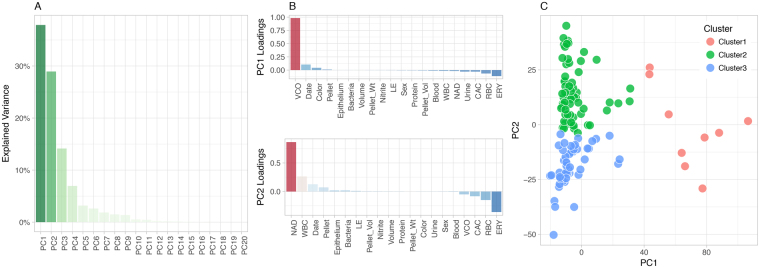
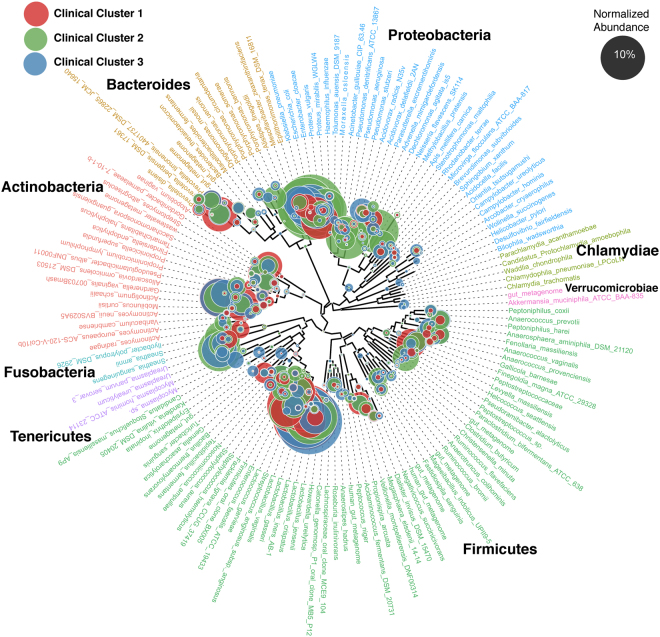
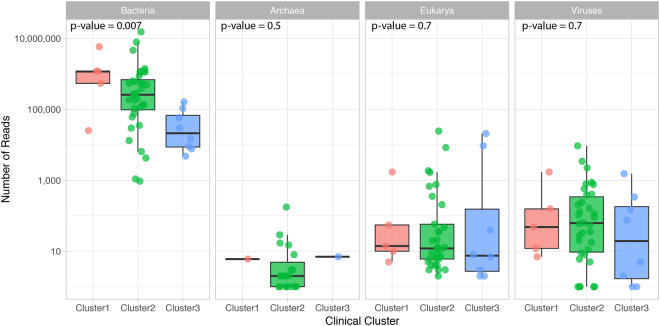
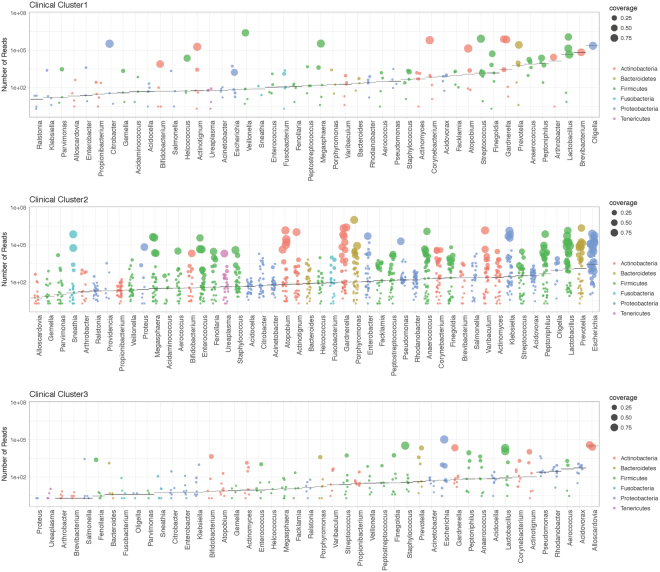
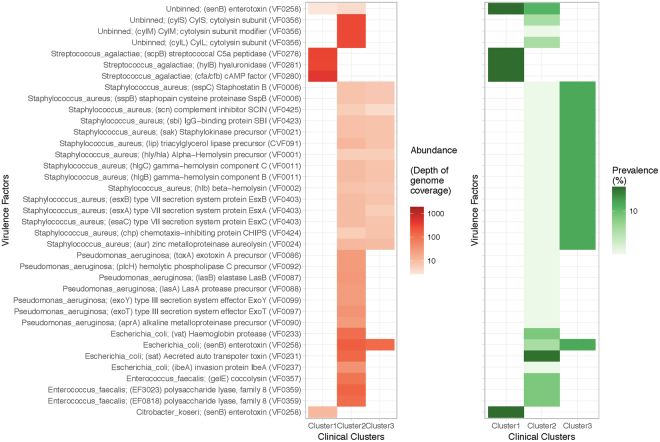
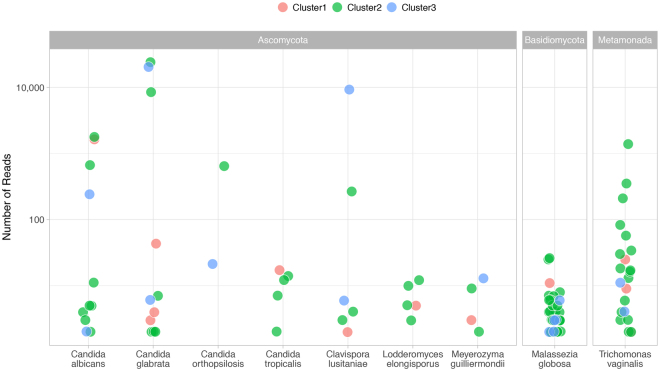
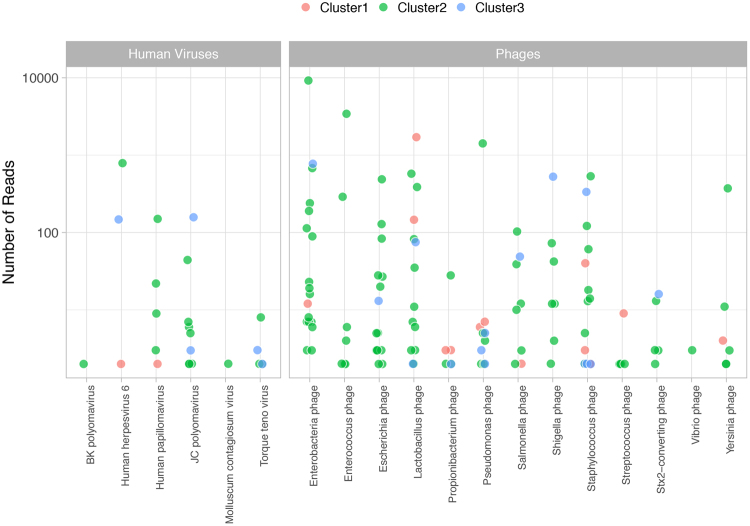
Urine culture and microscopy techniques are used to profile the bacterial species present in urinary tract infections. To gain insight into the urinary flora, we analyzed clinical laboratory features and the microbial metagenome of 121 clean-catch urine samples. 16S rDNA gene signatures were successfully obtained for 116 participants, while metagenome sequencing data was successfully generated for samples from 49 participants. Although 16S rDNA sequencing was more sensitive, metagenome sequencing allowed for a more comprehensive and unbiased representation of the microbial flora, including eukarya and viral pathogens, and of bacterial virulence factors. Urine samples positive by metagenome sequencing contained a plethora of bacterial (median 41 genera/sample), eukarya (median 2 species/sample) and viral sequences (median 3 viruses/sample). Genomic analyses suggested cases of infection with potential pathogens that are often missed during routine urine culture due to species specific growth requirements. While conventional microbiological methods are inadequate to identify a large diversity of microbial species that are present in urine, genomic approaches appear to more comprehensively and quantitatively describe the urinary microbiome.


Conflict of interest statement

The authors declare no competing interests.

Figures

Figure 1
Figure 1
Definition of clinical and laboratory groups. The study used an unbiased approach to the classification of specimens using 20 parameters from the laboratory analysis of urine. (A) Explained variance from PCA; the first two PCs were retained for downstream clustering analyses. (B) Contributing factors (loadings) to the first two PCs. Note that the directionality of the loadings reflect enrichment independently of sign and direction. (C) Clustering of samples is based on the method of partitioning around medoids (pam).
Figure 2
Figure 2
Normalized abundance of bacterial genera across the clinical groups using 16S rDNA. 116 samples were successfully analysed by 16S rDNA sequencing and grouped according to the clinical laboratory clusters. Proteobacteria were the predominant phylum in Cluster 2 - the cluster that represents infection, with prominent identification of Citrobacter, Enterobacter, Escherichia. Clusters 1 and 3 were more diverse in composition (Fig. S1).
Figure 3
Figure 3
Metagenome sequencing mapped reads per sample. 49 samples were successfully sequenced and grouped according to the clinical laboratory clusters. Each point represents a sample. The thick line in the boxplot represents the median number of reads for the cluster.
Figure 4
Figure 4
Ranking of bacterial genera by counts from metagenome sequencing across clinical laboratory clusters. Shown are bacteria observed with at least 1% of total reads in a sample. Analyses reflect results from 49 samples that were successfully sequenced and grouped according to the clinical laboratory clusters. Each point represents a genus in a sample. The horizontal represents the median number of reads for the genus.
Figure 5
Figure 5
Virulence factors across clinical laboratory clusters. Metagenome sequencing data was used to search for open reading frames (ORFs) compared against the database VFDB to identify virulence factor genes with over 95% sequence identity. Listed are the factors identified in the dataset, grouped by taxonomic binning, with the VFDB accession number in parenthesis. The left panel shows enrichment in the abundance of ORFs across clusters. Here, the abundance is the depth of coverage of the genome where the ORFs were predicted. The right panel shows prevalence of samples that contain organisms carrying the corresponding virulence factor in each cluster.
Figure 6
Figure 6
Eukarya read counts across clinical laboratory clusters. Shown are eukarya observed with at least 10 sequence reads in a sample. Analyses reflect results from 49 samples that were successfully sequenced and grouped according to the clinical laboratory clusters. Each point represents a species in a sample.
Figure 7
Figure 7
Viral read counts across clinical laboratory clusters. Shown are viruses observed with at least one sequence read in a sample. Analyses reflect results from 49 samples that were successfully sequenced and grouped according to the clinical laboratory clusters. Each point represents a virus in a sample.

References

    1. Flores-Mireles AL, Walker JN, Caparon M, Hultgren SJ. Urinary tract infections: epidemiology, mechanisms of infection and treatment options. Nat Rev Microbiol. 2015;13:269–284. doi: 10.1038/nrmicro3432. - DOI - PMC - PubMed
    1. Schmiemann G, Kniehl E, Gebhardt K, Matejczyk MM, Hummers-Pradier E. The diagnosis of urinary tract infection: a systematic review. Dtsch Arztebl Int. 2010;107:361–367. - PMC - PubMed
    1. Foxman B. The epidemiology of urinary tract infection. Nat Rev Urol. 2010;7:653–660. doi: 10.1038/nrurol.2010.190. - DOI - PubMed
    1. Lewis DA, et al. The human urinary microbiome; bacterial DNA in voided urine of asymptomatic adults. Front Cell Infect Microbiol. 2013;3:41. doi: 10.3389/fcimb.2013.00041. - DOI - PMC - PubMed
    1. Yu Y, et al. Diagnosing inflammation and infection in the urinary system via proteomics. J Transl Med. 2015;13:111. doi: 10.1186/s12967-015-0475-3. - DOI - PMC - PubMed

MeSH terms