

Visualization method for stress-field evolution during rapid crack propagation using 3D printing and photoelastic testing techniques
- PMID: 29531306
- PMCID: PMC5847554
- DOI: 10.1038/s41598-018-22773-0
Visualization method for stress-field evolution during rapid crack propagation using 3D printing and photoelastic testing techniques
Abstract
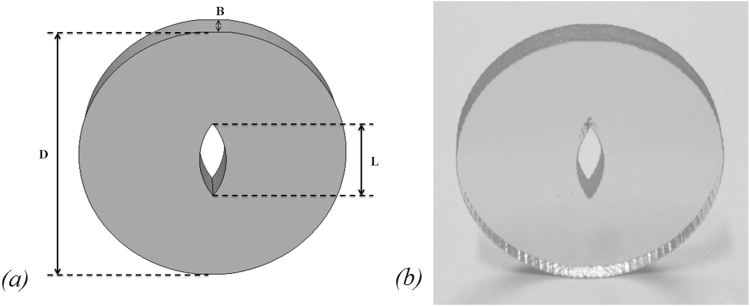
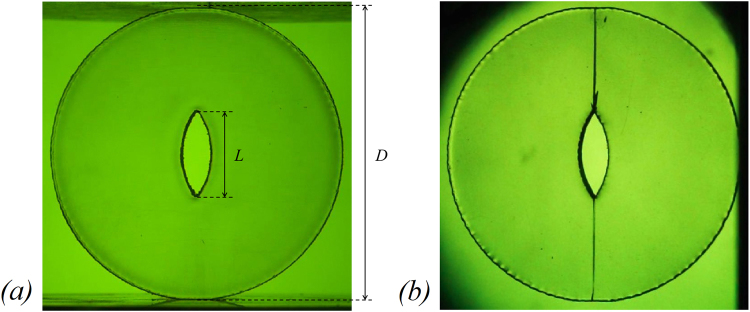
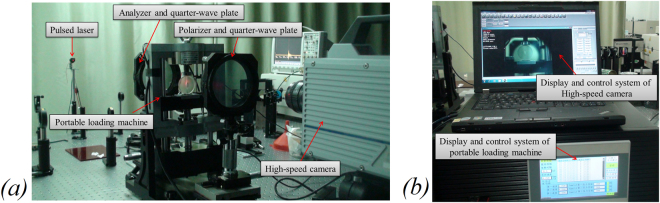
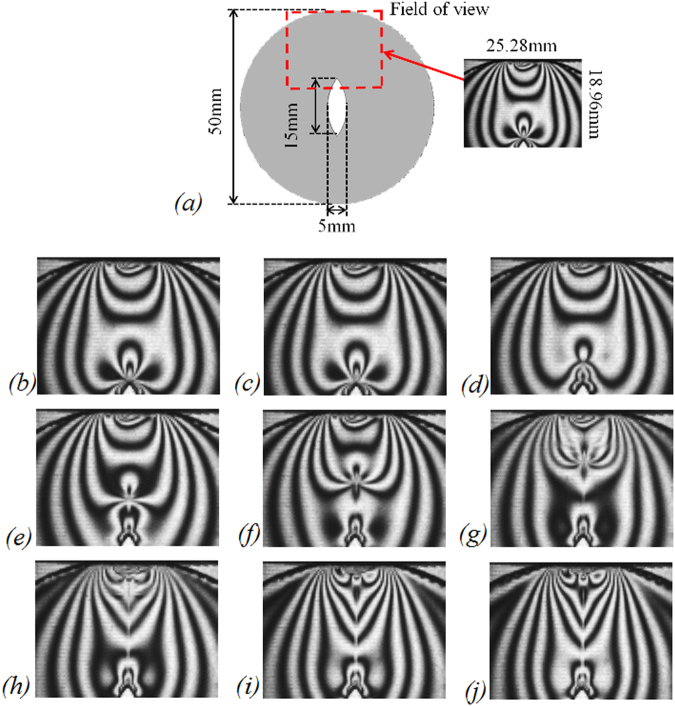
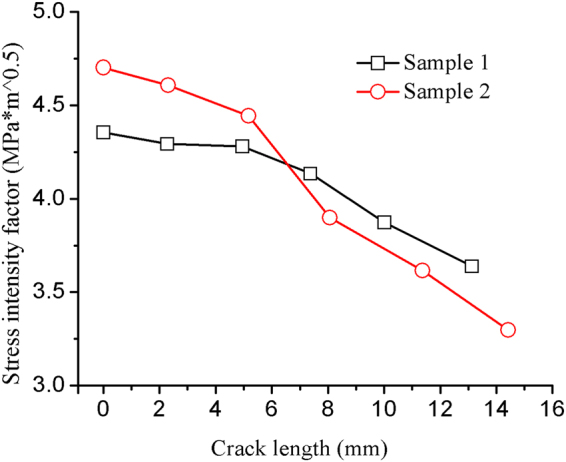
Quantitative visualization and characterization of stress-field evolution during fracture rapid growth is critical for understanding the mechanisms that govern the deformation and failure of solids in various engineering applications. However, the direct capture and accurate characterization of a rapidly-changing stress field during crack propagation remains a challenge. We report an experimental method to quantitatively visualize and characterize rapid evolution of the stress-field during crack propagation in a transparent disc model containing a penetrating fusiform crack. Three-dimensional (3D) printing technology and a stress-sensitive photopolymer resin were adopted to produce the disc model and to alleviate the residual processing stress that usually blurs the dynamic stress field due to overlap. A photoelastic testing system that synchronized a high-speed digital camera and a pulsed laser with a nanosecond full width at half maximum (FWHM) was used to capture the rapid evolution of the stress field in the vicinity of crack tips. The results show that the proposed method is suitable to directly visualize and quantitatively characterize the stress-field evolution during crack rapid propagation. It is proved that the crack propagation velocity is strongly governed by the stress field around the crack tips.
Conflict of interest statement
The authors declare no competing interests.
Figures


Similar articles
-
Experimental and Numerical Study on the Failure Characteristics of Brittle Solids with a Circular Hole and Internal Cracks.Materials (Basel). 2022 Feb 14;15(4):1406. doi: 10.3390/ma15041406. Materials (Basel). 2022. PMID: 35207947 Free PMC article.
-
Crack Propagation Velocity Determination by High-speed Camera Image Sequence Processing.Materials (Basel). 2020 Oct 3;13(19):4415. doi: 10.3390/ma13194415. Materials (Basel). 2020. PMID: 33022995 Free PMC article.
-
A phase field model coupling lithium diffusion and stress evolution with crack propagation and application in lithium ion batteries.Phys Chem Chem Phys. 2015 Jan 7;17(1):287-97. doi: 10.1039/c4cp00563e. Phys Chem Chem Phys. 2015. PMID: 24968175
-
Detection of Crack Locations in Aluminum Alloy Structures Using FBG Sensors.Sensors (Basel). 2020 Jan 8;20(2):347. doi: 10.3390/s20020347. Sensors (Basel). 2020. PMID: 31936254 Free PMC article.
-
Experimental Study of Prefabricated Crack Propagation in Coal Briquettes under the Action of a CO2 Gas Explosion.ACS Omega. 2021 Sep 14;6(38):24462-24472. doi: 10.1021/acsomega.1c02850. eCollection 2021 Sep 28. ACS Omega. 2021. PMID: 34604628 Free PMC article.
Cited by
-
An ultrafast time-resolution method based on picosecond pulsed laser for determining rock fracture toughness at multipoint during the crack propagation.Sci Rep. 2022 Mar 16;12(1):4550. doi: 10.1038/s41598-022-08428-1. Sci Rep. 2022. PMID: 35296715 Free PMC article.
-
In situ health monitoring of multiscale structures and its instantaneous verification using mechanoluminescence and dual machine learning.iScience. 2022 Dec 7;26(1):105758. doi: 10.1016/j.isci.2022.105758. eCollection 2023 Jan 20. iScience. 2022. PMID: 36590175 Free PMC article.
References
-
- Bieniawski ZT. Fracture dynamics of rock. Int. J. Fract. Mech. 1968;4:415–430. doi: 10.1007/BF00186807. - DOI
-
- Xia K, Rosakis AJ, Kanamori H. Laboratory earthquakes along inhomogeneous faults: directionality and supershear. Science. 2005;308:681–684. - PubMed
-
- Kotousov A, Lazzarin P, Berto F, Pook LP. Three-dimensional stress states at crack tip induced by shear and anti-plane loading. Eng. Fract. Mech. 2013;108:65–74. doi: 10.1016/j.engfracmech.2013.04.010. - DOI
-
- Sheppard SD. Field Effects in Fatigue crack initiation: long life fatigue strength. J. Mech. Design. 1991;113:188–194. doi: 10.1115/1.2912768. - DOI
LinkOut - more resources
Full Text Sources
Other Literature Sources
