. 2018 Apr;118(7):1020-1027.
doi: 10.1038/s41416-018-0009-x. Epub 2018 Mar 13.

Influence of obesity-related risk factors in the aetiology of glioma

Affiliations

Influence of obesity-related risk factors in the aetiology of glioma

Linden Disney-Hogg et al. Br J Cancer. 2018 Apr.

Abstract

Background: Obesity and related factors have been implicated as possible aetiological factors for the development of glioma in epidemiological observation studies. We used genetic markers in a Mendelian randomisation framework to examine whether obesity-related traits influence glioma risk. This methodology reduces bias from confounding and is not affected by reverse causation.

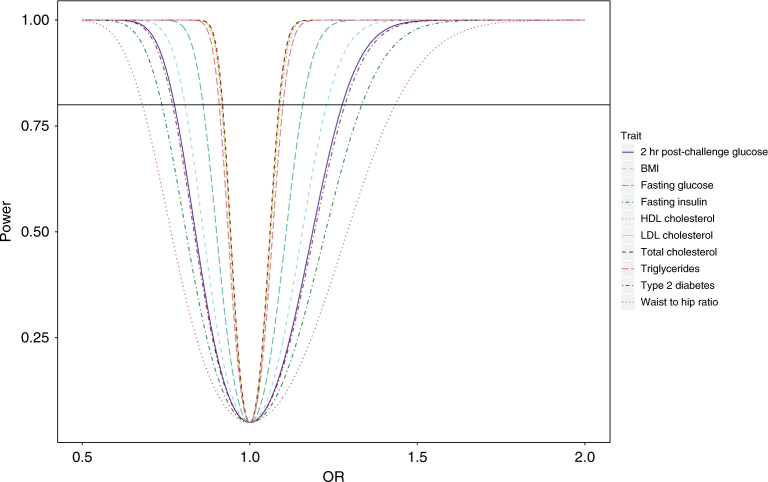
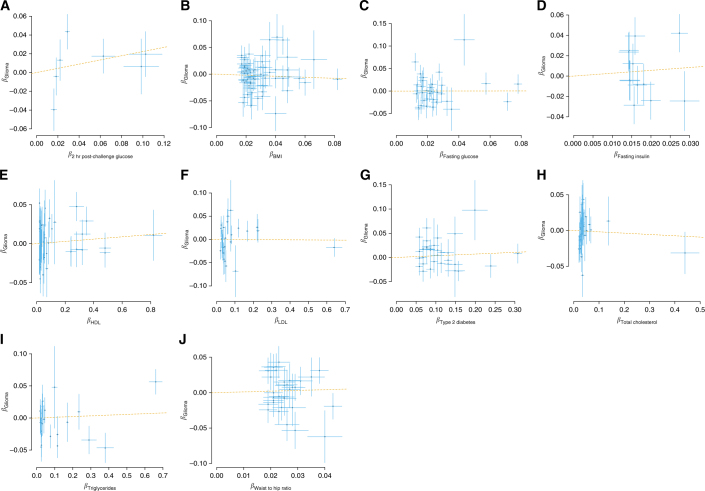
Methods: Genetic instruments were identified for 10 key obesity-related risk factors, and their association with glioma risk was evaluated using data from a genome-wide association study of 12,488 glioma patients and 18,169 controls. The estimated odds ratio of glioma associated with each of the genetically defined obesity-related traits was used to infer evidence for a causal relationship.

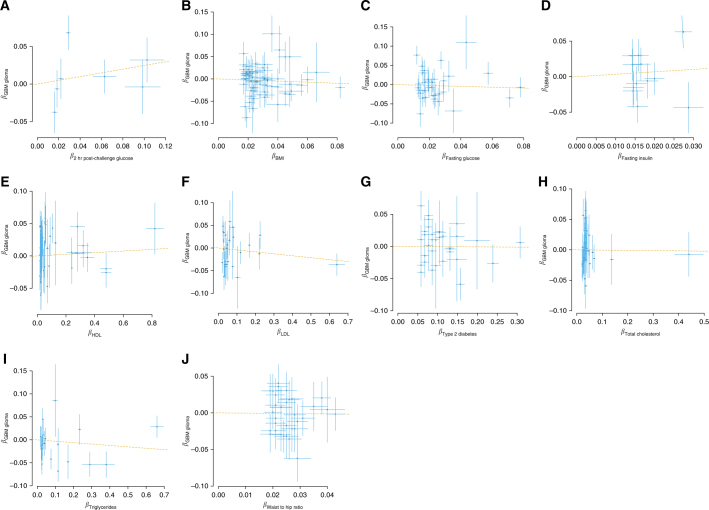
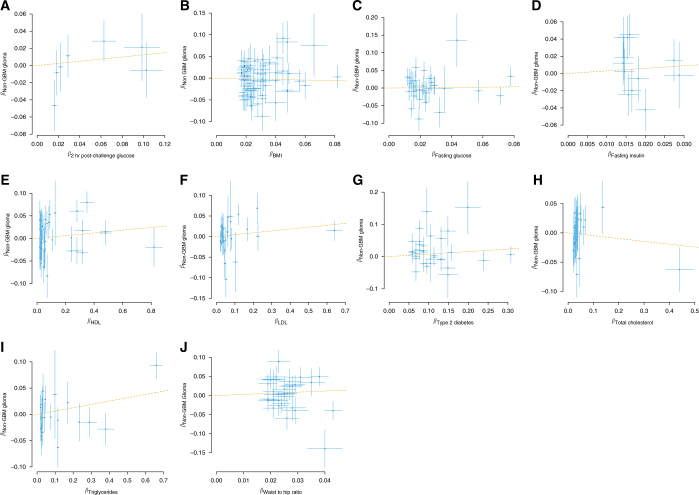
Results: No convincing association with glioma risk was seen for genetic instruments for body mass index, waist-to-hip ratio, lipids, type-2 diabetes, hyperglycaemia or insulin resistance. Similarly, we found no evidence to support a relationship between obesity-related traits with subtypes of glioma-glioblastoma (GBM) or non-GBM tumours.

Conclusions: This study provides no evidence to implicate obesity-related factors as causes of glioma.


Conflict of interest statement

The authors declare no competing financial interests.

Figures

Fig. 1
Fig. 1
Study power against OR for each obesity-related trait and all glioma (P = 0.05, two-sided). A line indicating a power of 80% is shown. BMI body mass index, HDL high-density lipoprotein, LDL low-density lipoprotein, OR odds ratio
Fig. 2
Fig. 2
SNP-specific effects for risk of all glioma. For each figure, the effect size of the respective measure for: a 2-h post-challenge glucose, b BMI, c fasting glucose, d fasting insulin, e HDL cholesterol, f LDL cholesterol, g type-2 diabetes, h total cholesterol, i triglycerides and j WHR is plotted against the effect for all glioma. Error bars represent one SD. The GSMR estimate is plotted as a dashed line for reference. BMI body mass index, GSMR generalised summary data-based Mendelian randomisation, HDL high-density lipoprotein, LDL low-density lipoprotein, SD standard deviation, WHR waist–hip ratio
Fig. 3
Fig. 3
SNP-specific effects for risk of GBM glioma. For each figure, the effect size of the respective measure for a 2-h post-challenge glucose, b BMI, c fasting glucose, d fasting insulin, e HDL cholesterol, f LDL cholesterol, g type-2 diabetes, h total cholesterol, i triglycerides and j WHR is plotted against the effect for GBM glioma. Error bars represent one SD. The GSMR estimate is plotted as a dashed line for reference. BMI body mass index, GBM glioblastoma mulitforme, GSMR generalised summary data-based Mendelian randomisation, HDL high-density lipoprotein, LDL low-density lipoprotein, SD standard deviation, WHR waist–hip ratio
Fig. 4
Fig. 4
SNP-specific effects for risk of non-GBM glioma. For each figure, the effect size of the respective measure for a 2-h post-challenge glucose, b BMI, c fasting glucose, d fasting insulin, e HDL cholesterol, f LDL cholesterol, g type-2 diabetes, h total cholesterol, i triglycerides and j WHR, is plotted against the effect for non-GBM glioma. Error bars represent one SD. The GSMR estimate is plotted as a dashed line for reference. BMI body mass index, GBM glioblastoma mulitforme, GSMR generalised summary data-based Mendelian randomisation, HDL high-density lipoprotein, LDL low-density lipoprotein, SD standard deviation, WHR waist–hip ratio

References

    1. Ostrom QT, et al. CBTRUS statistical report: primary brain and central nervous system tumors diagnosed in the United States in 2006–2010. NeuroOncology. 2013;15:ii1–56. - PMC - PubMed
    1. Ostrom QT, et al. The epidemiology of glioma in adults: a “state of the science” review. NeuroOncology. 2014;16:896–913. - PMC - PubMed
    1. Kyrgiou M, et al. Adiposity and cancer at major anatomical sites: umbrella review of the literature. BMJ. 2017;356:j477. doi: 10.1136/bmj.j477. - DOI - PMC - PubMed
    1. Kaplan S, Novikov I, Modan B. Nutritional factors in the etiology of brain tumors: potential role of nitrosamines, fat, and cholesterol. Am. J. Epidemiol. 1997;146:832–841. doi: 10.1093/oxfordjournals.aje.a009201. - DOI - PubMed
    1. Niedermaier T, et al. Body mass index, physical activity, and risk of adult meningioma and glioma: a meta-analysis. Neurology. 2015;85:1342–1350. doi: 10.1212/WNL.0000000000002020. - DOI - PubMed

Publication types

MeSH terms