. 2018 Apr;21(4):607-616.
doi: 10.1038/s41593-018-0095-3. Epub 2018 Mar 12.

Learning by neural reassociation

Affiliations

Learning by neural reassociation

Matthew D Golub et al. Nat Neurosci. 2018 Apr.

Erratum in

Abstract

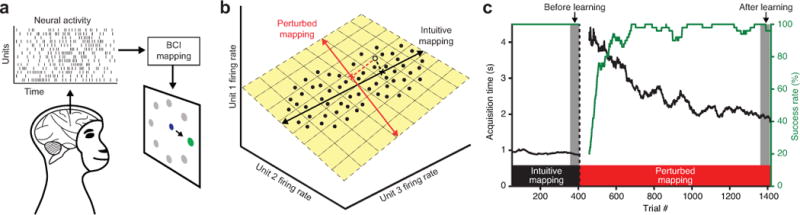
Behavior is driven by coordinated activity across a population of neurons. Learning requires the brain to change the neural population activity produced to achieve a given behavioral goal. How does population activity reorganize during learning? We studied intracortical population activity in the primary motor cortex of rhesus macaques during short-term learning in a brain-computer interface (BCI) task. In a BCI, the mapping between neural activity and behavior is exactly known, enabling us to rigorously define hypotheses about neural reorganization during learning. We found that changes in population activity followed a suboptimal neural strategy of reassociation: animals relied on a fixed repertoire of activity patterns and associated those patterns with different movements after learning. These results indicate that the activity patterns that a neural population can generate are even more constrained than previously thought and might explain why it is often difficult to quickly learn to a high level of proficiency.


Conflict of interest statement

COMPETING FINANCIAL INTERESTS

The authors declare no competing financial interests.

Figures

Figure 1
Figure 1
BCI learning experiment. (a) Schematic of the BCI system. The animal generates population activity patterns to drive a cursor to hit visual targets under visual feedback. (b) Population activity patterns (black dots) tend to lie in a low-dimensional subspace, termed the intrinsic manifold (yellow plane). A given activity pattern (open dot) maps to a cursor velocity (cross) according to a BCI mapping. Both the intuitive BCI mapping (black line) and the perturbed BCI mapping (red line) were designed to lie within the intrinsic manifold. (c) Behavioral performance during an example experiment (J20120525), as measured by acquisition time and success rate. Cursor velocities were initially determined by an intuitive BCI mapping (black window), and then to induce learning, the mapping was changed to a perturbed BCI mapping (red window). Left and right gray windows indicate trials analyzed “before learning” and “after learning,” respectively. Traces for acquisition time and success rate were smoothed using a causal 50-trial moving window and are not shown for the first 49 trials under each mapping.
Figure 2
Figure 2
Conceptual illustrations of three hypothesized neural strategies of learning. (a) In our experiments, the BCI mapped 10-D population activity patterns to 2-D cursor velocities. Here we illustrate using 2-D activity patterns and 1-D velocities. At the beginning of each experiment, cursor velocities are determined by the intuitive BCI mapping (solid black line). Patterns to the left of the dashed line move the cursor left (L), and patterns to the right move the cursor right (R). The animal demonstrates proficient control by generating green patterns when intending to move left and purple patterns when intending to move right. High-speed movements result from patterns near the outer dotted lines. (b) Before learning, the animal’s intuitive control strategy will result in larger errors through the perturbed mapping (solid red line) than through the intuitive mapping (now gray). Errors result from purple patterns above and green patterns below the dashed line. Dotted lines represent movement speeds matching those indicated by the dotted lines in a. (c) Hypothesis 1: Realignment. Each movement-specific cloud of activity shifts to maximize behavioral performance. (d) Hypothesis 2: Rescaling. This perturbation decreases the magnitude of the behavioral output due to activity along dimension 1. To restore the influence that dimension-1 activity had on movement prior to the perturbation, variability along dimension 1 scales up. Similarly, this perturbation increases the influence of dimension-2 activity, and variability along dimension 2 scales down to compensate. (e) Hypothesis 3: Reassociation. The overall neural repertoire is unchanged relative to before learning (points are positioned as in b), but activity patterns are associated with different movement intents to improve behavioral performance (purple points above dotted line in b are now green; green points below dotted line in b are now purple). Realignment (c) and Rescaling (d) predict change to the overall neural repertoire, whereas Reassociation (e) does not.
Figure 3
Figure 3
Visualization of population activity patterns from an example experiment (N20160728). (center) Population activity patterns recorded before learning (black; from the last 50 trials under the intuitive BCI mapping) and after learning (red; from the 50 trials of peak performance under the perturbed BCI mapping), visualized as their 2-D output through the perturbed BCI mapping. Each point represents the cursor velocity (vx, vy) that an activity pattern (zt from equation (1)) contributes to cursor movement according to the perturbed mapping. Note that, although both black and red points represent recorded neural activity patterns, because the intuitive BCI mapping was in place during the before learning trials, black points represent predictions about behavior under the perturbed BCI mapping before any learning has taken place. By contrast, red points represent actual closed-loop behavior after learning. Black and red outlines encapsulate 98% of before- and after-learning patterns, respectively, and represent the overall neural repertoire. (outside) After-learning activity patterns from center plotted separately for each intended movement direction. Each of these movement-specific clouds is composed of the activity patterns recorded when the cursor-to-target direction fell within 22.5° of the labeled arrow. In this velocity space, an increase in the number of points along the cursor-to-target direction implies behavioral improvement. For example, for movements to 45°, before-learning activity patterns produced near-zero velocity, on average, but after-learning patterns produced velocities in a direction close to 45°. Outlines are reproduced from center. Gray (before learning) and red (after learning) filled regions encapsulate the patterns from each movement-specific cloud that were contained within the outlines from center. Additional details are provided in Online Methods.
Figure 4
Figure 4
Consistent with Reassociation, the overall neural repertoire shows minimal changes during short-term learning. (a) We measured repertoire change by assessing the distances between each after-learning population activity pattern (e.g., colored points) and its nearest neighbors (indicated by colored lines) amongst the before-learning activity patterns (black points). (b) Repertoire change measured in the data and predicted by Realignment, Rescaling, and Reassociation. Distances were normalized by the spread of the before-learning activity patterns such that positive values imply a repertoire shift or expansion, and negative values imply a repertoire contraction. Values near zero are consistent with repertoire preservation. Reassociation-predicted domain change was not significantly different from that measured in the data (p = 0.55, two-sided paired Wilcoxon signed-rank test, n = 384: 48 experiments across animals × 8 movement conditions). Realignment- and Rescaling-predicted repertoire changes were significantly different from that measured in the data (p < 10−10). On each box, the central line indicates the median, the bottom and top edges indicate the 25th and 75th percentiles of the data, respectively, and the whiskers extend to the 5th to the 95th percentiles of the data (n = 384).
Figure 5
Figure 5
Consistent with Reassociation, population covariability does not change along key dimensions of the intrinsic manifold. (a) Covariability of population activity along the dimensions spanned by the intuitive BCI mapping did not change significantly during learning (p = 0.19, two-sided paired Wilcoxon signed-rank test, n = 48 experiments across animals). Each data point represents one experiment. Diagonal line indicates unity. (b) Covariability along the dimensions spanned by the perturbed BCI mapping did not change significantly during learning (p = 0.069, two-sided paired Wilcoxon signed-rank test, n = 48). (c) Predicted changes in covariability due to learning. Inset highlights the region wherein lie the observed data (defined by the data points in a and b) and the predictions of Reassociation. Rescaling and Realignment predict significantly more change in covariability along the intuitive mapping (Rescaling) and along the perturbed mapping (Realignment) than was observed in the data (p < 10−8, two-sided paired Wilcoxon signed-rank test, n = 48). Reassociation-predicted change in covariability along the intuitive mapping was not significantly different than that observed in the data (p = 0.087). Along the perturbed mapping, Reassociation-predicted covariability change was significantly different from that in the data (p = 0.006), but this effect size was small relative to that for Realignment and Rescaling. Crosses indicate ±1 S.E.M. (monkey J: n = 27 experiments; monkey L: n = 11 experiments; monkey N: n = 10 experiments).
Figure 6
Figure 6
Consistent with Reassociation, population covariability does not track perturbations to the BCI mapping. (a) The intuitive mapping from an example experiment (N20160728). Each 2-D column of the B matrix from equation (1) is a pushing vector (represented by a line) describing the change in cursor position due to activity along one dimension of the population (i.e., the velocity contribution due to one factor). The direction of a pushing vector represents the direction that the corresponding activity pushes the cursor, and the length represents the strength of that push, termed the pushing magnitude. Dimensions are ordered by the amount of shared variance explained during calibration (see Online Methods). (b) The perturbed BCI mapping from the same experiment as in a. The BCI mappings (and thus the pushing vectors in ab) were chosen by the experimenter and are not a reflection of how the animal’s neural activity changed during learning. (c) Pushing magnitudes from the intuitive mapping (lengths of lines in a). (d) Pushing magnitudes from the perturbed mapping (lengths of lines in b). (e) Change in pushing magnitude (perturbed minus intuitive) for each dimension. (f) Changes in population covariability along each dimension of the intrinsic manifold as a function of each dimension’s change in pushing magnitude due to the perturbation. Each point represents changes for one dimension of the population activity. (g) Relationships between changes in population covariance and changes in pushing magnitude. Slopes (corresponding to trend lines in f) were computed independently for each experiment using linear regression. Triangles indicate slopes for the experiment in f. Tick marks above each plot indicate means across experiments. Reassociation-predicted slopes were not significantly different from those in the data (p = 0.76, two-sided paired Wilcoxon signed-rank test, n = 48 experiments across animals). Realignment- and Rescaling-predicted slopes were significantly different from those in the data (p < 10−8).
Figure 7
Figure 7
Behavioral learning is consistent with Reassociation. Acquisition time is the time elapsed between movement onset and target acquisition. “Before learning” data are from the last 50 trials under the intuitive BCI mapping (see Fig. 1c). “Before learning, Intuitive mapping” assesses the empirical closed-loop behavior during these trials. “Before learning, Perturbed mapping” predicts the behavioral performance that would result under the perturbed BCI mapping if the animal did not learn (i.e., if under the perturbed BCI mapping the animal generates the same movement-specific clouds that it had generated under the intuitive BCI mapping). “After learning, Perturbed mapping” assesses the empirical closed-loop behavior under the perturbed BCI mapping after the animal had learned. The empirical behavioral learning effect is represented by the improvement from “Before learning, Perturbed mapping” to “After learning, Perturbed mapping.” “Realignment,” “Rescaling,” and “Reassociation” assess predicted after-learning activity patterns through the perturbed BCI mapping. Reassociation-predicted acquisition times were not significantly different from the data (“After learning, Perturbed mapping” vs. “Reassociation”; p = 0.46, two-sided paired Wilcoxon signed-rank test, n = 48 experiments across animals). Realignment-predicted and Rescaling-predicted acquisition times were significantly different from the data (p = 1.6 × 10⁻⁹ and p = 0.011, respectively). On each box, the central line indicates the median, the bottom and top edges indicate the 25th and 75th percentiles of the data, respectively, and the whiskers extend to the 5th to the 95th percentiles of the data (monkey J: n = 27 experiments; monkey L: n = 11 experiments; monkey N: n = 10 experiments).
Figure 8
Figure 8
Partial Realignment and Subselection are not consistent with the data. (a) Conceptual illustration of Partial Realignment, in which the movement-specific clouds of activity transition partially from their before-learning locations to their Complete-Realignment locations in population activity space. (b) Conceptual illustration of Subselection, in which the activity patterns used to generate a particular movement after learning are a subset of the same patterns that had been used for that movement under the intuitive BCI mapping, and are still appropriate for the same movement under the perturbed BCI mapping (filled points). Patterns that do not satisfy this criterion are no longer produced (open points). Format matches that of Figure 2 (gray line: intuitive BCI mapping; solid red line: perturbed BCI mapping; dotted red lines: set of activity patterns that map to high-speed movements through the perturbed BCI mapping, matched to dotted lines in Fig. 2). (c) Percentage of movement-specific clouds showing repertoire change. Here repertoire change was assessed for each after-learning movement-specific cloud relative to the before-learning movement-specific cloud for the same movement. Repertoire change in the data was significantly different from that predicted by Partial Realignment and that predicted by Subselection (p < 10−10, paired two-sided sign test, n = 384: 48 experiments across animals × 8 movement conditions). Vertical lines indicate 95% confidence intervals (Bernoulli process, n = 384).

Comment in

  • Set in one's thoughts.
    Galgali AR, Mante V. Galgali AR, et al. Nat Neurosci. 2018 Apr;21(4):459-460. doi: 10.1038/s41593-018-0105-5. Nat Neurosci. 2018. PMID: 29531363 No abstract available.

References

    1. Mitz AR, Godschalk M, Wise SP. Learning-dependent neuronal activity in the premotor cortex: activity during the acquisition of conditional motor associations. The Journal of neuroscience. 1991;11(6):1855–1872. - PMC - PubMed
    1. Asaad WF, Rainer G, Miller EK. Neural activity in the primate prefrontal cortex during associative learning. Neuron. 1998;21(6):1399–1407. - PubMed
    1. Li CSR, Padoa-Schioppa C, Bizzi E. Neuronal correlates of motor performance and motor learning in the primary motor cortex of monkeys adapting to an external force field. Neuron. 2001;30(2):593–607. - PubMed
    1. Paz R, Boraud T, Natan C, Bergman H, Vaadia E. Preparatory activity in motor cortex reflects learning of local visuomotor skills. Nature neuroscience. 2003;6(8):882–890. - PubMed
    1. Rokni U, Richardson AG, Bizzi E, Seung HS. Motor learning with unstable neural representations. Neuron. 2007;54(4):653–666. - PubMed

Publication types