

Adaptation to fluctuations in temperature by nine species of bacteria
- PMID: 29531704
- PMCID: PMC5838078
- DOI: 10.1002/ece3.3823
Adaptation to fluctuations in temperature by nine species of bacteria
Abstract
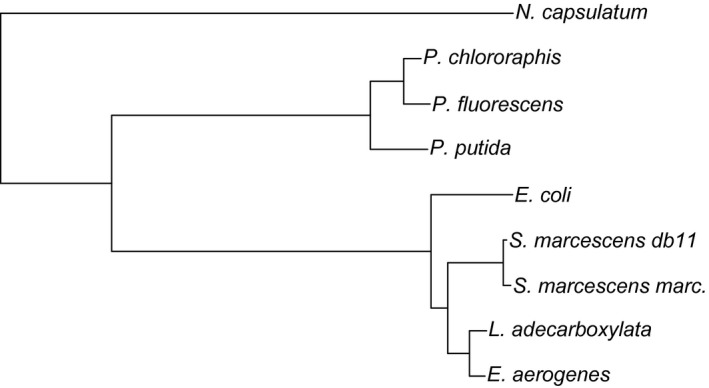
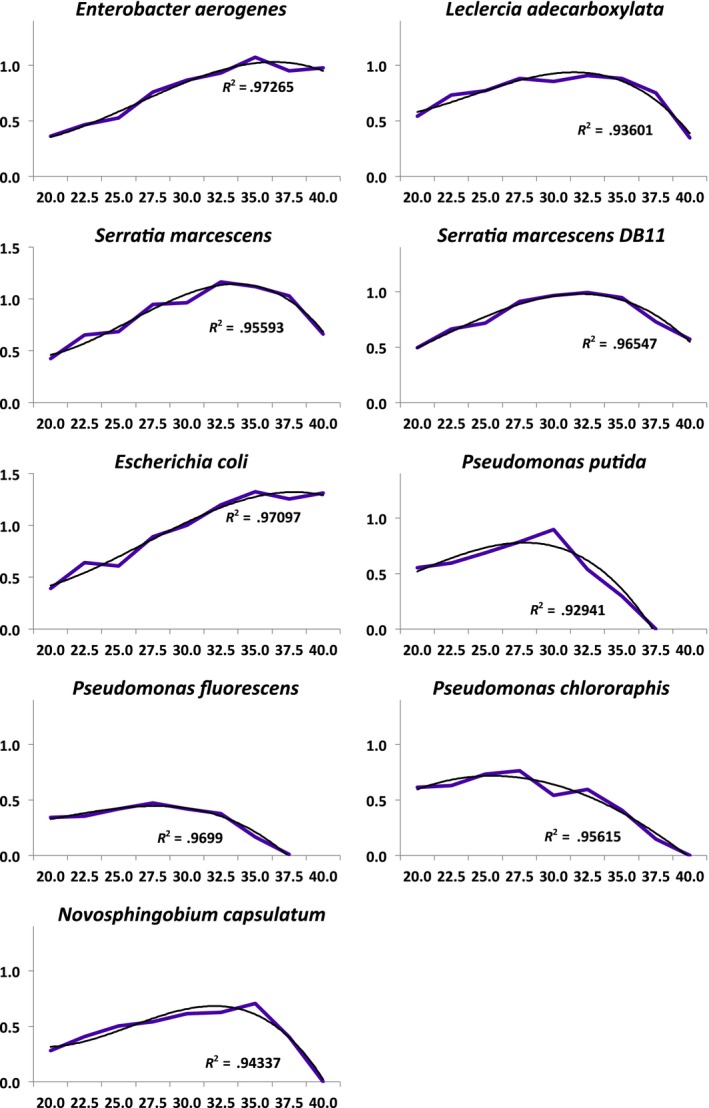
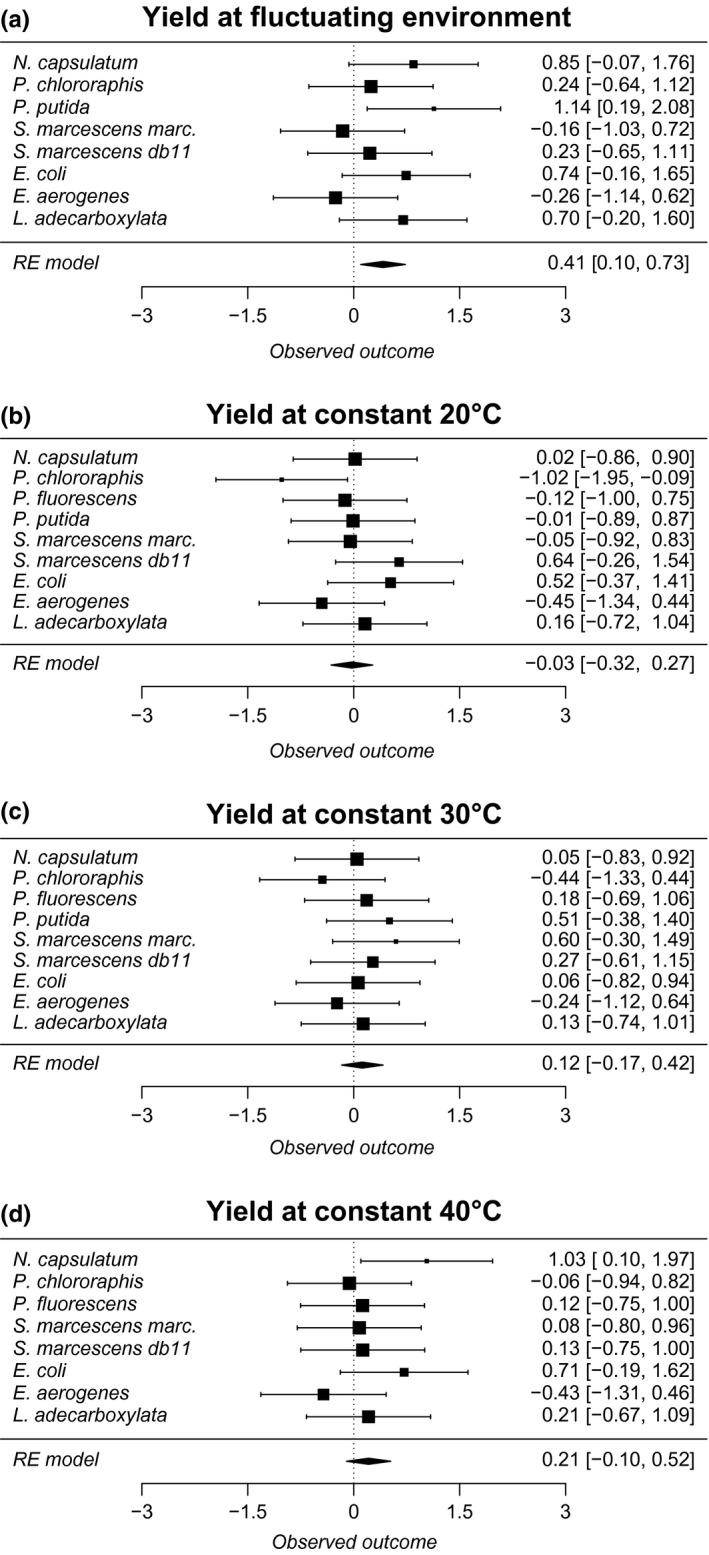
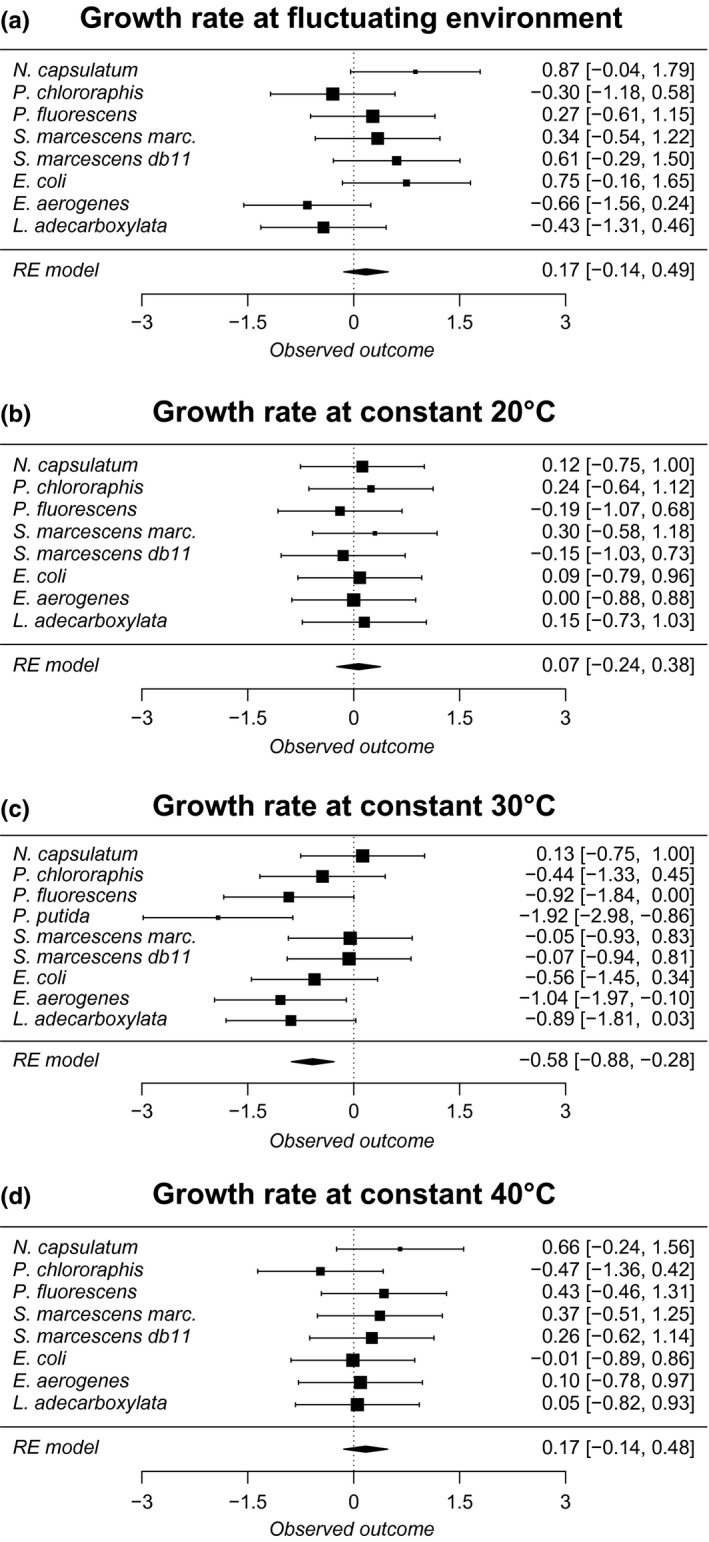
Rapid environmental fluctuations are ubiquitous in the wild, yet majority of experimental studies mostly consider effects of slow fluctuations on organism. To test the evolutionary consequences of fast fluctuations, we conducted nine independent experimental evolution experiments with bacteria. Experimental conditions were same for all species, and we allowed them to evolve either in fluctuating temperature alternating rapidly between 20°C and 40°C or at constant 30°C temperature. After experimental evolution, we tested the performance of the clones in both rapid fluctuation and in constant environments (20°C, 30°C and 40°C). Results from experiments on these nine species were combined meta-analytically. We found that overall the clones evolved in the fluctuating environment had evolved better efficiency in tolerating fluctuations (i.e., they had higher yield in fluctuating conditions) than the clones evolved in the constant environment. However, we did not find any evidence that fluctuation-adapted clones would have evolved better tolerance to any measured constant environments (20°C, 30°C, and 40°C). Our results back up recent empirical findings reporting that it is hard to predict adaptations to fast fluctuations using tolerance curves.
Keywords: experimental evolution; reaction norm; temperature fluctuation; tolerance curve.
Figures
References
-
- Araújo, M. B. , Ferri‐Yanez, F. , Bozinovic, F. , Marquet, P. A. , Valladares, F. , & Chown, S. L. (2013). Heat freezes niche evolution. Ecology Letters, 16, 1206–1219. https://doi.org/10.1111/ele.12155 - DOI - PubMed
-
- Arnoldini, M. , Mostowy, R. , Bonhoeffer, S. , & Ackermann, M. (2012). Evolution of stress response in the face of unreliable environmental signals. PLoS Computational Biology, 8, e1002627 https://doi.org/10.1371/journal.pcbi.1002627 - DOI - PMC - PubMed
-
- Bennett, A. F. , & Hughes, B. S. (2009). Microbial experimental evolution. American Journal of Physiology: Regulatory, Integrative and Comparative Physiology, 297, R17–R25. - PubMed
-
- Bennett, A. F. , & Lenski, R. (1993). Evolutionary adaptation to temperature. II. Thermal niches of experimental lines of Escherichia coli . Evolution, 47, 1–12. https://doi.org/10.1111/j.1558-5646.1993.tb01194.x - DOI - PubMed
-
- Bennett, A. F. , Lenski, R. E. , & Mittler, J. E. (1992). Evolutionary adaptation to temperature. I. Fitness responses of Escherichia coli to changes in its thermal environment. Evolution, 46, 16–30. https://doi.org/10.1111/j.1558-5646.1992.tb01981.x - DOI - PubMed
LinkOut - more resources
Full Text Sources
Other Literature Sources
