. 2018 Feb 1:4:6.
doi: 10.1038/s41420-017-0010-9. eCollection 2018 Dec.

Glucose-6-phosphate dehydrogenase is critical for suppression of cardiac hypertrophy by H2S

Affiliations

Glucose-6-phosphate dehydrogenase is critical for suppression of cardiac hypertrophy by H2S

Aastha Chhabra et al. Cell Death Discov. .

Abstract

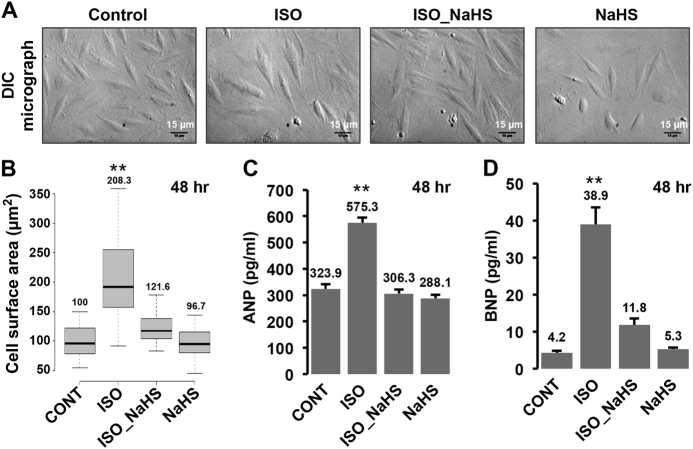
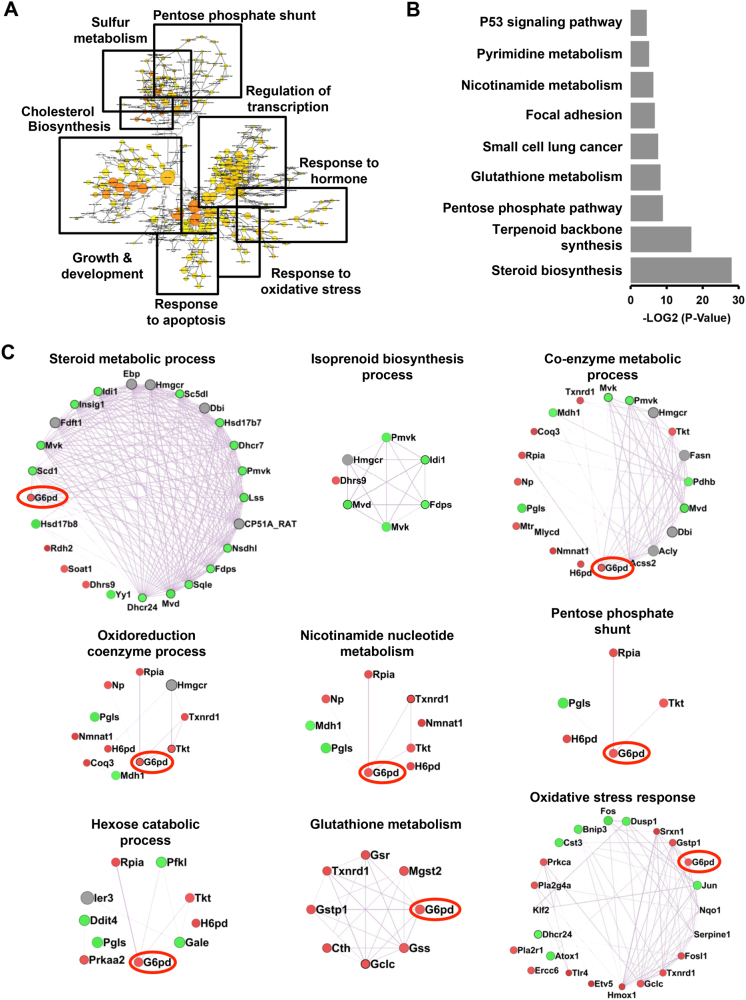
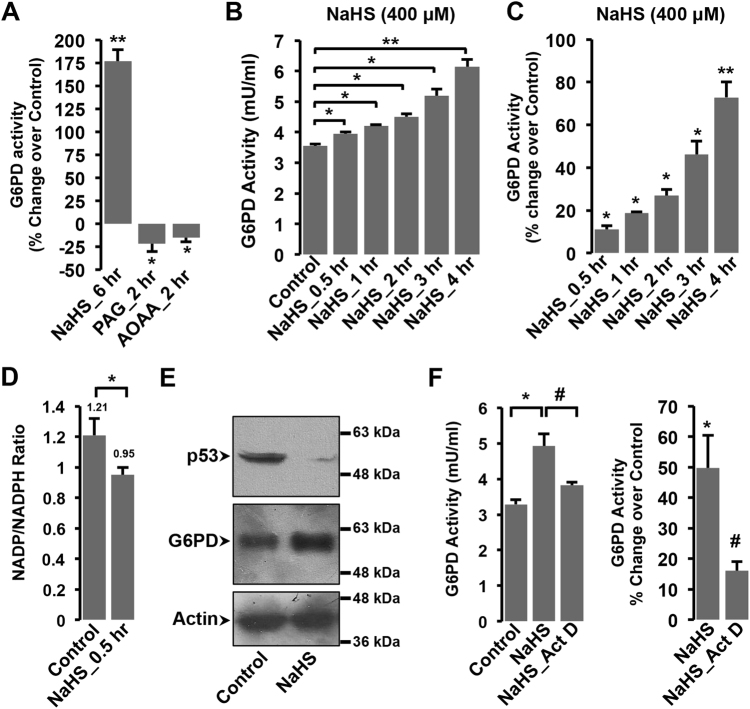
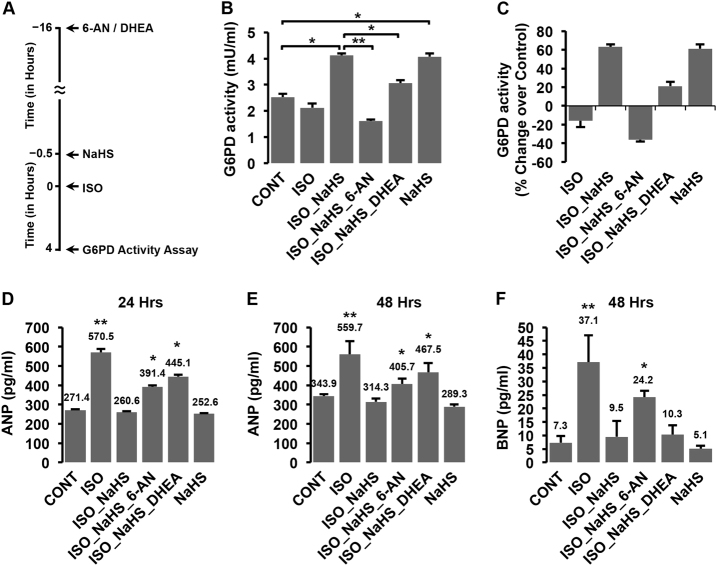
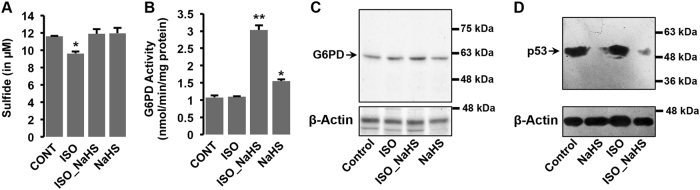
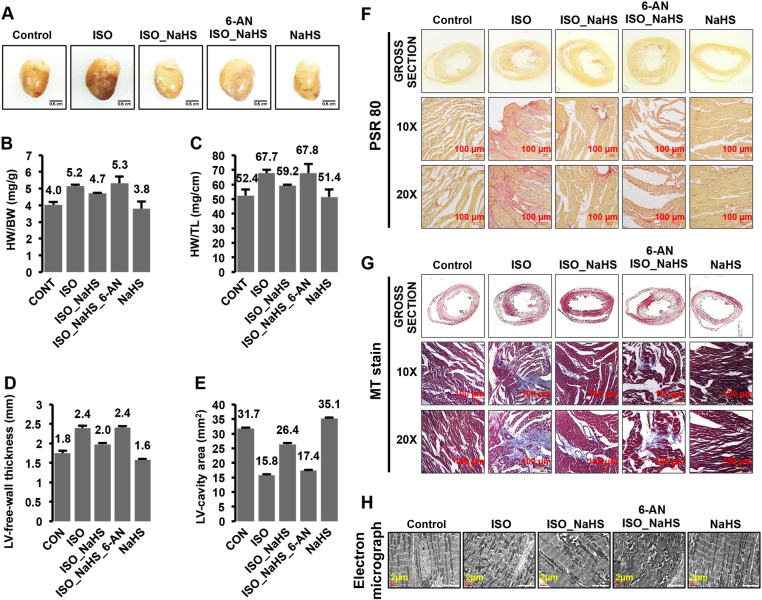
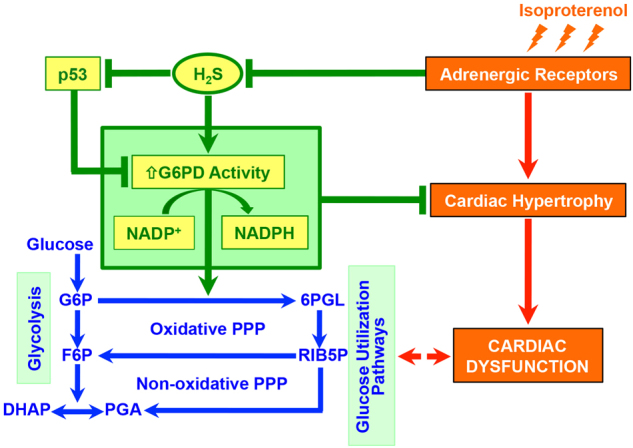
Hydrogen Sulfide (H2S), recently identified as the third endogenously produced gaseous messenger, is a promising therapeutic prospect for multiple cardio-pathological states, including myocardial hypertrophy. The molecular niche of H2S in normal or diseased cardiac cells is, however, sparsely understood. Here, we show that β-adrenergic receptor (β-AR) overstimulation, known to produce hypertrophic effects in cardiomyocytes, rapidly decreased endogenous H2S levels. The preservation of intracellular H2S levels under these conditions strongly suppressed hypertrophic responses to adrenergic overstimulation, thus suggesting its intrinsic role in this process. Interestingly, unbiased global transcriptome sequencing analysis revealed an integrated metabolic circuitry, centrally linked by NADPH homeostasis, as the direct target of intracellular H2S augmentation. Within these gene networks, glucose-6-phosphate dehydrogenase (G6PD), the first and rate-limiting enzyme (producing NADPH) in pentose phosphate pathway, emerged as the critical node regulating cellular effects of H2S. Utilizing both cellular and animal model systems, we show that H2S-induced elevated G6PD activity is critical for the suppression of cardiac hypertrophy in response to adrenergic overstimulation. We also describe experimental evidences suggesting multiple processes/pathways involved in regulation of G6PD activity, sustained over extended duration of time, in response to endogenous H2S augmentation. Our data, thus, revealed H2S as a critical endogenous regulator of cardiac metabolic circuitry, and also mechanistic basis for its anti-hypertrophic effects.


Conflict of interest statement

The authors declare that they have no competing interests.

Figures

Fig. 1
Fig. 1. β-adrenergic stimulation downregulates endogenous H2S levels
ad The cells were stained with H2S-specific dye, SF7-AM (2.5 µM) and relative levels of endogenous H2S estimated in cardiac cells, with or without β-AR stimulation (employing ISO/NE), in the presence or absence of NaHS pre-treatment (400 µM, 30 min). The representative fluorescence micrographs (10X magnification, λex/em: 495/520 nm) for specific groups (n = 3) are shown in panels a and c. Magnified regions (inset) and scale bar is also shown for images in all groups. Panels b and d depict box-whisker plots representing corrected total cell fluorescence, CTCF, for indicated groups. The relative change in mean CTCF (represented as % of control) is also indicated in parenthesis. e–h The cells were treated with NaHS (400 µM) or H2O2 (50 µM) for indicated duration of time and specific assays were performed. e Mitochondrial superoxide measurement utilizing Mitosox red (mitochondrial superoxide-specific probe) staining and flow cytometry (BD Accuri C6) f Mitochondrial membrane potential (ΔΨm) assessment utilizing JC-1 dye and flow cytometry (BD Accuri C6). FL-1 (green) vs. FL-2 (red) dot plots were generated for the indicated groups. Cells with normal ΔΨm are detected as those with higher FL-2 signal (FL-1bright, FL-2bright cells)—indicative of higher levels of JC-1 aggregates (detected in FL-2, 570 nm). The loss of mitochondrial membrane potential results in increased levels of FL-1bright, FL-2dim cells—indicative of higher JC-1 monomer (detected in FL-1, 530 nm). g Apoptosis assay: the cells were subjected to Annexin V-FITC/Propidium Iodide (PI) double staining and data acquired using flow cytometry (BD FACS Calibur). FITC/PI cells indicate normal cells while FITC+/PI, FITC+/PI+ and PI+ suggest the presence of cells in specific stages of apoptosis (early, late, or necrotic). The percentage of cells in individual quadrant is also indicated in the figure. h DNA content analysis: the cells were stained with propidium iodide and DNA content analysis (cell cycle) done employing flow cytometry (BD FACS Calibur). Histogram plot for specific groups is as shown. The relative fractions of cells in specific stages of cell cycle (G1, S or G2) are also indicated. H2O2 treated group also showed distinctive sub-G1 population, indicating the presence of apoptotic cells.
Fig. 2
Fig. 2. Augmentation of endogenous H2S suppresses β-adrenergic stimulation-induced hypertrophy in cardiomyocytes
a DIC micrographs. H9c2 cells were treated with ISO for 48 h, with or without NaHS pre-treatment for 30 min and imaged utilizing DIC microscope (20X magnification). Scale bar is included in all images. b Box-whisker-plot showing cell surface area (in µm2) for specific groups, calculated using Image J, NIH. c, d The cells were challenged with ISO for 48 h, in the presence or absence of NaHS pre-treatment and culture supernatant collected for estimating secreted levels (in pg/ml) of ANP c and BNP d, utilizing sandwich ELISA. Mean ± S.E. was plotted to obtain the bar graphs shown in the figure. **p < 0.01
Fig. 3
Fig. 3. Genome-wide expression analysis suggests modulation of metabolic processes during H2S augmentation
RNA sequencing analysis was performed on H9c2 cells, treated with NaHS for 6 h. The list of differentially expressed genes was subjected to analysis employing various softwares including BiNGO and GeneMANIA (as Cytoscape plugins) and DAVID (Online resource). The gene ontology (GO) networks were then represented as ‘‘Perfused forced directed clusters’’ and biological networks as ‘‘Degree sorted circular view.’’ a Clustered, over-represented GO and functional terms, utilizing hyper geometric test, in BiNGO (Cytoscape plug-in). The GO term clusters are indicated using closed boxes with gross specific annotation (indicated). b Bar graph representing −log2 (p-value) of significantly enriched KEGG pathways, as obtained from DAVID analysis. c Networks of co-expressed genes (representing significantly enriched biological processes) extracted utilizing GeneMANIA and shown as ‘‘Degree sorted circular view’’
Fig. 4
Fig. 4. Functional evidences for regulation of G6PD by intracellular H2S levels
a Bar graph representing G6PD activity (as percentage change over control) in cells treated with NaHS (400 μM, 6 h), PAG (1 mM, 2 h), and AOAA (2 mM, 2 h). b, c Bar graphs representing time-dependent changes in G6PD activity (mU/ml) b and percentage change over control c, post 400 μM NaHS treatment for indicated duration of time. One unit of G6PD activity was defined as the amount of enzyme that catalyzed the conversion of 1.0 µmol of glucose-6-phosphate into 6-phosphoglucono-δ-lactone and converted 1.0 µmol of NAD+ to NADH per minute at 37 °C. d Bar graph representing NADP/NADPH ratio in H9c2 cells, 0.5 h post NaHS treatment. e Representative immunoblots for p53 or G6PD expression in whole-cell extracts from cells treated with or without NaHS. β-actin was used as loading control. f G6PD activity (represented in mU/ml or percentage change over control) for cells treated with NaHS (400 μM, 4 h), in the presence or absence of actinomycin D (5 µg/ml, 2 h prior to NaHS treatment). Mean ± S.E. was plotted to obtain bar graph shown in the figure. *p < 0.05, **p < 0.01. #Compared to NaHS groups
Fig. 5
Fig. 5. H2S-induced increase in G6PD activity is critical for regulating hypertrophic responses
a Schematic representation for experimental set in panel b and c. H9c2 cells (with or without 30 min NaHS pre-treatment) were stimulated with ISO (50 µM), in the presence or absence of inhibitors; 6-AN (250 µM, 16 h) or DHEA (25 µM, 16 h). b, c Bar graphs (Mean ± S.E.) representing G6PD activity in mU/ml b or percentage change over control c from various groups (as indicated in figure). df Bar graph (Mean ± S.E.) depicting ANP or BNP levels (in pg/ml), as estimated from culture supernatants after 24 d or 48 h e, f of ISO treatment, with or without NaHS, in the presence or absence of G6PD inhibitors, 6-AN or DHEA. *p < 0.05, **p < 0.01 compared to control groups
Fig. 6
Fig. 6. H2S augmentation modulates G6PD activity and expression in rat heart tissues
Sham- or NaHS-treated animals were challenged with isoproterenol (5 mg/kg, s.c, 4 h) and specific assays performed. a Bar graph showing total sulfide concentration in heart tissues isolated from the indicated groups. b Bar graphs representing G6PD activity (in nanomoles (nmol) of NADPH (reduced form) produced per minute per mg of total protein) c, d Representative immunoblot for G6PD expression c and p53 expresssion d in heart tissues from indicated groups. β-Actin was used as the internal loading control. Mean ± S.E. values were used to plot the bar graph. *p < 0.05, **p < 0.01 compared to control groups
Fig. 7
Fig. 7. Critical role of H2S-induced increase in G6PD activity for suppression of β-AR-mediated cardiac hypertrophy in rat model
The animals (NaHS- or Sham-treated), with or without 6-AN, were challenged with isoproterenol for 6 days and specific parameters studied. a Gross heart images, from indicated groups, representing the specific morphological changes. b, c Bar graphs (Mean ± S.E.) depicting heart weight (HW):body weight (BW), in mg/g, and heart weight (HW):tail length (TL), in mg/cm, in the indicated groups. d, e Bar graphs (Mean ± S.E.) representing left ventricular-free wall thickness (in mm) and left ventricular cavity area (in mm2), as estimated from sections of heart isolated from indicated groups. f, g Bright-field micrographs of Picro-Sirius Red (PSR 80, panel f) staining (Red—Collagen, Yellow—Muscle fibers/Cytoplasm), and Masson Trichrome (MT, panel g staining (Blue—Collagen, Red—Muscle fibers/Cytoplasm). h Transmission electron micrographs (Scale bar: 2 µm) of sections from left ventricular-free wall of the indicated groups
Fig. 8
Fig. 8. Diagrammatic representation of the phenomenon deciphered from the work, conceptually integrated to known framework of cardiac hypertrophy and basic glucose metabolic pathway
β-adrenergic receptor (β-AR) stimulation—known to culminate in cardiac hypertrophy—rapidly lowers endogenous levels of H2S in cardiomyocytes. H2S is intrinsically linked (directly) to G6PD activity (and production of NADPH), via multiple processes, and this phenomenon is causally involved in suppression of cardiac hypertrophy (by H2S) in both cellular and animal model systems. Progression of cardiac hypertrophy and ensuing dysfunction is, per se, known to be associated with modulation of glucose utilization pathway. G6PD: glucose-6-phosphate dehydrogenase, G6P: glucose-6-phosphate, 6PGL: 6-phospho-gluconolactone, F6P: fructose-6-phosphate, RIB5P: ribulose-5-phosphate, DHAP: dihydroxy acetone-phosphate, PGA: glyceraldehyde-3-phosphate

Similar articles

Cited by

References

    1. Schiattarella GG, Hill JA. Inhibition of hypertrophy is a good therapeutic strategy in ventricular pressure overload. Circulation. 2015;131:1435–1447. doi: 10.1161/CIRCULATIONAHA.115.013894. - DOI - PMC - PubMed
    1. Frey N, Katus HA, Olson EN, Hill JA. Hypertrophy of the heart: a new therapeutic target? Circulation. 2004;109:1580–1589. doi: 10.1161/01.CIR.0000120390.68287.BB. - DOI - PubMed
    1. Levy D, Garrison RJ, Savage DD, Kannel WB, Castelli WP. Prognostic implications of echocardiographically determined left ventricular mass in the Framingham Heart Study. N. Engl. J. Med. 1990;322:1561–1566. doi: 10.1056/NEJM199005313222203. - DOI - PubMed
    1. Kabil O, Banerjee R. Enzymology of H2S biogenesis, decay and signaling. Antioxid. Redox Signal. 2014;20:770–782. doi: 10.1089/ars.2013.5339. - DOI - PMC - PubMed
    1. Kondo K, et al. H(2)S protects against pressure overload-induced heart failure via upregulation of endothelial nitric oxide synthase. Circulation. 2013;127:1116–1127. doi: 10.1161/CIRCULATIONAHA.112.000855. - DOI - PMC - PubMed