

Human immunodeficiency virus Tat impairs mitochondrial fission in neurons
- PMID: 29531805
- PMCID: PMC5841280
- DOI: 10.1038/s41420-017-0013-6
Human immunodeficiency virus Tat impairs mitochondrial fission in neurons
Abstract
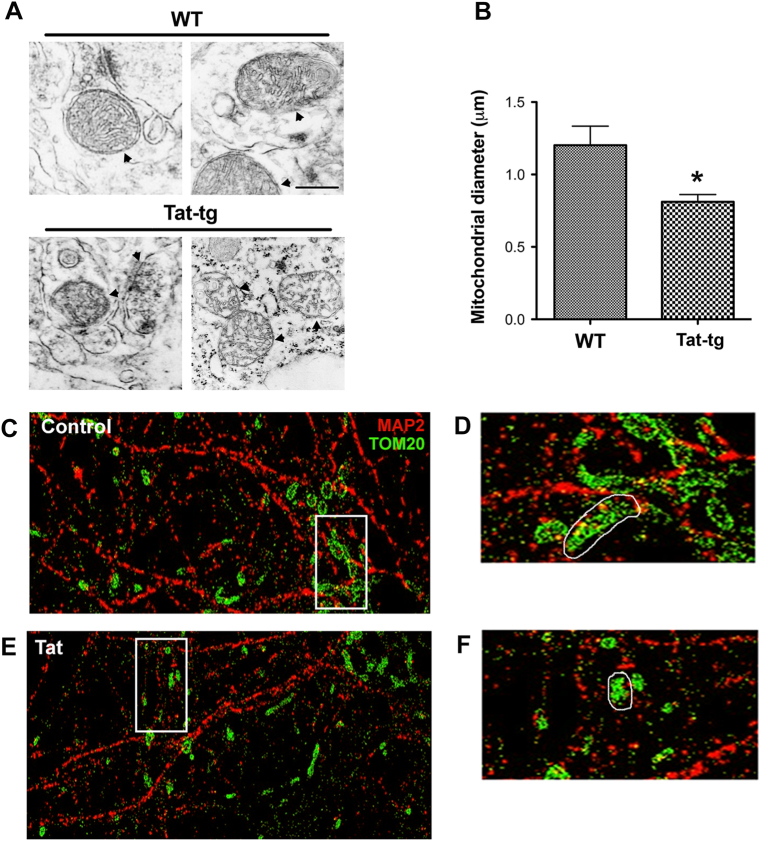
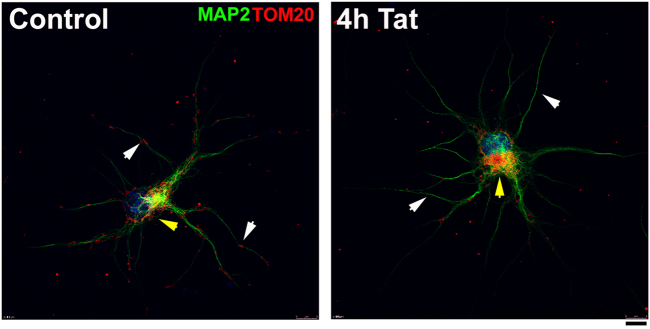
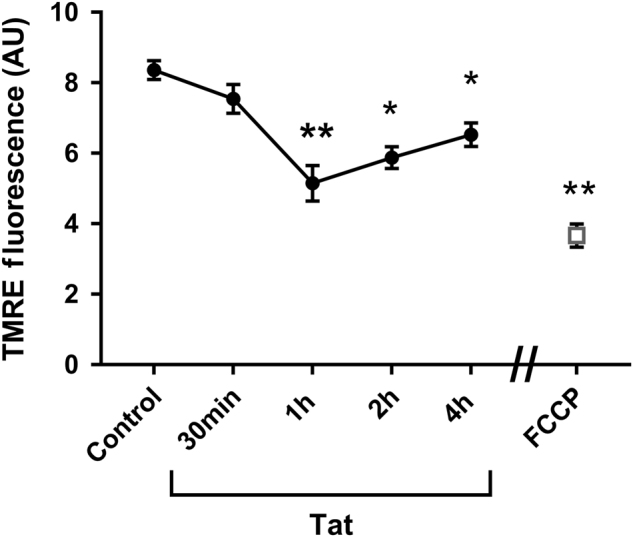
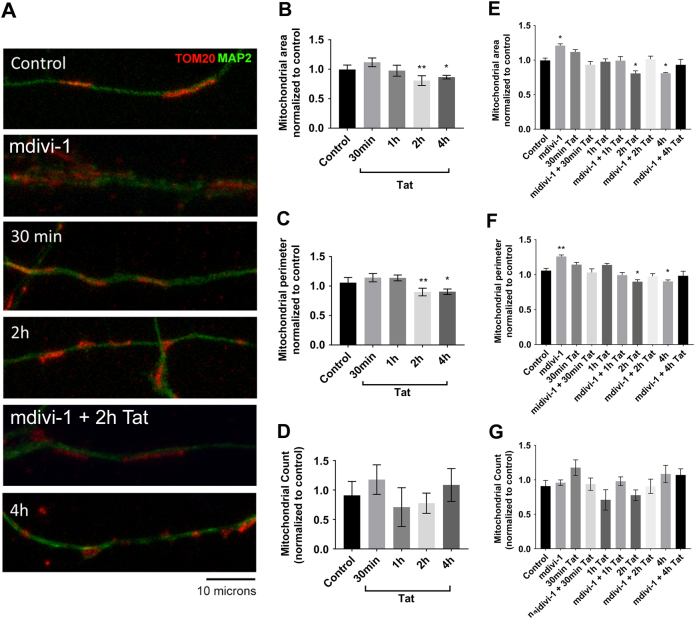
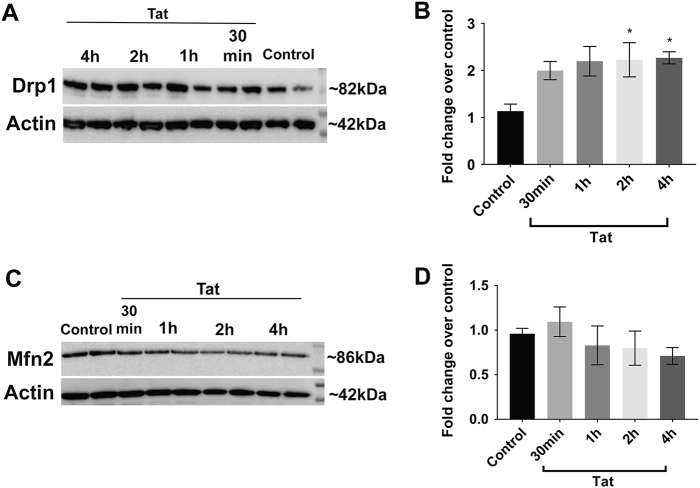
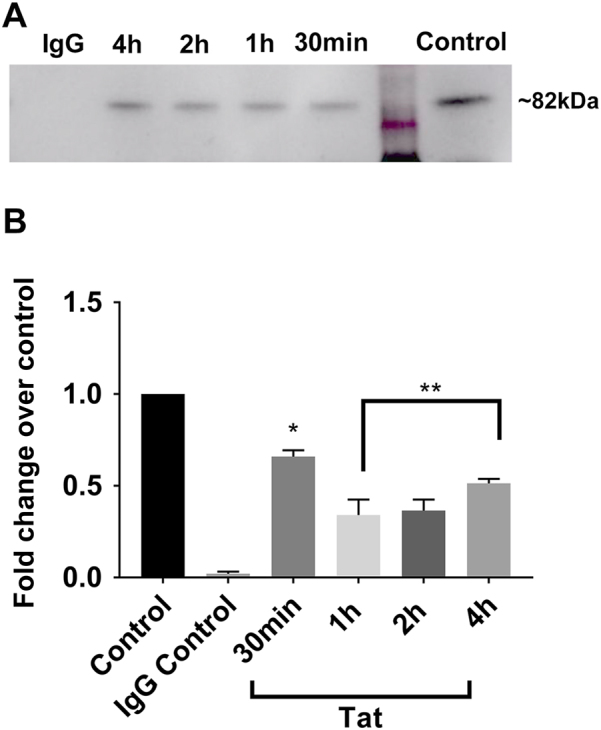
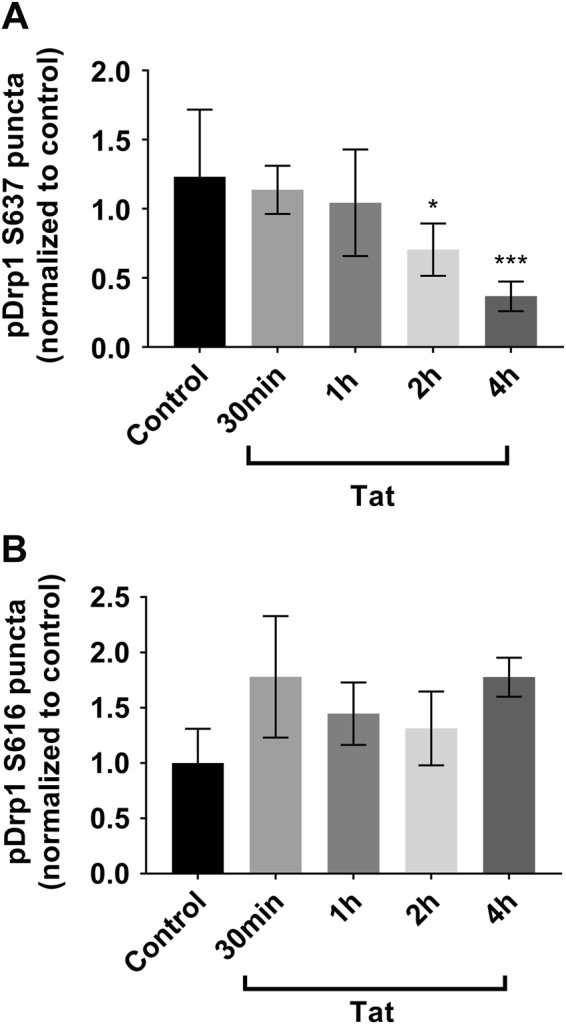
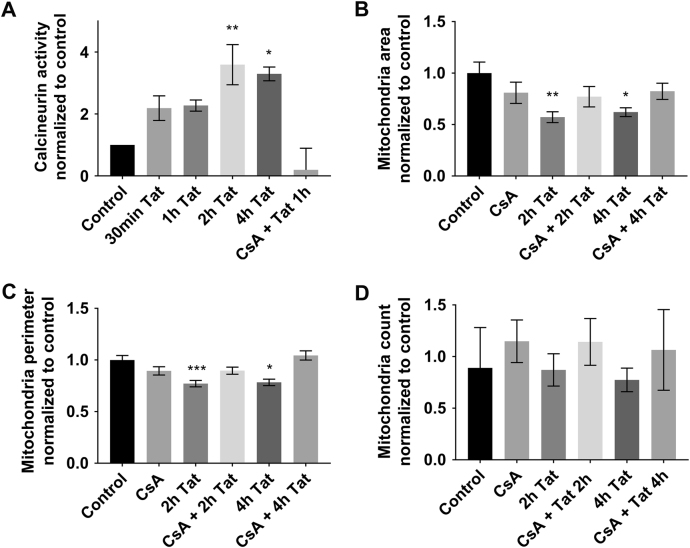
Human immunodeficiency virus-1 (HIV) infection of the central nervous system promotes neuronal injury that culminates in HIV-associated neurocognitive disorders. Viral proteins, including transactivator of transcription (Tat), have emerged as leading candidates to explain HIV-mediated neurotoxicity, though the mechanisms remain unclear. Tat transgenic mice or neurons exposed to Tat, which show neuronal loss, exhibit smaller mitochondria as compared to controls. To provide an experimental clue as to which mechanisms are used by Tat to promote changes in mitochondrial morphology, rat cortical neurons were exposed to Tat (100 nM) for various time points. Within 30 min, Tat caused a significant reduction in mitochondrial membrane potential, a process that is regulated by fusion and fission. To further assess whether Tat changes these processes, fission and fusion proteins dynamin-related protein 1 (Drp1) and mitofusin-2 (Mfn2), respectively, were measured. We found that Drp1 levels increased beginning at 2 h after Tat exposure while Mfn2 remained unchanged. Moreover, increased levels of an active form of Drp1 were found to be present following Tat exposure. Furthermore, Drp1 and calcineurin inhibitors prevented Tat-mediated effects on mitochondria size. These findings indicate that mitochondrial fission is likely the leading factor in Tat-mediated alterations to mitochondrial morphology. This disruption in mitochondria homeostasis may contribute to the instability of the organelle and ultimately neuronal cell death following Tat exposure.
Conflict of interest statement
The authors declare that they have no competing interests.
Figures
Similar articles
-
Human Immunodeficiency Virus Type 1 gp120 and Tat Induce Mitochondrial Fragmentation and Incomplete Mitophagy in Human Neurons.J Virol. 2018 Oct 29;92(22):e00993-18. doi: 10.1128/JVI.00993-18. Print 2018 Nov 15. J Virol. 2018. PMID: 30158296 Free PMC article.
-
PACAP27 is protective against tat-induced neurotoxicity.J Mol Neurosci. 2014 Nov;54(3):485-93. doi: 10.1007/s12031-014-0273-z. Epub 2014 Apr 4. J Mol Neurosci. 2014. PMID: 24696163 Free PMC article.
-
The role of mitochondrial alterations in the combined toxic effects of human immunodeficiency virus Tat protein and methamphetamine on calbindin positive-neurons.J Neurovirol. 2004 Dec;10(6):327-37. doi: 10.1080/13550280490520961. J Neurovirol. 2004. PMID: 15765804
-
The role of Drp1 adaptor proteins MiD49 and MiD51 in mitochondrial fission: implications for human disease.Clin Sci (Lond). 2016 Nov 1;130(21):1861-74. doi: 10.1042/CS20160030. Clin Sci (Lond). 2016. PMID: 27660309 Review.
-
Drp1 in ischemic neuronal death: an unusual suspect.Curr Med Chem. 2014;21(19):2183-9. doi: 10.2174/0929867321666131228203513. Curr Med Chem. 2014. PMID: 24372214 Review.
Cited by
-
7,8-Dihydroxyflavone improves neuropathological changes in the brain of Tg26 mice, a model for HIV-associated neurocognitive disorder.Sci Rep. 2021 Sep 16;11(1):18519. doi: 10.1038/s41598-021-97220-8. Sci Rep. 2021. PMID: 34531413 Free PMC article.
-
HIV-1 Tat Impairment of Mitochondrial Respiration via Complexes I and II Can Be Ameliorated by Allopregnanolone in Opioid-Exposed or Opioid-Naïve Cells and Mice.Antioxidants (Basel). 2025 Mar 31;14(4):420. doi: 10.3390/antiox14040420. Antioxidants (Basel). 2025. PMID: 40298704 Free PMC article.
-
Central nervous system (CNS) transcriptomic correlates of human immunodeficiency virus (HIV) brain RNA load in HIV-infected individuals.Sci Rep. 2021 Jun 9;11(1):12176. doi: 10.1038/s41598-021-88052-7. Sci Rep. 2021. PMID: 34108514 Free PMC article.
-
Inflammation-induced PINCH expression leads to actin depolymerization and mitochondrial mislocalization in neurons.Transl Neurodegener. 2020 Aug 3;9(1):32. doi: 10.1186/s40035-020-00211-4. Transl Neurodegener. 2020. PMID: 32746944 Free PMC article.
-
Endolysosome Iron Chelation Inhibits HIV-1 Protein-Induced Endolysosome De-Acidification-Induced Increases in Mitochondrial Fragmentation, Mitophagy, and Cell Death.Cells. 2022 May 31;11(11):1811. doi: 10.3390/cells11111811. Cells. 2022. PMID: 35681506 Free PMC article.
References
Grants and funding
LinkOut - more resources
Full Text Sources
Other Literature Sources
Molecular Biology Databases
Research Materials
Miscellaneous
