. 2018 Feb 28;4(2):268-276.
doi: 10.1021/acscentsci.7b00572. Epub 2018 Jan 12.

Automatic Chemical Design Using a Data-Driven Continuous Representation of Molecules

Affiliations

Automatic Chemical Design Using a Data-Driven Continuous Representation of Molecules

Rafael Gómez-Bombarelli et al. ACS Cent Sci. .

Abstract

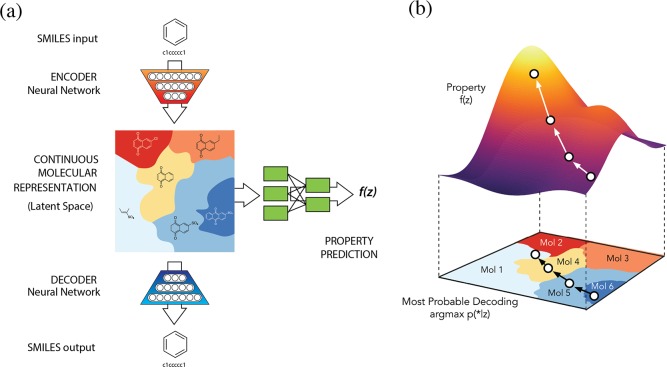
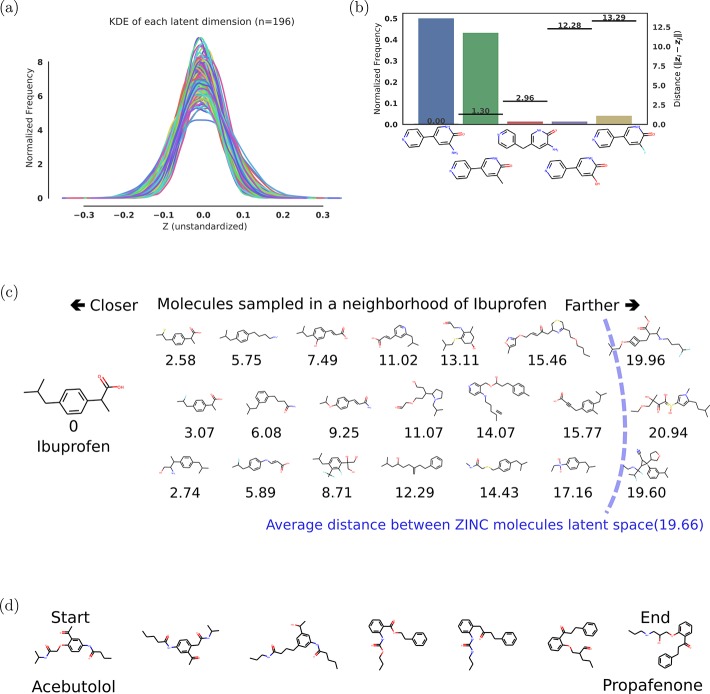
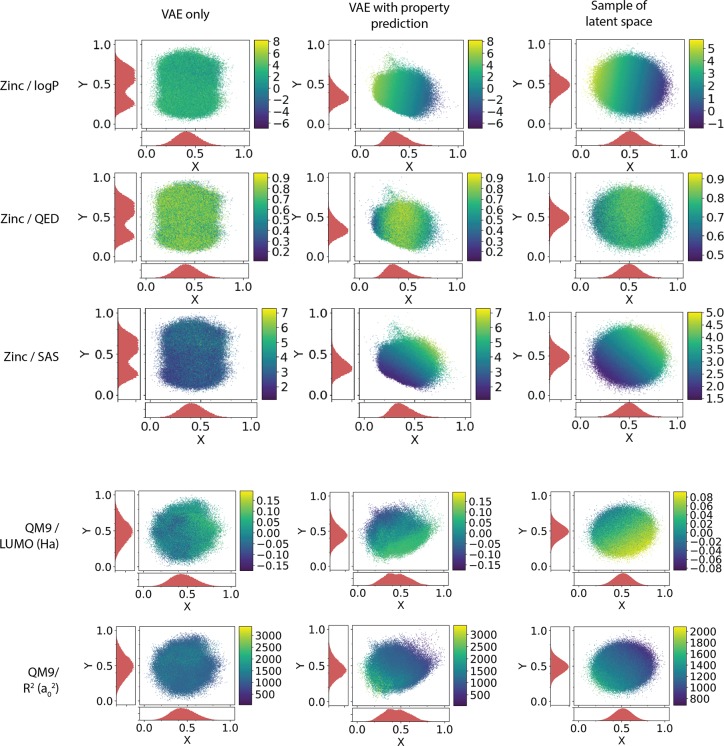
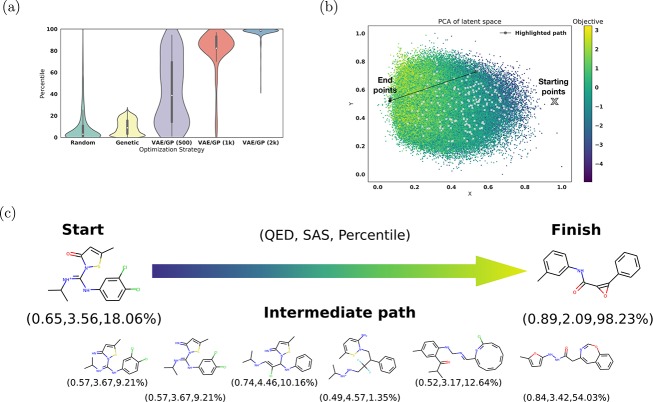
We report a method to convert discrete representations of molecules to and from a multidimensional continuous representation. This model allows us to generate new molecules for efficient exploration and optimization through open-ended spaces of chemical compounds. A deep neural network was trained on hundreds of thousands of existing chemical structures to construct three coupled functions: an encoder, a decoder, and a predictor. The encoder converts the discrete representation of a molecule into a real-valued continuous vector, and the decoder converts these continuous vectors back to discrete molecular representations. The predictor estimates chemical properties from the latent continuous vector representation of the molecule. Continuous representations of molecules allow us to automatically generate novel chemical structures by performing simple operations in the latent space, such as decoding random vectors, perturbing known chemical structures, or interpolating between molecules. Continuous representations also allow the use of powerful gradient-based optimization to efficiently guide the search for optimized functional compounds. We demonstrate our method in the domain of drug-like molecules and also in a set of molecules with fewer that nine heavy atoms.


Conflict of interest statement

The authors declare no competing financial interest.

Figures

Figure 1
Figure 1
(a) A diagram of the autoencoder used for molecular design, including the joint property prediction model. Starting from a discrete molecular representation, such as a SMILES string, the encoder network converts each molecule into a vector in the latent space, which is effectively a continuous molecular representation. Given a point in the latent space, the decoder network produces a corresponding SMILES string. A mutilayer perceptron network estimates the value of target properties associated with each molecule. (b) Gradient-based optimization in continuous latent space. After training a surrogate model f(z) to predict the properties of molecules based on their latent representation z, we can optimize f(z) with respect to z to find new latent representations expected to have high values of desired properties. These new latent representations can then be decoded into SMILES strings, at which point their properties can be tested empirically.
Figure 2
Figure 2
Representations of the sampling results from the variational autoencoder. (a) Kernel Density Estimation (KDE) of each latent dimension of the autoencoder, i.e., the distribution of encoded molecules along each dimension of our latent space representation; (b) histogram of sampled molecules for a single point in the latent space; the distances of the molecules from the original query are shown by the lines corresponding to the right axis; (c) molecules sampled near the location of ibuprofen in latent space. The values below the molecules are the distance in latent space from the decoded molecule to ibuprofen; (d) slerp interpolation between two molecules in latent space using six steps of equal distance.
Figure 3
Figure 3
Two-dimensional PCA analysis of latent space for variational autoencoder. The two axis are the principle components selected from the PCA analysis; the color bar shows the value of the selected property. The first column shows the representation of all molecules from the listed data set using autoencoders trained without joint property prediction. The second column shows the representation of molecules using an autoencoder trained with joint property prediction. The third column shows a representation of random points in the latent space of the autoencoder trained with joint property prediction; the property values predicted for these points are predicted using the property predictor network. The first three rows show the results of training on molecules from the ZINC data set for the logP, QED, and SAS properties; the last two rows show the results of training on the QM9 data set for the LUMO energy and the electronic spatial extent (R2).
Figure 4
Figure 4
Optimization results for the jointly trained autoencoder using 5 × QED – SAS as the objective function. (a) shows a violin plot which compares the distribution of sampled molecules from normal random sampling, SMILES optimization via a common chemical transformation with a genetic algorithm, and from optimization on the trained Gaussian process model with varying amounts of training points. To offset differences in computational cost between the random search and the optimization on the Gaussian process model, the results of 400 iterations of random search were compared against the results of 200 iterations of optimization. This graph shows the combined results of four sets of trials. (b) shows the starting and ending points of several optimization runs on a PCA plot of latent space colored by the objective function. Highlighted in black is the path illustrated in part (c). (c) shows a spherical interpolation between the actual start and finish molecules using a constant step size. The QED, SAS, and percentile score are reported for each molecule.

References

    1. Kim S.; Thiessen P. A.; Bolton E. E.; Chen J.; Fu G.; Gindulyte A.; Han L.; He J.; He S.; Shoemaker B. A.; Wang J.; Yu B.; Zhang J.; Bryant S. H. PubChem Substance and Compound databases. Nucleic Acids Res. 2016, 44, D1202–D1213. 10.1093/nar/gkv951. - DOI - PMC - PubMed
    1. Polishchuk P. G.; Madzhidov T. I.; Varnek A. Estimation of the size of drug-like chemical space based on GDB-17 data. J. Comput.-Aided Mol. Des. 2013, 27, 675–679. 10.1007/s10822-013-9672-4. - DOI - PubMed
    1. Shoichet B. K. Virtual screening of chemical libraries. Nature 2004, 432, 862–5. 10.1038/nature03197. - DOI - PMC - PubMed
    1. Scior T.; Bender A.; Tresadern G.; Medina-Franco J. L.; Martinez-Mayorga K.; Langer T.; Cuanalo-Contreras K.; Agrafiotis D. K. Recognizing Pitfalls in Virtual Screening: A Critical Review. J. Chem. Inf. Model. 2012, 52, 867–881. 10.1021/ci200528d. - DOI - PubMed
    1. Cheng T.; Li Q.; Zhou Z.; Wang Y.; Bryant S. H. Structure-Based Virtual Screening for Drug Discovery: a Problem-Centric Review. AAPS J. 2012, 14, 133–141. 10.1208/s12248-012-9322-0. - DOI - PMC - PubMed