. 2018 Feb 28;4(2):277-287.
doi: 10.1021/acscentsci.7b00584. Epub 2018 Jan 17.

Dealloyed Intra-Nanogap Particles with Highly Robust, Quantifiable Surface-Enhanced Raman Scattering Signals for Biosensing and Bioimaging Applications

Affiliations

Dealloyed Intra-Nanogap Particles with Highly Robust, Quantifiable Surface-Enhanced Raman Scattering Signals for Biosensing and Bioimaging Applications

Minho Kim et al. ACS Cent Sci. .

Abstract

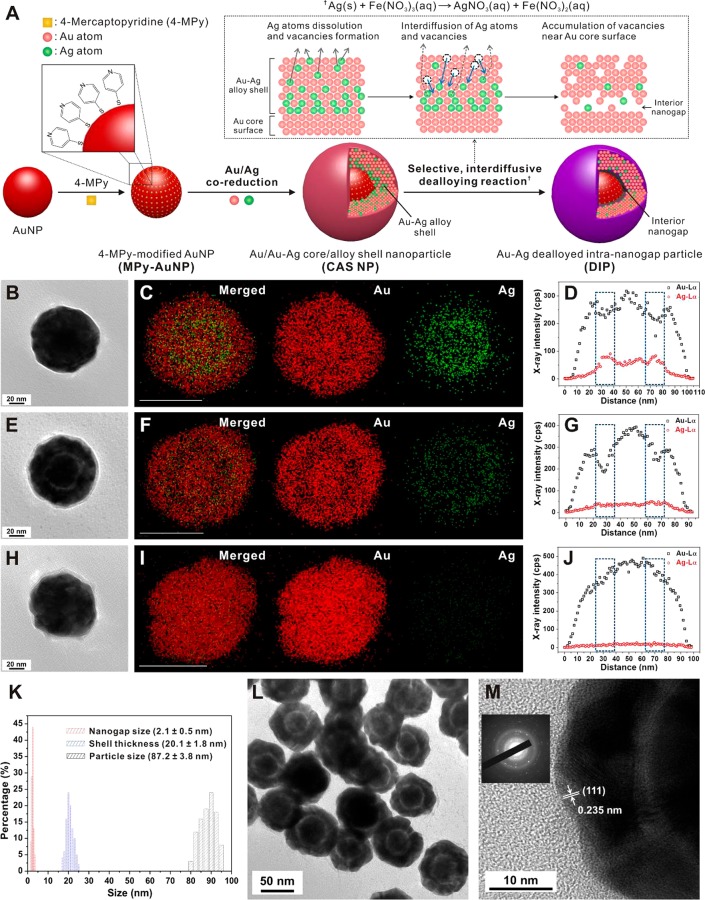
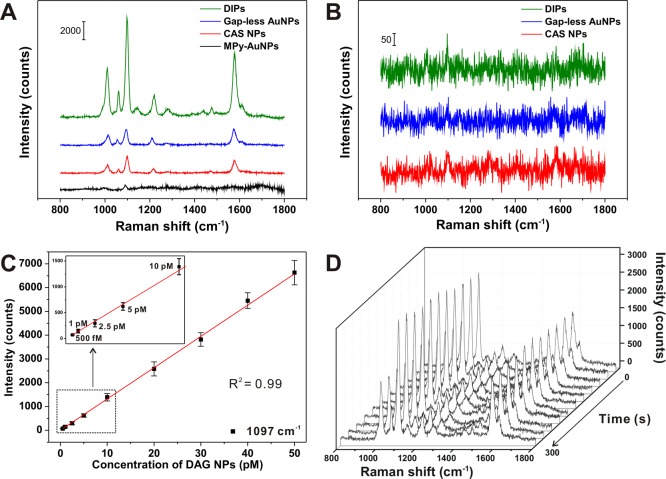
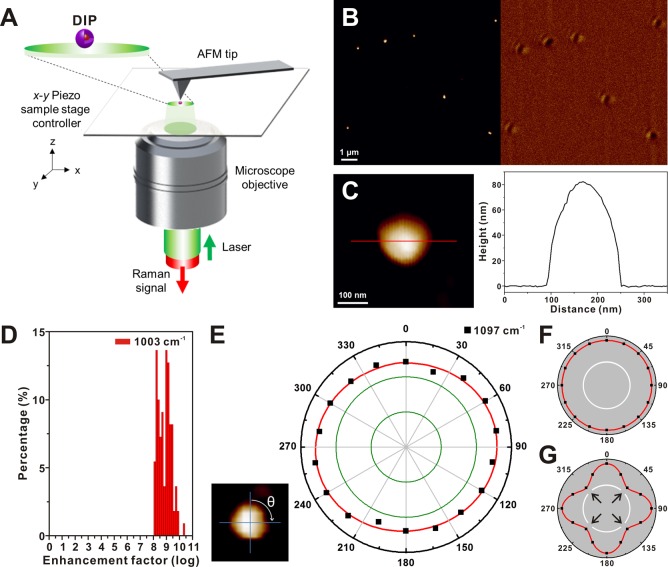
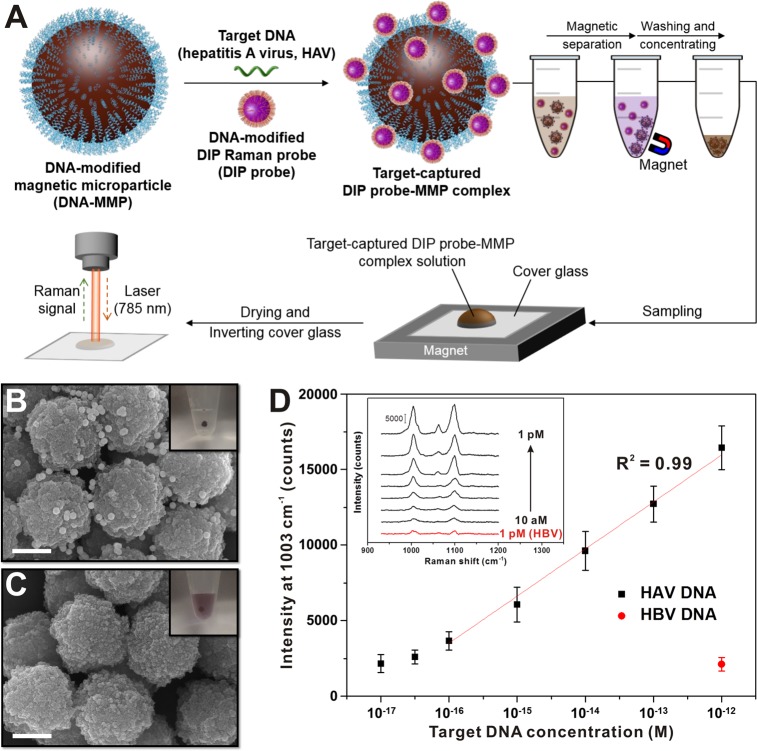
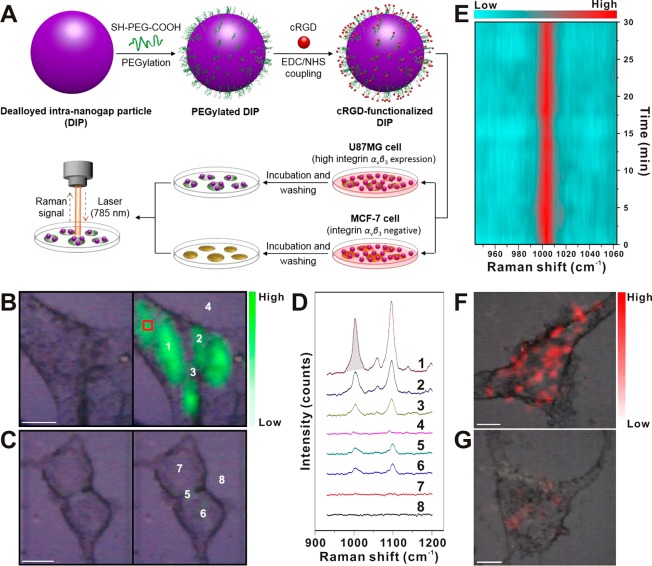
Uniformly controlling a large number of metal nanostructures with a plasmonically enhanced signal to generate quantitative optical signals and the widespread use of these structures for surface-enhanced Raman scattering (SERS)-based biosensing and bioimaging applications are of paramount importance but are extremely challenging. Here, we report a highly controllable, facile selective-interdiffusive dealloying chemistry for synthesizing the dealloyed intra-nanogap particles (DIPs) with a ∼2 nm intragap in a high yield (∼95%) without the need for an interlayer. The SERS signals from DIPs are highly quantitative and polarization-independent with polarized laser sources. Remarkably, all the analyzed particles displayed the SERS enhancement factors (EFs) of ≥1.1 × 10⁸ with a very narrow distribution of EFs. Finally, we show that DIPs can be used as ultrasensitive SERS-based DNA detection probes for detecting 10 aM to 1 pM target concentrations and highly robust, quantitative real-time cell imaging probes for long-term imaging with low laser power and short exposure time.


Conflict of interest statement

The authors declare no competing financial interest.

Figures

Figure 1
Figure 1
Synthetic strategy and characterization of dealloyed internanogap particles. (A) Schematic illustration of the selective, interdiffusive dealloying (SID)-based strategy for the synthesis of the Au–Ag dealloyed intra-nanogap particles (DIPs) from Au/Au–Ag core/alloy shell (CAS) NPs. The proposed mechanism of the SID reaction is shown in the black dotted box. (B–J) TEM images, EDX elemental mapping and EDX line scan profiles across the centers of NPs: (B–D) CAS NPs, (E−G) DIPs, and (H–J) gap-less Au–Au core–shell NPs. Ag atoms are primarily located near the Au core in a CAS NP (the blue dotted boxes in panel D) and the number of Ag atoms near the Au core decreases after the dealloying reaction (the blue dotted boxes in panel G), resulting in the interior nanogap. For gap-less AuNPs, an interior nanogap was not observed (the blue dotted boxes in panel J). The EDX map of Ag in panel I shows noise-level signals. The white scale bars are 50 nm. (K) Nanogap size, shell thickness, and particle size distributions of DIPs (the HR-TEM images of 100 particles were analyzed). (L) TEM image of DIPs. (M) HR-TEM image of a DIP. Here, d-spacing of 0.235 nm for adjacent lattice fringes corresponds to (111) planes of a face-centered cubic structure. The inset shows a ring-shaped SAED pattern of a DIP, indicating there is a polycrystalline structure.
Figure 2
Figure 2
Experimental UV–vis spectra of NPs and theoretical calculation of DIPs. (A) UV–vis spectra of as-synthesized NPs. Inset: colors of NP solutions. (B) Simulated extinction spectra of DIPs with varying metal compositions within the interior nanogap. The interior-nanogap region is filled with a mixture of metal residues and water in this model. (C and D) Calculated electric near-field EM field distributions of the DIPs containing different compositions of metal residues within the interior nanogap [(C) 12.5 mol % and (D) 0 mol %]. The excitation wavelength is 633 nm. Scale bar is 20 nm.
Figure 3
Figure 3
Nanostructure, Raman-dye position, particle concentration, and time-dependent SERS properties of as-synthesized NPs in solution. (A) SERS spectra of as-synthesized NPs in solution. Raman-dye molecules (4-MPy) were attached to Au core surfaces. (B) Solution-based SERS spectra of 4-MPy-modified NPs (all the dyes were modified to particle surfaces). (C) Particle concentration-dependent changes in SERS signal intensity with DIPs (500 fM to 50 pM; 1097 cm–1). (D) Time-dependent Raman profiles of DIPs. All the spectra were acquired using 633 nm excitation laser at laser power of 4 mW and acquisition time of 10 s. Particle concentration was (A and B) 100 pM and (D) 20 pM.
Figure 4
Figure 4
AFM-correlated Raman spectroscopy-based single-particle mapping analysis, SERS enhancement factor (EF) distribution, and polarization-resolved SERS plot for DIPs. (A) Instrumental setup used for AFM-correlated single-particle Raman spectroscopy. (B) Topographical matching of AFM image (left) and Rayleigh scattering image (right) for DIPs. (C) Magnified AFM image of a single DIP (left) and height profile across the NP (right, the red line in the AFM image). (D) A distribution of the SERS EF values at 1003 cm–1 as measured from individual DIPs (110 particles were analyzed). The EF values show a narrow distribution of large SERS EFs, range from 1.1 × 10⁸ to 2.5 × 10⁹ and 1.1 × 10⁸ to 5.3 × 10⁹ for 90.0% and 97.3% of particle populations, respectively. All the analyzed particles displayed the EFs of 1.1 × 10⁸ or larger. (E) Single-particle polarization-resolved plot of the SERS intensity at 1097 cm–1 with respect to rotation angle (θ). (F and G) The calculated polarization-resolved plots of the EM field in the interior-nanogap region with respect to a rotation angle for (F) DIP and (G) Au-NNP, respectively. The theoretical calculations were performed using the finite element method with COMSOL, and the maximal values of the EM field enhancement at each rotation angle were plotted. The black arrows in panel G indicate Au nanobridges.
Figure 5
Figure 5
SERS-based ultrasensitive DNA detection assay using DNA-functionalized DIPs. (A) Schematic illustration of SERS-based ultrasensitive DNA detection assay with DNA-modified DIP nanoprobes that sandwich-capture target DNA with DNA-modified magnetic microparticles. (B and C) SEM images of target-DNA-specific sandwich hybridization complexes (target-captured DIP probe-MMP complexes) formed using different linker DNA [(B) complementary sequence DNA (HAV); (C) noncomplementary sequence DNA (HBV)]. Inset images: color of assay solution under external magnetic field after DNA sandwich hybridization. Scale bars are 500 nm. (D) SERS-based DNA detection assay results with DNA-modified DIPs (SERS intensities at 1003 cm–1 were measured for different DNA concentrations of HAV (10 aM to 1 pM) and HBV (1 pM). Inset: Change in SERS spectra obtained using different concentrations of target DNA. All the spectra were obtained using 785 nm excitation laser at laser power of 2 mW and acquisition time of 5 s. SERS intensities were obtained and averaged with consecutive accumulation of five measurements for each concentration.
Figure 6
Figure 6
SERS-based integrin ανβ3-specific cell imaging using peptide-functionalized DIPs. (A) Schematic illustration of SERS-based target-specific cell imaging with cRGD-modified DIP nanoprobes. (B and C) Bright-field microscopy images (left) and SERS maps (right) of U87MG cells (B, high integrin ανβ3 expression) and MCF-7 cells (C, integrin ανβ3 negative) incubated with cRGD-functionalized DIPs. Scale bar is 10 μm. SERS intensity at each mapping pixel (2 μm × 2 μm) was integrated for SERS spectra ranging from 983 cm–1 to 1023 cm–1 indicated by the shaded region in Figure 6D and color-scaled for cell imaging. All the spectra were obtained using 785 nm excitation laser at 4 mW power and with acquisition time of 1 s. (D) The SERS spectra obtained from the numerically marked positions in Figure 6B and 6C. (E) Time-dependent Raman profiles of cRGD-functionalized DIPs in a cell measured within the red box in panel B. (F and G) SERS maps of U87MG cells incubated with cRGD-functionalized (F) DIPs and (G, average particle diameter of 80 nm) AuNPs, respectively. Scale bar is 10 μm. The SERS intensity at each mapping pixel (2 μm × 2 μm) was integrated for the SERS spectra ranging from 983 cm–1 to 1023 cm–1 and color-scaled for cell imaging. All the spectra were obtained using 633 nm excitation laser at 400 μW and with acquisition time of 1 s.

Similar articles

Cited by

  • Design of plasmonic nanomaterials for diagnostic spectrometry.
    Gurav DD, Jia YA, Ye J, Qian K. Gurav DD, et al. Nanoscale Adv. 2018 Nov 23;1(2):459-469. doi: 10.1039/c8na00319j. eCollection 2019 Feb 12. Nanoscale Adv. 2018. PMID: 36132258 Free PMC article. Review.
  • Surface-Enhanced Raman Spectroscopy for Biomedical Applications: Recent Advances and Future Challenges.
    Lin LL, Alvarez-Puebla R, Liz-Marzán LM, Trau M, Wang J, Fabris L, Wang X, Liu G, Xu S, Han XX, Yang L, Shen A, Yang S, Xu Y, Li C, Huang J, Liu SC, Huang JA, Srivastava I, Li M, Tian L, Nguyen LBT, Bi X, Cialla-May D, Matousek P, Stone N, Carney RP, Ji W, Song W, Chen Z, Phang IY, Henriksen-Lacey M, Chen H, Wu Z, Guo H, Ma H, Ustinov G, Luo S, Mosca S, Gardner B, Long YT, Popp J, Ren B, Nie S, Zhao B, Ling XY, Ye J. Lin LL, et al. ACS Appl Mater Interfaces. 2025 Mar 19;17(11):16287-16379. doi: 10.1021/acsami.4c17502. Epub 2025 Feb 24. ACS Appl Mater Interfaces. 2025. PMID: 39991932 Free PMC article. Review.
  • Quantitative Nanoplasmonics.
    Park JE, Jung Y, Kim M, Nam JM. Park JE, et al. ACS Cent Sci. 2018 Oct 24;4(10):1303-1314. doi: 10.1021/acscentsci.8b00423. Epub 2018 Aug 29. ACS Cent Sci. 2018. PMID: 30410968 Free PMC article. Review.
  • Facile synthesis of intra-nanogap enhanced Raman tags with different shapes.
    Fan S, Scarpitti BT, Luo Z, Smith AE, Ye J, Schultz ZD. Fan S, et al. Nano Res. 2024 Sep;17(9):8415-8423. doi: 10.1007/s12274-024-6807-y. Epub 2024 Jul 2. Nano Res. 2024. PMID: 39439578
  • Plasmonic Photothermal Nanoparticles for Biomedical Applications.
    Kim M, Lee JH, Nam JM. Kim M, et al. Adv Sci (Weinh). 2019 Jul 22;6(17):1900471. doi: 10.1002/advs.201900471. eCollection 2019 Sep 4. Adv Sci (Weinh). 2019. PMID: 31508273 Free PMC article. Review.

References

    1. Nam J.-M.; Oh J.-W.; Lee H.; Suh Y. D. Plasmonic nanogap-enhanced Raman scattering with nanoparticles. Acc. Chem. Res. 2016, 49, 2746–2755. 10.1021/acs.accounts.6b00409. - DOI - PubMed
    1. Huang Y.-F.; Zhang M.; Zhao L.-B.; Feng J.-M.; Wu D.-Y.; Ren B.; Tian Z.-Q. Activation of oxygen on gold and silver nanoparticles assisted by surface plasmon resonances. Angew. Chem., Int. Ed. 2014, 53, 2353–2357. 10.1002/anie.201310097. - DOI - PubMed
    1. Liu N.; Tang M. L.; Hentschel M.; Giessen H.; Alivisatos A. P. Nanoantenna-enhanced gas sensing in a single tailored nanofocus. Nat. Mater. 2011, 10, 631–636. 10.1038/nmat3029. - DOI - PubMed
    1. Bao W.; Melli M.; Caselli N.; Riboli F.; Wiersma D. S.; Staffaroni M.; Choo H.; Ogletree D. F.; Aloni S.; Bokor J.; Cabrini S.; Intonti F.; Salmeron M. B.; Yablonovitch E.; Schuck P. J.; Weber-Bargioni A. Mapping local charge recombination heterogeneity by multidimensional nanospectroscopic imaging. Science 2012, 338, 1317–1321. 10.1126/science.1227977. - DOI - PubMed
    1. Le Ru E. C.; Etchegoin P. G. Single-molecule surface-enhanced Raman spectroscopy. Annu. Rev. Phys. Chem. 2012, 63, 65–87. 10.1146/annurev-physchem-032511-143757. - DOI - PubMed

LinkOut - more resources