. 2018 Mar 7;4(3):eaar2766.
doi: 10.1126/sciadv.aar2766. eCollection 2018 Mar.

Immune evasion mediated by PD-L1 on glioblastoma-derived extracellular vesicles

Affiliations

Immune evasion mediated by PD-L1 on glioblastoma-derived extracellular vesicles

Franz L Ricklefs et al. Sci Adv. .

Abstract

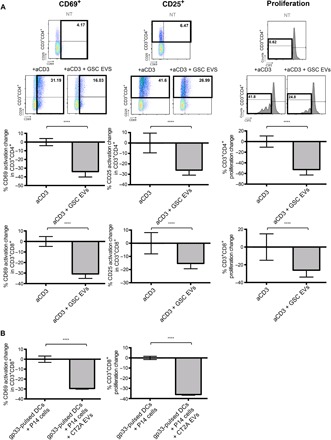
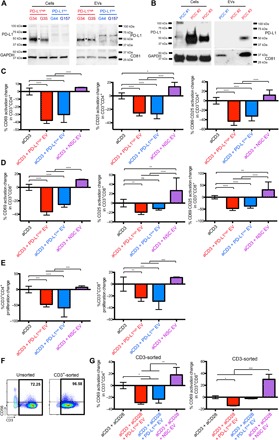
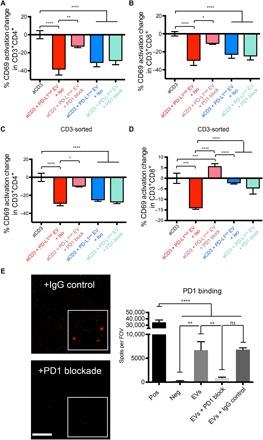
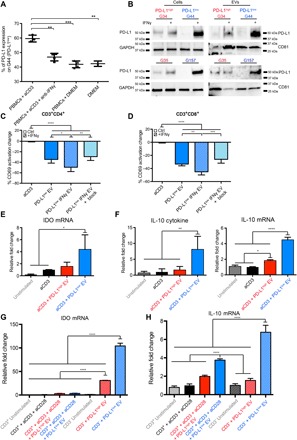
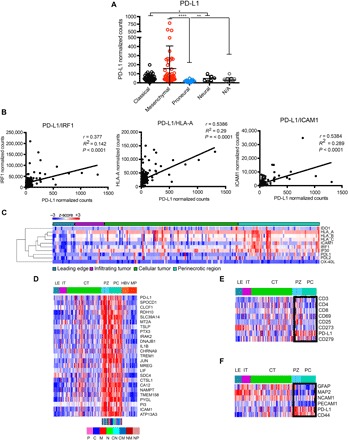
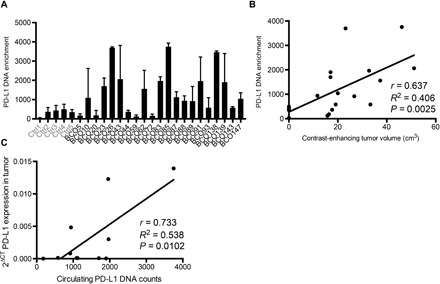
Binding of programmed death ligand-1 (PD-L1) to programmed cell death protein-1 (PD1) leads to cancer immune evasion via inhibition of T cell function. One of the defining characteristics of glioblastoma, a universally fatal brain cancer, is its profound local and systemic immunosuppression. Glioblastoma has also been shown to generate extracellular vesicles (EVs), which may play an important role in tumor progression. We thus hypothesized that glioblastoma EVs may be important mediators of immunosuppression and that PD-L1 could play a role. We show that glioblastoma EVs block T cell activation and proliferation in response to T cell receptor stimulation. PD-L1 was expressed on the surface of some, but not of all, glioblastoma-derived EVs, with the potential to directly bind to PD1. An anti-PD1 receptor blocking antibody significantly reversed the EV-mediated blockade of T cell activation but only when PD-L1 was present on EVs. When glioblastoma PD-L1 was up-regulated by IFN-γ, EVs also showed some PD-L1-dependent inhibition of T cell activation. PD-L1 expression correlated with the mesenchymal transcriptome profile and was anatomically localized in the perinecrotic and pseudopalisading niche of human glioblastoma specimens. PD-L1 DNA was present in circulating EVs from glioblastoma patients where it correlated with tumor volumes of up to 60 cm3. These results suggest that PD-L1 on EVs may be another mechanism for glioblastoma to suppress antitumor immunity and support the potential of EVs as biomarkers in tumor patients.


Figures

Fig. 1
Fig. 1. Glioblastoma EVs inhibit T cell activation in an antigen-specific manner.
(A) EVs from human GSC cultures inhibit both CD4+ and CD8+ T cell activation and proliferation. PBMCs (isolated from eight human volunteers, n = 8) were treated with anti-CD3 (500 ng/ml) to activate TCR signaling in the presence or absence of GSC EVs (5 μg/ml; isolated from four different GSCs, that is, n = 4) for 2 days. Top: Dot plots of CD69 and CD25 and proliferation flow cytometry data. Bottom: Percent changes of CD69 (left) and CD25 (middle) compared to anti-CD3 alone and percent change of proliferating cells (right) compared to anti-CD3 treatment alone after 3 days for CD4+ and CD8+ T cells, measured by carboxyfluorescein diacetate succinimidyl ester (CFSE) content. (B) EVs from CT2A glioma cells inhibited CD8+ T cells in an antigen-specific manner. Percent CD69 expression change (left) of CD8+ T cells isolated from transgenic P14 mice reacting against gp33 peptide presented by DC ± CT2A EVs; proliferation change (right) of gp33 antigen–specific P14 CD8+ T cells ± CT2A EVs measured by CFSE (n = 4). Statistical analysis was performed by two-tailed Student’s t test (****P < 0.0001). Bars represent means ± SD of each of the eight T cell preparations after incubation with one EV preparation from each of the four gender-matched GSC EVs.
Fig. 2
Fig. 2. Glioblastoma EVs contain PD-L1 and block TCR-mediated T cell activation.
(A) Detection of PD-L1 by Western blot in glioblastoma EVs. Four GSCs were analyzed for their cellular and EV PD-L1 expression (red, PD-L1high; blue, PD-L1low). GAPDH, glyceraldehyde-3-phosphate dehydrogenase. (B) PD-L1 is found in primary cell cultures (PCCs) from glioblastoma patients and EVs isolated from these cell cultures. (C and D) PD-L1high and PD-L1low GSC EVs inhibit CD4+ (C) and CD8+ (D) T cell activation. Percent CD69 and CD25 and CD69+CD25+ expression change compared to anti-CD3 for 2 days ± glioblastoma EVs (5 μg/ml) from four different GSCs. Anti-CD3–stimulated PBMCs were from eight human volunteers ± PD-L1high/low EVs, and NSC EVs were added to anti-CD3–stimulated PBMCs from three human volunteers. (E) GSC EVs can inhibit T cell proliferation. Percent change of proliferating cells compared to anti-CD3 treatment after 3 days for CD4+ and CD8+ T cells, measured by CFSE content (aCD3 ± PD-L1high/low EVs, n = 7; NSC EVs, n = 3). (F) T cell inhibition is partially mediated by a direct effect on T cells. Left: unsorted PBMCs. Right: CD3+ cells are enriched after sorting. (G) CD3+CD4+ (left) and CD3+CD8+ (right) cells (n = 3) after treatment. Statistical analysis was performed by one-way analysis of variance (ANOVA), with post hoc Bonferroni’s correction (****P < 0.0001, ***P < 0.001, **P < 0.01, and *P < 0.05; ns, not significant.). Examples of the flow cytometry data are available at http://harveycushing.bwh.harvard.edu/chiocca-lab/.
Fig. 3
Fig. 3. Glioblastoma EVs contain PD-L1 that directly interacts with PD1, and the interaction is displaced by anti-PD1 treatment.
(A and B) PD1 blockade prevents the inhibition of PD-L1high GSC EVs on PBMCs. Percent change in CD69 expression for CD4+ (A) and CD8+ (B) T cells. PD1 blocking antibody (10 μg/ml) or isotype control (10 μg/ml) was added at day 0 (n = 7 PBMC donors, means ± SD). (C and D) PD1 blockade furthermore prevents the inhibition of PD-L1high GSC EVs on CD3+ isolated cells. CD3+CD4+ (C) and CD3+CD8+ (D) cells (n = 3) after treatment. (E) PD-L1–carrying, palmtdT-labeled PD-L1high GSC EVs can bind to wells coated with recombinant PD1, whereas PD1 antibody blockade inhibits EV binding. Representative confocal images are shown on the left, whereas quantification is provided on the right. Spots per field of view (FOV) on the y axis represent palmtdT-positive dots. Scale bar, 50 μm; ×500 magnification inserts; quadruplicates as means ± SD. One-way ANOVA, with post hoc Bonferroni’s correction, was used to differentiate multiple groups (****P < 0.0001, ***P < 0.001, **P < 0.01, and *P < 0.05).
Fig. 4
Fig. 4. PD-L1 is up-regulated in response to IFN-γ in PD-L1low GSCs and their EVs that can now suppress activated T cells in a PD-L1–dependent manner.
(A) Glioma GSCs up-regulate PD-L1 in vitro in response to activated PBMC supernatants. PBMCs were stimulated with anti-CD3, and supernatants were collected and co-incubated with GSCs (G44, a PD-L1low GSC) in the presence or absence of anti–IFN-γ. PD-L1 expression was measured by flow cytometry. DMEM, Dulbecco’s modified Eagle’s medium. (B) IFN-γ–mediated increase of PD-L1 expression levels in PD-L1High and PD-L1low GSCs as shown by Western blots of four different GSCs. (C and D) EVs derived from IFN-γ–treated PD-L1low GSCs inhibit anti-CD3–stimulated T cell activation, and this can be partially reversed by PD1 blockade. Inhibition potential was measured by the percentage change of CD69+ levels on anti-CD3–stimulated CD3+CD4+ (C) or CD3+CD8+ (D) cells, isolated from five human volunteers (means ± SD). Representative dot plots for (C) and (D) can be found in fig. S4C. (E) PD-L1low EVs up-regulated indoleamine 2,3-dioxygenase (IDO) mRNA in PBMCs treated with PD-L1low EVs. Quantitative polymerase chain reaction (qPCR) expression levels are shown (n = 3). (F) PD-L1low EVs cause interleukin-10 (IL-10) up-regulation in PBMCs. IL-10 cytokine (left) and qPCR expression levels (right) are shown (n = 3). (G and H) Immunosuppressive molecules IDO and IL-10 primarily derive from the CD3-negative population. IDO (G) and IL-10 (H) mRNA levels are shown after CD3+ magnetic-activated cell sorting (n = 3). Data sets consist of EVs from four different glioblastoma cell lines with means ± SD. One-way ANOVA, with post hoc Bonferroni’s correction, was used to differentiate multiple groups (****P < 0.0001, ***P < 0.001, **P < 0.01, and *P < 0.05). Student’s t test was used to differentiate between two groups, and one-way ANOVA with post hoc Bonferroni’s correction was used for multiple groups (****P < 0.0001, ***P < 0.001, **P < 0.01, and *P < 0.05).
Fig. 5
Fig. 5. PD-L1 expression correlates with M glioblastoma and IFN-γ response genes.
(A) Analysis of TCGA RNA-seq data for PD-L1 expression shows mesenchymal enrichment. The dots represent individual patients. (B) PD-L1 expression correlates with IFN-γ response factor (IRF1), human leukocyte antigen A (HLA-A), and intercellular adhesion molecule 1 (ICAM1) levels. (C) Ivy Glioma database RNA-seq analysis of laser-captured specimens from different regions of glioblastomas (leading edge, infiltrating tumor, cellular tumor, and perinecrotic areas) shows anatomical clustering of PD-L1 with known IFN-γ response genes. (D) The expression of PD-L1 correlates with immune response genes in perinecrotic and pseudopalisading niches of glioblastoma tumors. The correlation of PD-L1 expression (R > 0.6) with Ivy GAP database–based expression signatures in different anatomic areas of glioblastoma was analyzed (LE, leading edge; IT, infiltrating tumor; CT, cellular tumor; PZ, perinecrotic zone; PC, pseudopalisading cells around necrosis; HBV, hyperplastic blood vessels; MP, microvascular proliferation; P, proneural; C, classical; M, mesenchymal; N, neural). (E) The expression of PD-L1 inversely correlates with T cell markers in the tumor anatomic niche. Selected genes were queried with Ivy GAP database–based expression signatures in different anatomic areas of glioblastomas. The box denotes PZ and PC areas of tumor. (F) The expression of PD-L1 positively correlates with mesenchymal tumor markers in the tumor anatomic niche. Selected genes were queried with Ivy GAP database–based expression signatures in different anatomic areas of glioblastoma. The boxes denote PZ and PC areas of tumor. The Kruskal-Wallis test with Dunn’s correction was used to differentiate TCGA groups (****P < 0.0001, **P < 0.01, and *P < 0.05).
Fig. 6
Fig. 6. Glioblastoma patient–derived serum and plasma EVs contain PD-L1 DNA whose levels correlate with tumor volume.
(A) PD-L1 DNA enrichment is found specifically in patient-derived EVs (healthy controls, n = 5; glioblastoma patients, n = 21). (B) PD-L1 DNA enrichment highly correlates with CET of <60 cm3 (Pearson’s correlation with nonlinear regression, r = 0.637, R2 = 0.406, P = 0.0025). (C) PD-L1 expression in tumors correlates with PD-L1 DNA in patient blood (Pearson’s correlation with nonlinear regression, r = 0.733, R2 = 0.538, P = 0.0102).

Similar articles

Cited by

References

    1. Stupp R., Mason W. P., van den Bent M. J., Weller M., Fisher B., Taphoorn M. J. B., Belanger K., Brandes A. A., Marosi C., Bogdahn U., Curschmann J., Janzer R. C., Ludwin S. K., Gorlia T., Allgeier A., Lacombe D., Cairncross J. G., Eisenhauer E., Mirimanoff R. O. European Organisation for Research and Treatment of Cancer Brain Tumor and Radiotherapy Groups; National Cancer Institute of Canada Clinical Trials Group , Radiotherapy plus concomitant and adjuvant temozolomide for glioblastoma. N. Engl. J. Med. 352, 987–996 (2005). - PubMed
    1. Reardon D. A., Freeman G., Wu C., Chiocca E. A., Wucherpfennig K. W., Wen P. Y., Fritsch E. F., Curry W. T. Jr, Sampson J. H., Dranoff G., Immunotherapy advances for glioblastoma. Neuro Oncol. 16, 1441–1458 (2014). - PMC - PubMed
    1. Pardoll D. M., The blockade of immune checkpoints in cancer immunotherapy. Nat. Rev. Cancer 12, 252–264 (2012). - PMC - PubMed
    1. Mahoney K. M., Rennert P. D., Freeman G. J., Combination cancer immunotherapy and new immunomodulatory targets. Nat. Rev. Drug Discov. 14, 561–584 (2015). - PubMed
    1. Kmiecik J., Poli A., Brons N. H. C., Waha A., Eide G. E., Enger P. Ø., Zimmer J., Chekenya M., Elevated CD3+ and CD8+ tumor-infiltrating immune cells correlate with prolonged survival in glioblastoma patients despite integrated immunosuppressive mechanisms in the tumor microenvironment and at the systemic level. J. Neuroimmunol. 264, 71–83 (2013). - PubMed

Publication types

MeSH terms