

Trends in Opioid Use and Prescribing in Medicare, 2006-2012
- PMID: 29532477
- PMCID: PMC6153155
- DOI: 10.1111/1475-6773.12846
Trends in Opioid Use and Prescribing in Medicare, 2006-2012
Abstract
Objective: To determine characteristics and trends in opioid use, questionable use, and prescribing in Medicare.
Study setting: Opioid prescriptions filled through Medicare Part D for beneficiaries with full-year, fee-for-service Medicare coverage during 2006 to 2012.
Study design: Retrospective analysis of a 20 percent sample of Medicare claims data. Estimates are adjusted using multivariable regression analysis.
Data collection: Opioid use, opioid abuse, questionable opioid use, and opioid prescribing by specialty.
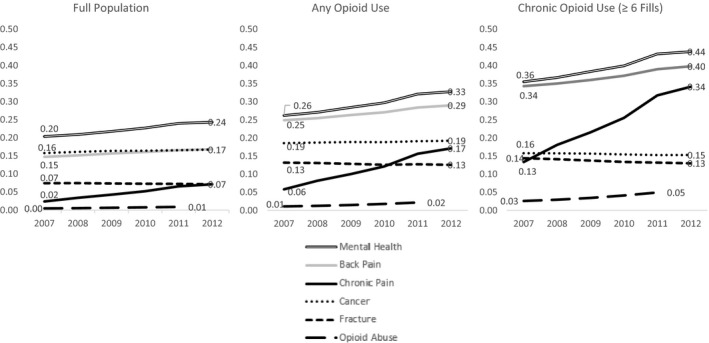
Principal findings: Opioid use in Medicare was stable from 2006 to 2012 on average. More than 1 in 3 beneficiaries filled an opioid prescription annually; about 1 in 10 were chronic opioid users. The distribution of opioid users shifted in favor of diagnoses often associated with chronic pain. Opioid users were increasingly likely to abuse opioids or display patterns of questionable use from 2006 to 2010, with a slowdown in later years. Average outcomes mask significant variation as the distribution of opioid use widened over the analysis period. Prescribing quantity and intensity varied by specialty. The largest quantity increases were among nurse practitioners and physician assistants.
Conclusions: Opioid utilization and prescribing are increasingly heterogeneous from 2006 to 2012. Future research should focus on explaining differential trends in utilization and prescribing.
Keywords: Medicare Part D; Opioids; prescribing behavior.
© Health Research and Educational Trust.
Figures
References
-
- Buntin, M. B. , and Zaslavsky A. M.. 2004. “Too Much Ado about Two‐part Models and Transformation?: Comparing Methods of Modeling Medicare Expenditures.” Journal of Health Economics 23 (3): 525–42. - PubMed
-
- Dart, R. C. , Surratt H. L., Cicero T. J., Parrino M. W., Severtson S. G., Bucher‐Bartelson B., and Green J. L.. 2015. “Trends in Opioid Analgesic Abuse and Mortality in the United States.” New England Journal of Medicine 372 (3): 241–8. - PubMed
-
- Deshpande, A. , Furlan A. D., Mailis‐Gagnon A., Atlas S., and Turk D.. 2007. Opioids for Chronic Low‐back Pain. Cochrane Database of Systematic Reviews. 3 (3): CD004959. - PubMed
Publication types
MeSH terms
Substances
Grants and funding
LinkOut - more resources
Full Text Sources
Other Literature Sources
Medical
