. 2018 Sep;21(5):e12662.
doi: 10.1111/desc.12662. Epub 2018 Mar 13.

Children's academic attainment is linked to the global organization of the white matter connectome

Affiliations

Children's academic attainment is linked to the global organization of the white matter connectome

Joe Bathelt et al. Dev Sci. 2018 Sep.

Abstract

Literacy and numeracy are important skills that are typically learned during childhood, a time that coincides with considerable shifts in large-scale brain organization. However, most studies emphasize focal brain contributions to literacy and numeracy development by employing case-control designs and voxel-by-voxel statistical comparisons. This approach has been valuable, but may underestimate the contribution of overall brain network organization. The current study includes children (N = 133 children; 86 male; mean age = 9.42, SD = 1.715; age range = 5.92-13.75y) with a broad range of abilities, and uses whole-brain structural connectomics based on diffusion-weighted MRI data. The results indicate that academic attainment is associated with differences in structural brain organization, something not seen when focusing on the integrity of specific regions. Furthermore, simulated disruption of highly-connected brain regions known as hubs suggests that the role of these regions for maintaining the architecture of the network may be more important than specific aspects of processing. Our findings indicate that distributed brain systems contribute to the etiology of difficulties with academic learning, which cannot be captured using a more traditional voxel-wise statistical approach.


Figures

Figure 1
Figure 1
(A) Illustration of skills required to reach age‐appropriate scores at different ages on the Wechsler Individual Achievement Test 2nd edition UK (WIATII UK) Word Reading task (left) and the Numerical Operations task (right). Skills assessed on the attainment measures ranged from basic fact retrieval to complex skills, including the ability to read of non‐phonetic words and solving multi‐step calculations. (B) Age distribution in the current study. The solid line indicates the mean of the sample and the dashed lines show the 25th and 75th percentiles. (C) Distribution of age‐standardized scores for reading and arithmetic in the current sample. The solid line indicates the age‐expected mean and the dashed lines show scores ± 1 standard deviation around the age‐expected mean based on the standardization sample. (D) Relationship between participant age and academic attainment scores. Scores represent raw scores scaled to the mean and standard deviation of the sample (z‐transformed)
Figure 2
Figure 2
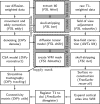
Overview of processing steps used to create white matter connectomes from structural MRI data
Figure 3
Figure 3
(A) Comparison of the observed structural networks (red) and random networks with the same degree distribution and density (blue) (B) Regression analysis with attainment scores as the outcome and average clustering (CG) and global efficiency (EG) after regressing the effect of brain volume, movement, and age. (C) Summary of mediation analysis. The values indicate the beta weights of each connection. Legend: ***p < .001; ** p < .01; * p < .05; B & C: Bonferroni‐corrected p‐values are shown
Figure 4
Figure 4
(A) Relationship between local clustering (Cj), local efficiency (Ej), and maths and reading scores. The colour indicates regression coefficients for each region controlling for the effect of motion, brain volume, and the linear and quadrative effect of age. (B) Group‐average connectome thresholded at FA > 0.1 for illustration purposes. (C) Degree (Dj) of nodes in the group‐average connectome. Nodes shown in red are considered hubs with a degree that is one standard deviation above the mean across nodes. (D) CG and EG of the mean network after reducing the connection strength of hub or peripheral nodes. (E) Relationship between the average clustering coefficient and average local efficiency of the hub and peripheral nodes with age. The solid line indicates the best fit from the model for hub nodes and the dashed line shows the fit for peripheral nodes. (F) Relationship between graph measures and academic attainment scores. The values represent the residual of the graph measures after regressing the effect of age (linear, squared), brain volume, and movement. The solid line indicates the line of best fit for hub nodes and the dashed line shows the best fit for peripheral nodes one standard deviation above the mean across nodes
Figure 5
Figure 5
(A) Voxel‐wise comparison of FA values between children with low performance on academic attainment measures compared to children with performance in the age‐expected range. (B) Voxel‐wise analysis of the association between FA values and continuous academic attainment scores. The colours indicate the p‐value after correction for multiple comparisons using cluster‐free threshold enhancement with permutation testing

References

    1. Alloway, T. (2007). Automated Working Memory Assessment (AWMA). London: Pearson Assessment.
    1. Avants, B.B. , Tustison, N.J. , Song, G. , Cook, P.A. , Klein, A. , & Gee, J.C. (2011). A reproducible evaluation of ANTs similarity metric performance in brain image registration. NeuroImage, 54, 2033–2044. - PMC - PubMed
    1. Ball, G. , Aljabar, P. , Zebari, S. , Tusor, N. , Arichi, T. , Merchant, N. , … Edwards, N. (2014). Rich‐club organization of the newborn human brain. Proceedings of the National Academy of Sciences, USA, 111, 7456–7461. - PMC - PubMed
    1. Baker, S.T.E. , Lubman, D.I. , Yucel, M. , Allen, N.B. , Whittle, S. , Fulcher, B.D. , & Zalesky, A. (2015). Developmental changes in brain network hub connectivity in late adolescence. Journal of Neuroscience, 35, 9078–9087. - PMC - PubMed
    1. Batalle, D. , Eixarch, E. , Figueras, F. , Munoz‐Moreno, E. , Bargallo, N. , Illa, M. , … Gratacos, E. (2012). Altered small‐world topology of structural brain networks in infants with intrauterine growth restriction and its association with later neurodevelopmental outcome. NeuroImage, 60, 1352–1366. - PubMed

Publication types

LinkOut - more resources