

Leptospirosis Outbreak After the 2014 Major Flooding Event in Kelantan, Malaysia: A Spatial-Temporal Analysis
- PMID: 29532771
- PMCID: PMC5953347
- DOI: 10.4269/ajtmh.16-0922
Leptospirosis Outbreak After the 2014 Major Flooding Event in Kelantan, Malaysia: A Spatial-Temporal Analysis
Abstract
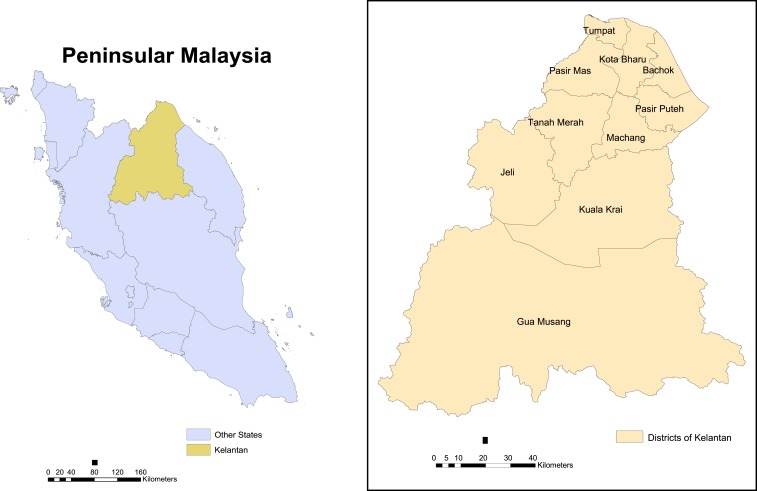
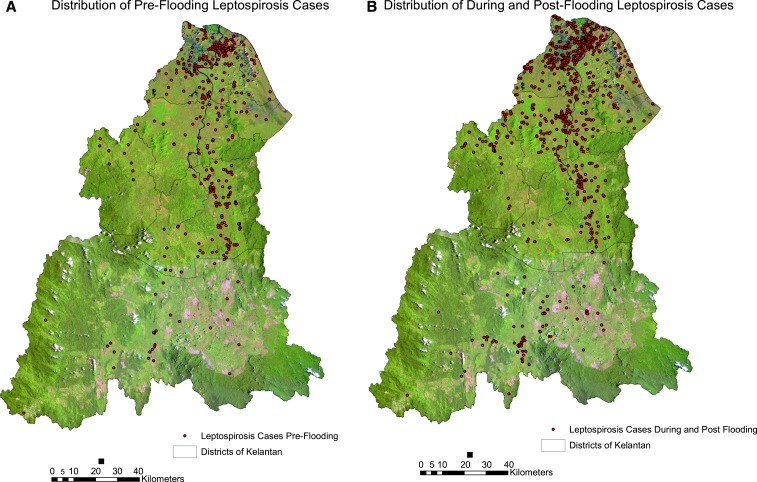
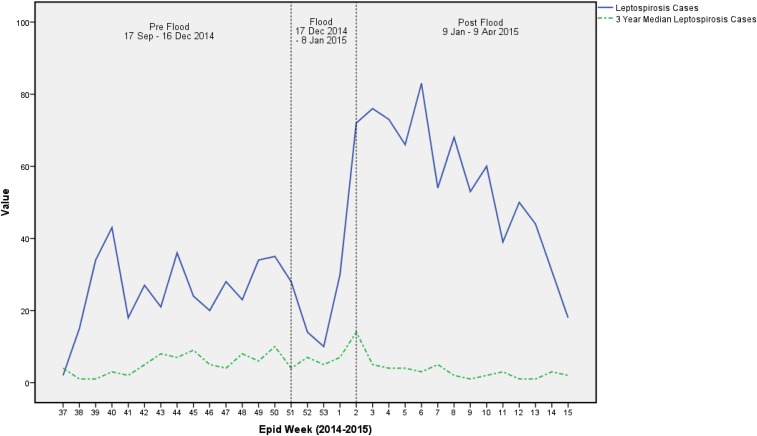
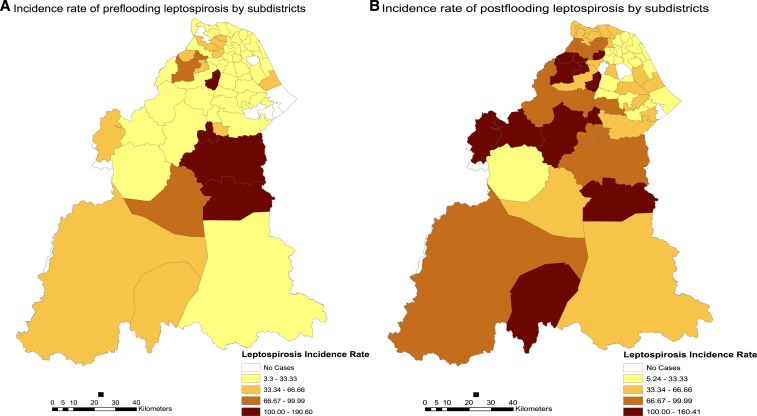
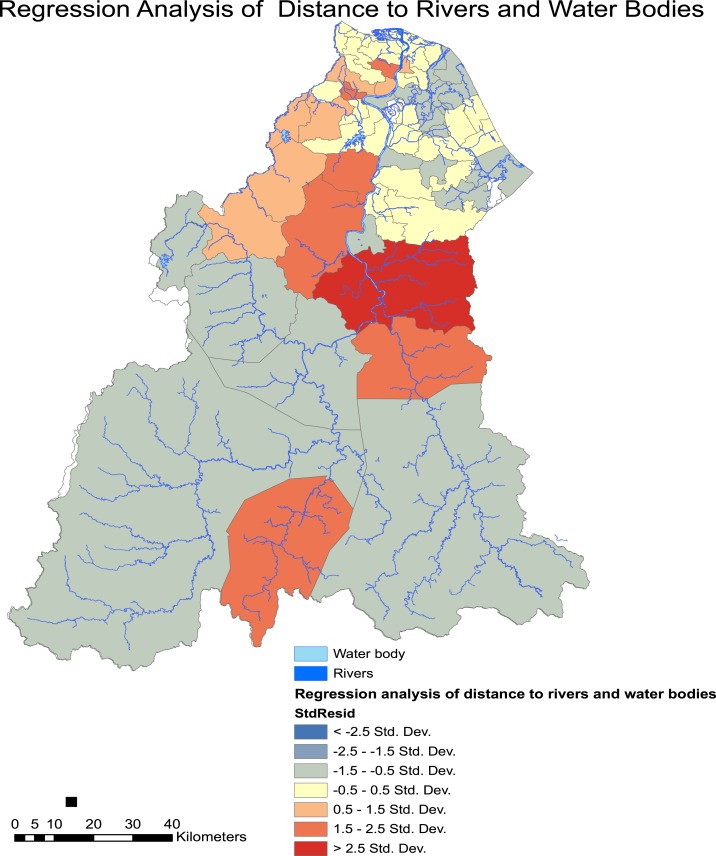
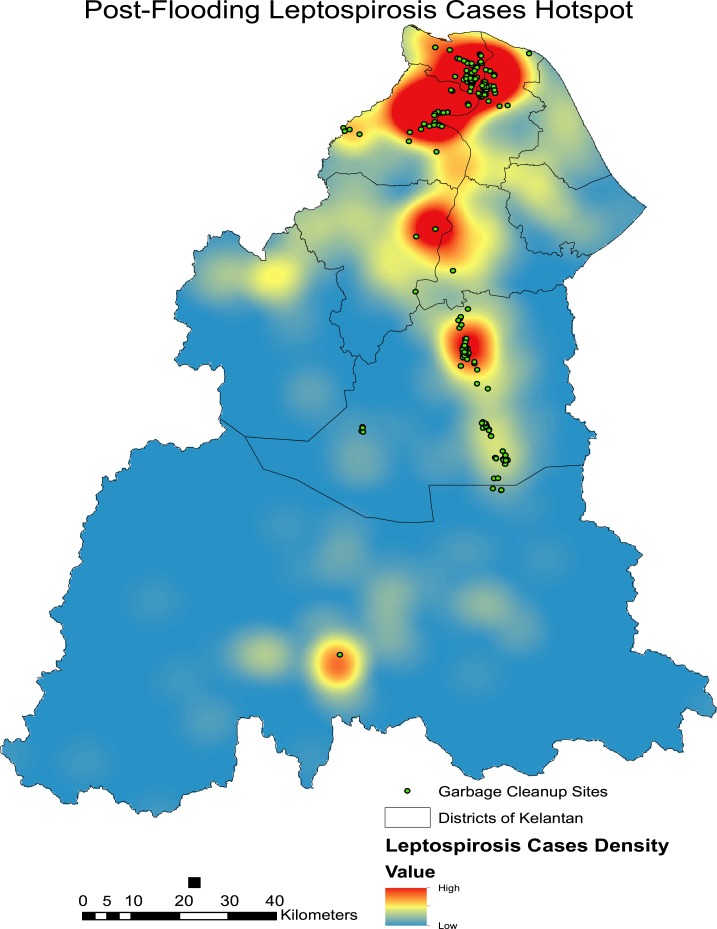
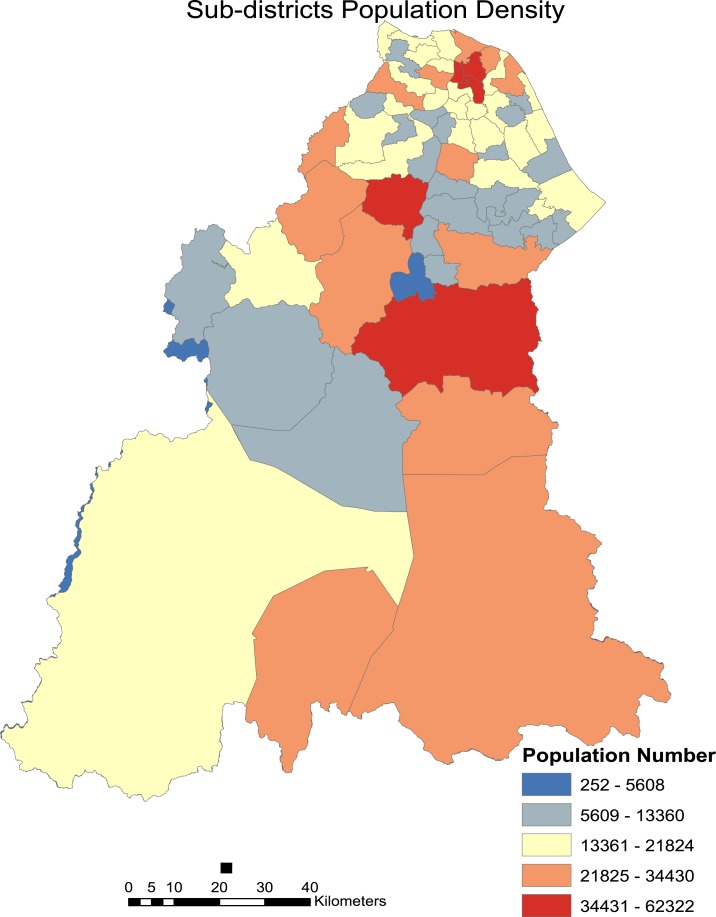
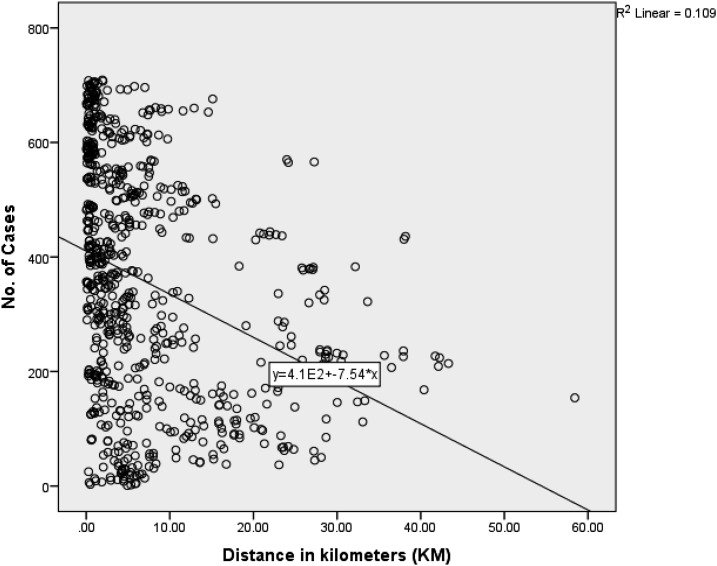
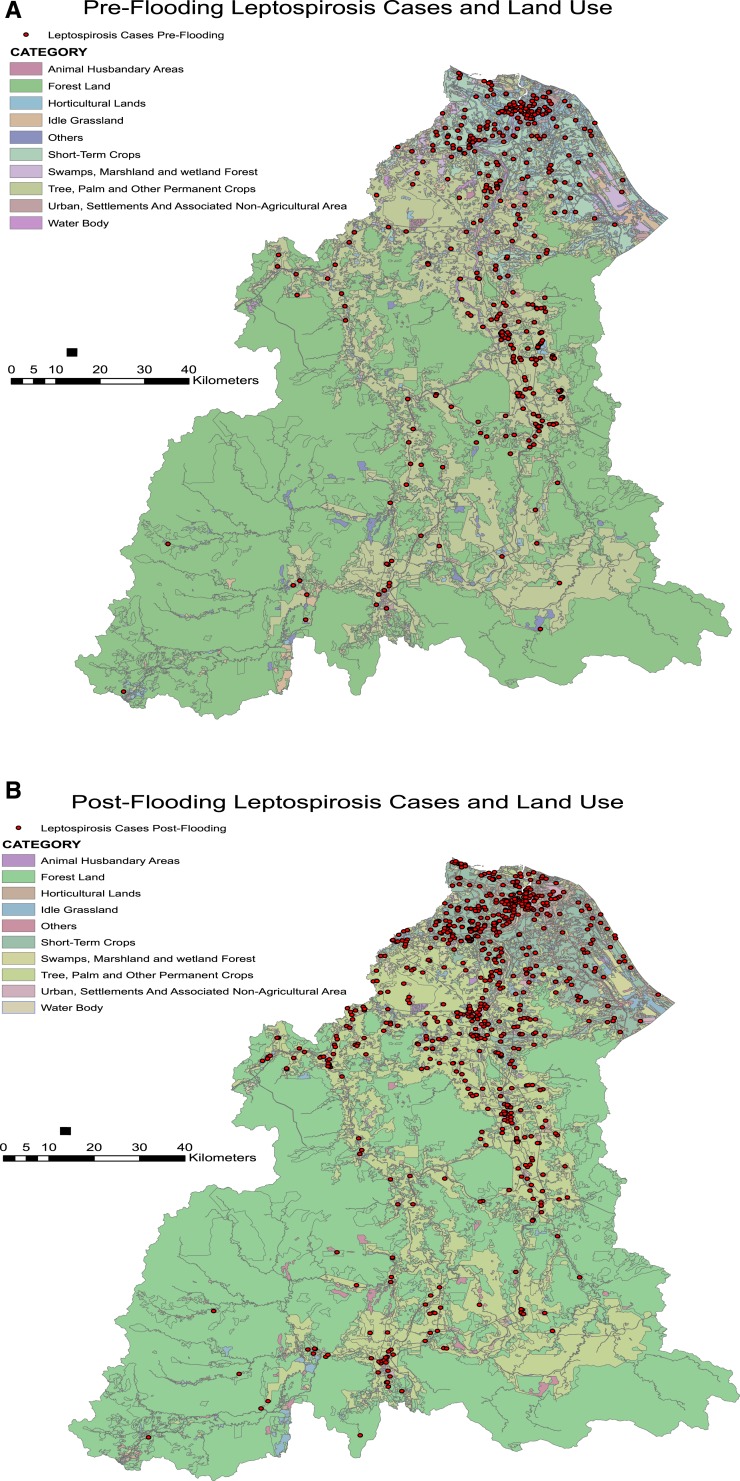
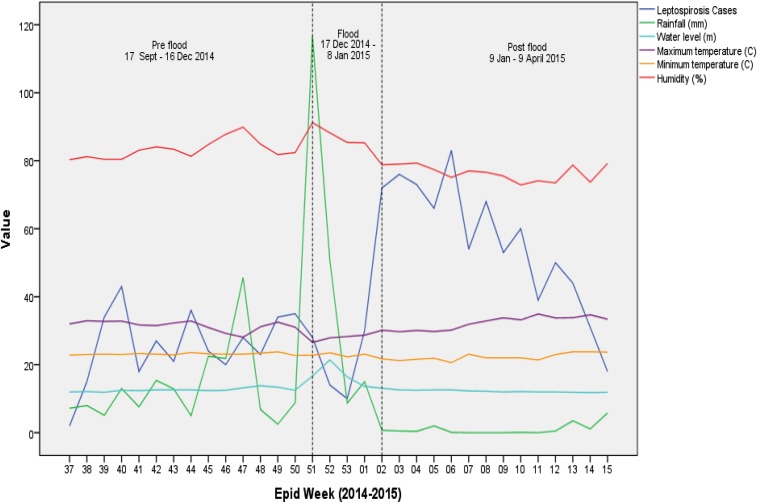
Severe floods increase the risk of leptospirosis outbreaks in endemic areas. This study determines the spatial-temporal distribution of leptospirosis in relation to environmental factors after a major flooding event in Kelantan, Malaysia. We conducted an observational ecological study involving incident leptospirosis cases, from the 3 months before, during, and three months after flood, in reference to the severe 2014 Kelantan flooding event. Geographical information system was used to determine the spatial distribution while climatic factors that influenced the cases were also analyzed. A total of 1,229 leptospirosis cases were notified within the three study periods where incidence doubled in the postflood period. Twelve of 66 subdistricts recorded incidence rates of over 100 per 100,000 population in the postflood period, in comparison with only four subdistricts in the preflooding period. Average nearest neighborhood analysis indicated that the cases were more clustered in the postflood period as compared with the preflood period, with observed mean distance of 1,139 meters and 1,666 meters, respectively (both at P < 0.01). Global Moran's I was higher in the postflood period (0.19; P < 0.01) as compared with the preflood period (0.06; P < 0.01). Geographic weighted regression showed that living close to water bodies increased the risk of contracting the disease. Postflooding hotspots were concentrated in areas where garbage cleanup occurred and the incidence was significantly associated with temperature, humidity, rainfall, and river levels. Postflooding leptospirosis outbreak was associated with several factors. Understanding the spatial distribution and associated factors of leptospirosis can help improve future disease outbreak management after the floods.
Figures
References
-
- Azlee A, 2015. Worst floods in Kelantan, confirms NSC. Available at: http://www.themalaymailonline.com/print/malaysia/worst-floods-in-kelanta.... Accessed March 4, 2015.
-
- WHO , 2014. Leptospirosis Excerpt from “WHO Recommended Standards and Strategies for Surveillance, Prevention and Control of Communicable Diseases,” 1–4. Geneva, Switzerland: World Health Organization.
-
- WHO , 2003. Human Leptospirosis: Guidance for Diagnosis, Surveillance and Control. Geneva, Switzerland: World Health Organization.
-
- Lau C, 2009. Urbanisation, Climate Change, and Leptospirosis: Environmental Drivers of Infectious Disease Emergence. Universitas 21 International Graduate Research Conference: Sustainable Cities for the Future, 83–87. Available at: http://scholar.google.com/scholar?hl=en&btnG=Search&q=intitle:Urbanisati.... Accessed May 24, 2016.
-
- Wahab ZA, 2015. Epidemiology and Current Situation of Leptospirosis in Malaysia. Persidangan Kesihatan Persekitaran Pihak Berkuasa Tempatan 2015, September 8–9, 2015, 1–67.
Publication types
MeSH terms
LinkOut - more resources
Full Text Sources
Other Literature Sources
Medical
