. 2017 Oct;12(10):2215-2231.
doi: 10.1038/nprot.2017.104. Epub 2017 Sep 29.

Rapid immunopurification of mitochondria for metabolite profiling and absolute quantification of matrix metabolites

Affiliations

Rapid immunopurification of mitochondria for metabolite profiling and absolute quantification of matrix metabolites

Walter W Chen et al. Nat Protoc. 2017 Oct.

Abstract

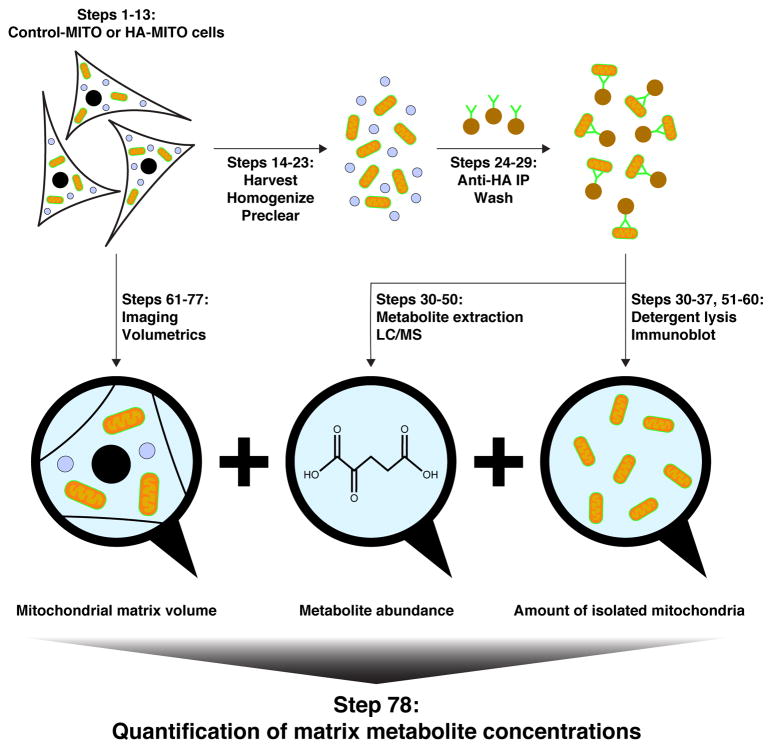
Mitochondria carry out numerous metabolic reactions that are critical to cellular homeostasis. Here we present a protocol for interrogating mitochondrial metabolites and measuring their matrix concentrations. Our workflow uses high-affinity magnetic immunocapture to rapidly purify HA-tagged mitochondria from homogenized mammalian cells in ∼12 min. These mitochondria are extracted with methanol and water. Liquid chromatography and mass spectrometry (LC/MS) is used to determine the identities and mole quantities of mitochondrial metabolites using authentic metabolite standards and isotopically labeled internal standards, whereas the corresponding mitochondrial matrix volume is determined via immunoblotting, confocal microscopy of intact cells, and volumetric analysis. Once all values have been obtained, the matrix volume is combined with the aforementioned mole quantities to calculate the matrix concentrations of mitochondrial metabolites. With shortened isolation times and improved mitochondrial purity when compared with alternative methods, this LC/MS-compatible workflow allows for robust profiling of mitochondrial metabolites and serves as a strategy generalizable to the study of other mammalian organelles. Once all the necessary reagents have been prepared, quantifying the matrix concentrations of mitochondrial metabolites can be accomplished within a week.


Conflict of interest statement

COMPETING FINANCIAL INTERESTS:

Walter W. Chen is a consultant for VL39, a company developing novel therapeutic modalities for treating mitochondrial pathologies.

Figures

Figure 1
Figure 1. Workflow for quantifying matrix concentrations of mitochondrial metabolites
Step numbers in the figure correspond to those in the PROCEDURE of the manuscript. Cells expressing appropriate amounts of the 3XMyc-EGFP-OMP25 gene (Control-MITO cells) or the 3XHA-EGFP-OMP25 gene (HA-MITO cells) are generated using retroviral transduction and fluorescence-activated cell sorting in steps 1–13. Control-MITO or HA-MITO cells are quickly harvested and homogenized, with the homogenate precleared to remove cells, nuclei, and other large debris, resulting in a suspension of mitochondria and other organelles (steps 14–23). After a short anti-HA immunopurification (IP) (3.5 min in length) to capture HA-tagged mitochondria, antibody-conjugated beads are quickly washed three times (steps 24–29). The majority of the isolated mitochondria are extracted for metabolites and the corresponding mole quantities determined by liquid chromatography and mass spectrometry (LC/MS) (steps 30–50). The remaining isolated mitochondria are then lysed for protein and whole-cell equivalents of mitochondria in each IP sample are determined by immunoblot analysis (steps 30–37, 51–60). Confocal microscopy and volumetric analysis of HA-MITO cells is used to quantify the total mitochondrial volume per cell, which is then adjusted using the percentage of mitochondrial volume occupied by the matrix (~63.16% of mitochondrial volume = matrix) (steps 61–77). The matrix concentration of a mitochondrial metabolite is derived from the combination of all of these measurements (step 78).
Figure 2
Figure 2. The degree of HA-MITO construct expression affects the purity of isolated mitochondria
(a) Illustrative flow cytometric plots of HeLa cells with appropriate expression levels of the Control-MITO construct (Control-MITO) and the HA-MITO construct (HA-MITO) versus those with high expression levels of the Control-MITO construct (Control-MITO high) and the HA-MITO construct (HA-MITO high). The light green and light blue quadrants denote areas of EGFP-positivity and background EGFP signal, respectively. The gating strategy is detailed in Supplementary Figure 1. The forward scatter (area) axis is linear and the EGFP (area) axis is logarithmic. The percentage of single, viable cells with EGFP signal above background was greater than 98.5% for all cell lines analyzed. For each sample, 100,000 cells were analyzed on a FACSAria IIU SORP sorter (BD Biosciences) using the FACSDiva software (BD Biosciences) and the data was converted into contour plots with outliers using the FlowJo software (FlowJo). (b) Mitochondria isolated from HA-MITO cells have greater purity than mitochondria isolated from HA-MITO high cells and mitochondria isolated using an abbreviated form of differential centrifugation described previously. SDS-PAGE and immunoblotting were used to interrogate whole cells and mitochondria isolated via rapid differential centrifugation (DC) or an anti-HA-IP using HA-MITO or HA-MITO high cells. The name of the protein marker used appears to the left of each blot and the corresponding subcellular compartment appears on the right. Matrix, mitochondrial matrix; ER, endoplasmic reticulum; Golgi, Golgi complex. The dotted lines indicate where different lanes of the same membrane are brought together. These results are representative of three experiments. For this figure, HeLa cells were cultured in complete DMEM, authenticated by the Duke University DNA Analysis Facility, and tested for mycoplasma contamination.
Figure 3
Figure 3. Quantitative benchmarks for assessing reliability of data
(a) For cells cultured under a variety of conditions, the total abundance of GSH and GSSG in the HA-MITO IP increases proportionately with the amount of isolated mitochondria. The amount of mitochondria isolated in each IP is represented as whole-cell equivalents and is assessed using immunoblot analysis of citrate synthase, a protein that localizes predominantly to the mitochondrial matrix. HeLa cells were cultured in complete DMEM or DMEM without pyruvate and treated for 2 h with 100% DMSO (Vehicle) or 5 μM oligomycin as indicated. Each point is a biological replicate for its respective culture condition. (b) Measurements of matrix metabolites are highly consistent between experiments. HeLa cell matrix concentrations from two biological replicates were compared, and a Pearson correlation coefficient was calculated. Each dot represents a different mitochondrial metabolite. HeLa cells were cultured in complete DMEM. For all experiments in this figure, HeLa cells were authenticated by the Duke University DNA Analysis Facility, and tested for mycoplasma contamination. This figure was generated using the resource data made available through our prior work.

Similar articles

Cited by

References

    1. Wallace DC. A mitochondrial bioenergetic etiology of disease. The Journal of Clinical Investigation. 2013;123:1405–1412. doi: 10.1172/JCI61398. - DOI - PMC - PubMed
    1. Safer B. The Metabolic Significance of the Malate-Aspartate Cycle in Heart. Circulation Research. 1975;37:527–533. doi: 10.1161/01.res.37.5.527. - DOI - PubMed
    1. Chen Walter W, et al. Inhibition of ATPIF1 Ameliorates Severe Mitochondrial Respiratory Chain Dysfunction in Mammalian Cells. Cell Reports. 2014;7:27–34. doi: http://dx.doi.org/10.1016/j.celrep.2014.02.046. - DOI - PMC - PubMed
    1. Birsoy K, et al. An Essential Role of the Mitochondrial Electron Transport Chain in Cell Proliferation Is to Enable Aspartate Synthesis. Cell. 2015;162:540–551. doi: http://dx.doi.org/10.1016/j.cell.2015.07.016. - DOI - PMC - PubMed
    1. Sullivan Lucas B, et al. Supporting Aspartate Biosynthesis Is an Essential Function of Respiration in Proliferating Cells. Cell. 2015;162:552–563. doi: 10.1016/j.cell.2015.07.017. - DOI - PMC - PubMed

Publication types