. 2018 May;17(5):6441-6448.
doi: 10.3892/mmr.2018.8724. Epub 2018 Mar 9.

Atorvastatin prevents glomerular extracellular matrix formation by interfering with the PKC signaling pathway

Affiliations

Atorvastatin prevents glomerular extracellular matrix formation by interfering with the PKC signaling pathway

Yan-Hua Xiao et al. Mol Med Rep. 2018 May.

Abstract

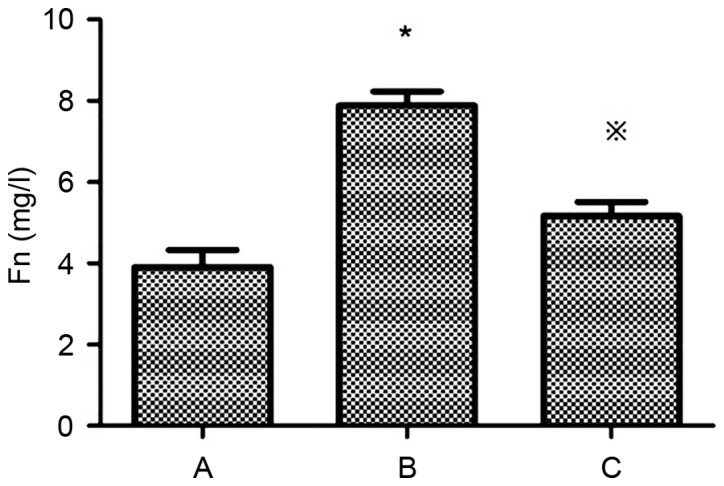
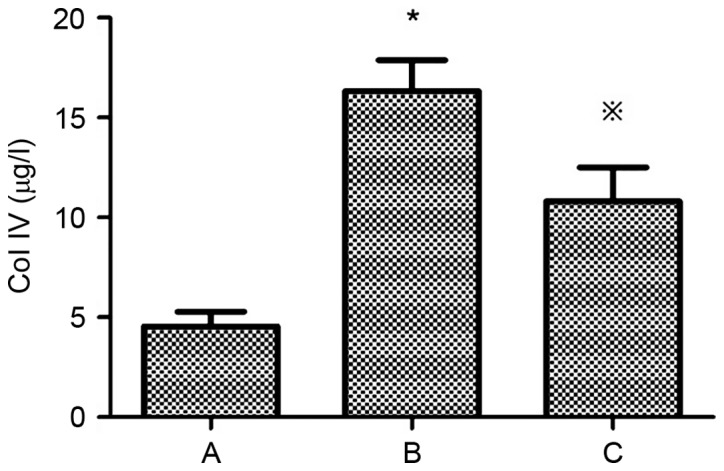
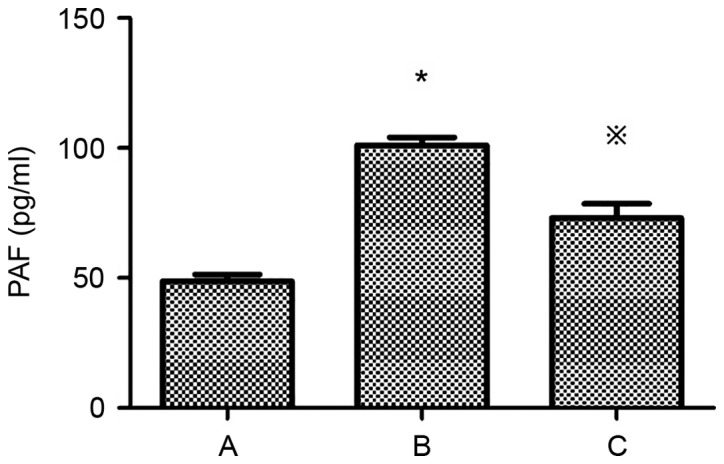
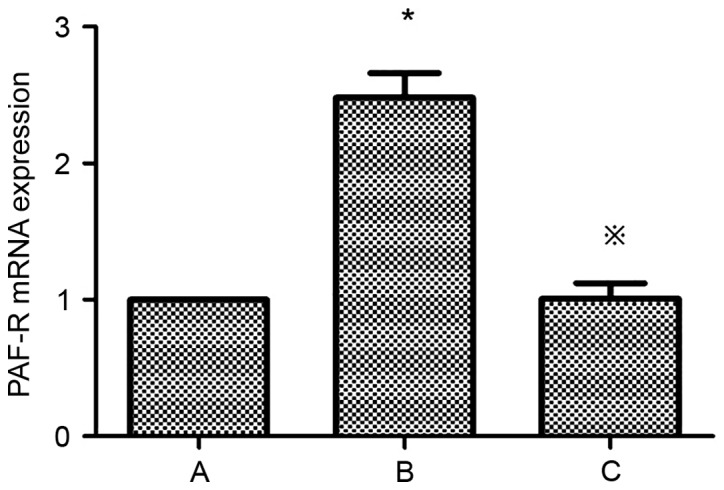
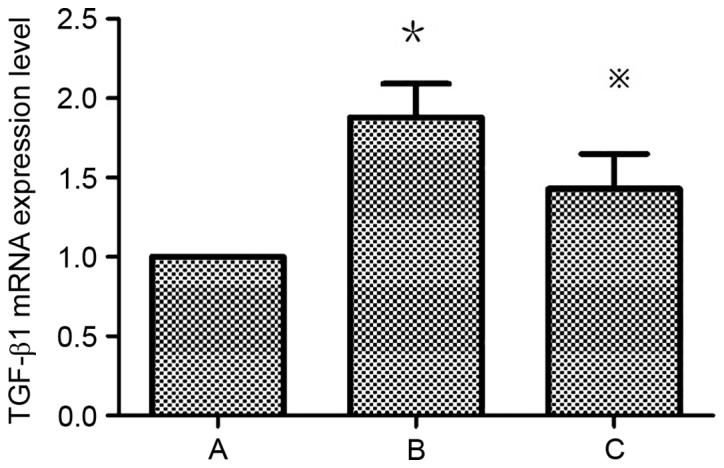
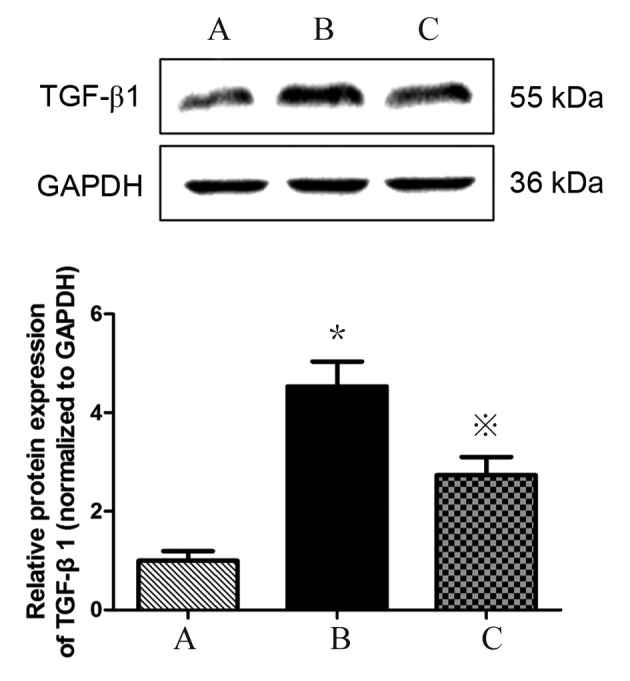
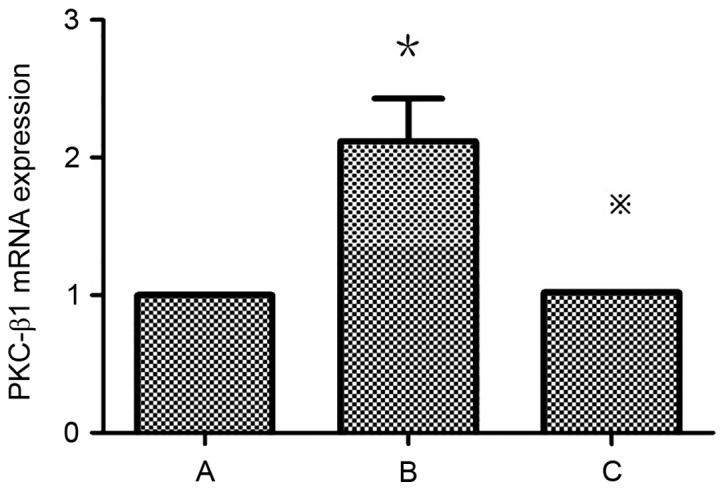
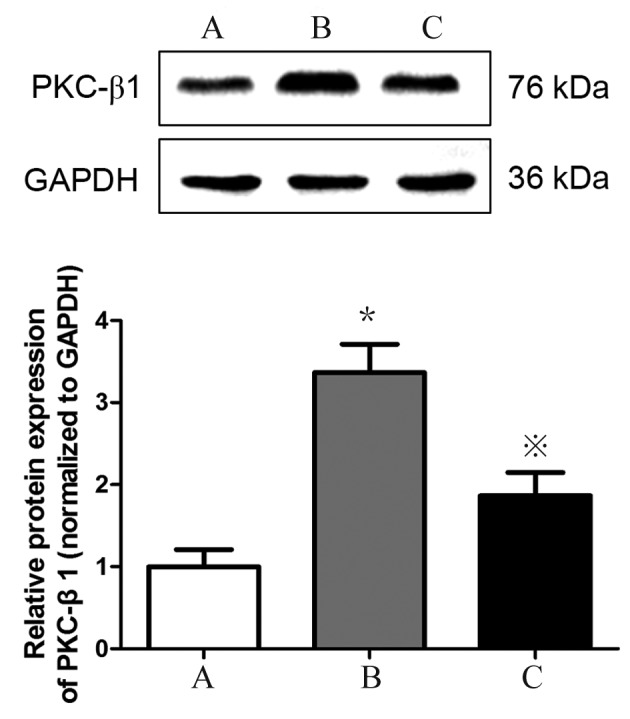
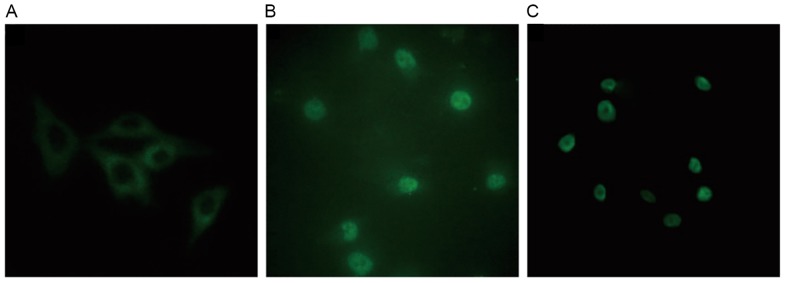
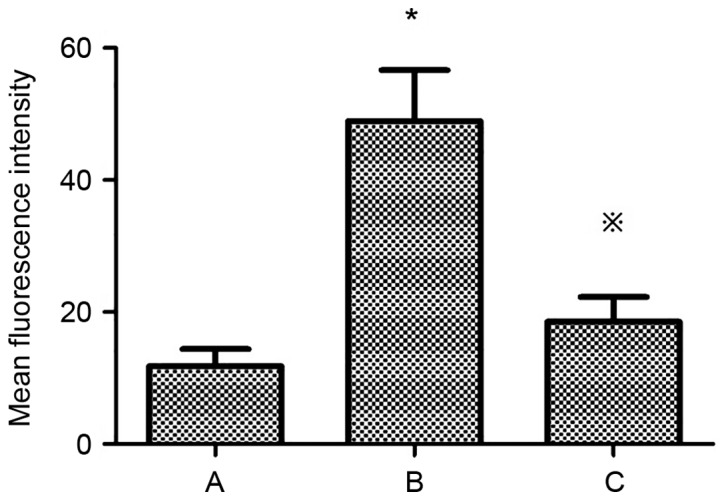
Platelet-activating factor (PAF) promotes glomerular extracellular matrix (ECM) deposition, primarily through activation of the protein kinase C (PKC) pathway. The present study was designed to investigate whether atorvastatin, which mediates a protective effect against glomerular ECM deposition and diabetic neuropathy, may interfere with the PKC‑transforming growth factor‑β1 (TGF‑β1) pathway in a model of human mesangial cells (HMCs) exposed to a high glucose (HG) and lysophosphatidylcholine (LPC) environment. HMCs were divided into three treatment groups: Control, high glucose and lysophosphatidylcholine (HG+LPC), and HG+LPC+atorvastatin. Cells were cultured for 24 h. The levels of the ECM‑associated molecules collagen IV (Col IV) and fibronectin (Fn) in the supernatant were detected using an ELISA kit. PKC‑β1, TGF‑β1 and PAF‑receptor gene expression was detected by reverse transcription‑quantitative polymerase chain reaction. PKC‑β1 and TGF‑β1 protein expression was detected by western blotting, and the subcellular localization of PKC‑β1 was assessed using immunofluorescence. The results indicated that atorvastatin may reduce the secretion of ECM components (Fn and Col IV) in HMCs in a HG and LPC environment, by inhibiting the increase in PAF secretion and the activation of the PKC‑TGF‑β1 signaling pathway.

Keywords: platelet-activating factor; high glucose and lysophosphatidylcholine; protein kinase C; extracellular matrix; atorvastatin.


Figures

Figure 1.
Figure 1.
Effects of atorvastatin on Fn (mg/l) in human mesangial cells. The level of Fn in each group was detected by ELISA. Group A, control (5.5 mmol/l D-glucose); Group B, HG+LPC group (30 mmol/l D-glucose+20 mg/l LPC); Group C, atorvastatin group (30 mmol/l D-glucose+20 mg/l LPC+10 µmol/l atorvastatin). Data represents the mean ± standard deviation of three independent experiments. *P<0.05 vs. group A; P<0.05 vs. group B. Fn, fibronectin; HG, high glucose; LPC, lysophosphatidylcholine.
Figure 2.
Figure 2.
Effects of atorvastatin on Col IV (µg/l) in human mesangial cells. The level of Col IV in each group was detected by ELISA. Group A, control (5.5 mmol/l D-glucose); Group B, HG+LPC group (30 mmol/l D-glucose+20 mg/l LPC); Group C, atorvastatin group (30 mmol/l D-glucose+20 mg/l LPC+10 µmol/l atorvastatin). Data represents the mean ± standard error of three independent experiments. *P<0.05 vs. group A; P<0.05 vs. group B. Col IV, collagen IV; HG, high glucose; LPC, lysophosphatidylcholine.
Figure 3.
Figure 3.
Effects of atorvastatin on PAF (pg/ml) in human mesangial cells. The level of PAF in each group was detected by ELISA. Group A, control (5.5 mmol/l D-glucose); Group B, HG+LPC group (30 mmol/l D-glucose+20 mg/l LPC); Group C, atorvastatin group (30 mmol/l D-glucose+20 mg/l LPC+10 µmol/l atorvastatin). Data represents the mean ± standard error of three independent experiments. *P<0.05 vs. group A; P<0.05 vs. group B. PAF, platelet-activating factor; HG, high glucose; LPC, lysophosphatidylcholine.
Figure 4.
Figure 4.
Effects of atorvastatin on PAF-R mRNA expression in HMCs. Detection of PAF-R gene expression in HMCs was detected by reverse transcription-quantitative polymerase chain reaction. Group A, control (5.5 mmol/l D-glucose); Group B, HG+LPC group (30 mmol/l D-glucose+20 mg/l LPC); Group C, atorvastatin group (30 mmol/l D-glucose+20 mg/l LPC+10 µmol/l atorvastatin). Data represents the mean ± standard error of three independent experiments.*P<0.05 vs. group A; P<0.05 vs. group B. PAF-R, platelet-activating factor-receptor; HMCs, human mesangial cells; HG, high glucose; LPC, lysophosphatidylcholine.
Figure 5.
Figure 5.
TGF-β1 mRNA expression in human mesangial cells under various treatment conditions. Expression levels were determined relative to that of GAPDH by reverse transcription-quantitative polymerase chain reaction. Group A, control (5.5 mmol/l D-glucose); Group B, HG+LPC group (30 mmol/l D-glucose+20 mg/l LPC); Group C, atorvastatin group (30 mmol/l D-glucose+20 mg/l LPC+10 µmol/l atorvastatin). Data represents the mean ± standard error of three independent experiments. *P<0.05 vs. group A; P<0.05 vs. group B. TGF-β1, transforming growth factor-β1; HG, high glucose; LPC, lysophosphatidylcholine.
Figure 6.
Figure 6.
TGF-β1 protein expression in human mesangial cells under various treatment conditions. Protein expression levels were determined by western blotting, with GAPDH used as a loading control. Group A, control; Group B, HG+LPC; Group C, HG+LPC+atorvastatin. Data represents the mean ± standard error of three independent experiments. *P<0.05 vs. group A, P<0.05 vs. group B. TGF-β1, transforming growth factor-β1; HG, high glucose; LPC, lysophosphatidylcholine.
Figure 7.
Figure 7.
PKC-β1 mRNA expression in human mesangial cells under various treatment conditions. Expression levels were determined relative to that of GAPDH by reverse transcription-quantitative polymerase chain reaction. Group A, control (5.5 mmol/l D-glucose; Group B, HG+LPC group (30 mmol/l D-glucose+20 mg/l LPC); Group C, atorvastatin group (30 mmol/l D-glucose+20 mg/l LPC+10 µmol/l atorvastatin. Data represents the mean ± standard error of three independent experiments. *P<0.05 vs. group A, P<0.05 vs. group B. PKC-β1, protein kinase C-β1; HG, high glucose; LPC, lysophosphatidylcholine.
Figure 8.
Figure 8.
PKC-β1 protein expression in human mesangial cells under various treatment conditions. Protein expression levels were determined by western blotting, with GAPDH used as a loading control. Group A, control; Group B, HG+LPC; Group C, HG+LPC+atorvastatin. Data represents the mean ± standard error of three independent experiments. *P<0.05 vs. group A, P<0.05 vs. group B. PKC-β1, protein kinase C-β1; HG, high glucose; LPC, lysophosphatidylcholine.
Figure 9.
Figure 9.
Immunocytofluorescent analysis of PKC-β1 localization in human mesangial cells under various treatment conditions. PKC-β1 was detected by immunocytofluorescence and visualized by confocal microscopy. Magnification, ×400. Group A, control; Group B, HG+LPC; Group C, HG+LPC+atorvastatin. PKC-β1, protein kinase C-β1; HG, high glucose; LPC, lysophosphatidylcholine.
Figure 10.
Figure 10.
Mean fluorescence intensity of PKC β1 in human mesangial cells under various treatment conditions. Group A, control (5.5 mmol/l D-glucose); Group B, HG+LPC group (30 mmol/l D-glucose+20 mg/l LPC); Group C, atorvastatin group (30 mmol/l D-glucose+20 mg/l LPC+10 µmol/l atorvastatin). Data represents the mean ± standard error of three independent experiments. *P<0.05 vs. group A, P<0.05 vs. group B. PKC-β1, protein kinase C-β1; HG, high glucose; LPC, lysophosphatidylcholine.

Similar articles

Cited by

References

    1. Shao Y, Lv C, Wu C, Zhou Y, Wang Q. Mir-217 promotes inflammation and fibrosis in high glucose cultured rat glomerular mesangial cells via Sirt1/HIF-1α signaling pathway. Diabetes Metab Res Rev. 2016;32:534–543. doi: 10.1002/dmrr.2788. - DOI - PubMed
    1. Chang ZL, Beezhold DH, Personius CD, Shen ZL. Fibronectin cell-binding domain triggered transmembrane signal transduction in human monocytes. J Leukoc Biol. 1993;53:79–85. doi: 10.1002/jlb.53.1.79. - DOI - PubMed
    1. Liu Y, Wang Z, Yin W, Li Q, Cai M, Zhang C, Xiao J, Hou H, Li H, Zu X. Severe insulin resistance and moderate glomerulosclerosis in a minipig model induced by high-fat/high-sucrose/high-cholesterol diet. Exp Anim. 2007;56:11–20. doi: 10.1538/expanim.56.11. - DOI - PubMed
    1. Yiu WH, Lin M, Tang SC. Toll-like receptor activation: From renal inflammation to fibrosis. Kidney Int Suppl (2011) 2014;4:20–25. doi: 10.1038/kisup.2014.5. - DOI - PMC - PubMed
    1. Fragopoulou E, Iatrou C, Antonopoulou S, Ruan XZ, Fernando RL, Powis SH, Moorhead JF, Varghese Z. Platelet-activating factor (PAF) increase intracellular lipid accumulation by increasing both LDL and scavenger receptors in human mesangial cells. J Lab Clin Med. 2006;147:281–289. doi: 10.1016/j.lab.2006.01.004. - DOI - PubMed

MeSH terms