. 2019 Jan;42(1):115-132.
doi: 10.1111/pce.13195. Epub 2018 Apr 15.

UPLC-HRMS-based untargeted metabolic profiling reveals changes in chickpea (Cicer arietinum) metabolome following long-term drought stress

Affiliations

UPLC-HRMS-based untargeted metabolic profiling reveals changes in chickpea (Cicer arietinum) metabolome following long-term drought stress

Naeem Khan et al. Plant Cell Environ. 2019 Jan.

Abstract

Genetic improvement for drought tolerance in chickpea requires a solid understanding of biochemical processes involved with different physiological mechanisms. The objective of this study is to demonstrate genetic variations in altered metabolic levels in chickpea varieties (tolerant and sensitive) grown under contrasting water regimes through ultrahigh-performance liquid chromatography/high-resolution mass spectrometry-based untargeted metabolomic profiling. Chickpea plants were exposed to drought stress at the 3-leaf stage for 25 days, and the leaves were harvested at 14 and 25 days after the imposition of drought stress. Stress produced significant reduction in chlorophyll content, Fv /Fm , relative water content, and shoot and root dry weight. Twenty known metabolites were identified as most important by 2 different methods including significant analysis of metabolites and partial least squares discriminant analysis. The most pronounced increase in accumulation due to drought stress was demonstrated for allantoin, l-proline, l-arginine, l-histidine, l-isoleucine, and tryptophan. Metabolites that showed a decreased level of accumulation under drought conditions were choline, phenylalanine, gamma-aminobutyric acid, alanine, phenylalanine, tyrosine, glucosamine, guanine, and aspartic acid. Aminoacyl-tRNA and plant secondary metabolite biosynthesis and amino acid metabolism or synthesis pathways were involved in producing genetic variation under drought conditions. Metabolic changes in light of drought conditions highlighted pools of metabolites that affect the metabolic and physiological adjustment in chickpea that reduced drought impacts.

Keywords: UPLC-HRMS analysis; drought; metabolic pathway; metabolites; water stress.


Conflict of interest statement

The authors declare no conflict of interest.

Figures
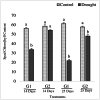
Figure 1
Figure 1
Chlorophyll content (±SE) in leaves of two chickpea varieties under drought and control conditions at 14 and 25 days after water treatment. G1: drought‐sensitive variety (Punjab Noor‐2009); G2: drought‐tolerant variety (93127). Error bars represent standard errors of the mean (n = 6) at each time point. Different letters indicate significant differences (P < .05) among treatments (drought vs. irrigation) for a genotype in a particular time point
Figure 2
Figure 2
Relative water content (±SE) of chickpea under drought versus control conditions. G1: drought‐sensitive variety (Punjab Noor‐2009); G2: drought‐tolerant variety (93127). Error bars represent standard errors of the mean (n = 6) at each time point. Different letters indicate significant differences (P < .05) among treatments (drought vs. irrigation) for a genotype in a particular time point
Figure 3
Figure 3
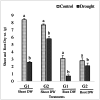
Shoot and root dry weights (±SE) of chickpea under drought versus control conditions after 25 days of drought stress imposition. G1: drought‐sensitive variety (Punjab Noor‐2009); G2: drought‐tolerant variety (93127). Error bars represent standard errors of the mean (n = 6). Different letters indicate significant differences (P < .05) among treatments (drought vs. irrigation) for a genotype
Figure 4
Figure 4
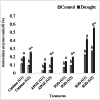
Antioxidant enzyme content (±SE) in the leaves of drought‐sensitive variety (G1) and drought‐tolerant variety (G2) after 25 days of drought treatment. Data are means of six replicates along with standard error bars. APOX = ascorbate peroxidase, POD = peroxidase, SOD = superoxide dismutase. Different letters indicate significant differences (P < .05) among treatments (drought vs. irrigation) for a variety. Asterisk represents significant difference between sensitive (G1) and tolerant (G2) varieties under the drought condition
Figure 5
Figure 5
Partial least square discriminant analysis and 2D scores loading plot for the Chickpea Punjab Noor‐2009 (G1) and 93127 (G2) under control (well‐watered) and drought treatments at two time points (14 and 25 days). Samples at control and drought treatments did not overlap with each other, indicating an altered state of metabolite levels in the chickpea leaves. G1, sensitive variety; G2, tolerant variety
Figure 6
Figure 6
Heat map illustrating levels of top metabolites in the leaves of two chickpea varieties according to the partial least square discriminant analysis variable importance in projection scores under control (well‐watered) and drought conditions at two time points (14 and 25 days). The heat map was generated using Pearson and Ward for distance measure and clustering algorithm, respectively. G1: drought‐sensitive chickpea variety (Punjab Noor‐2009); G2: drought‐tolerant chickpea variety (93127)
Figure 7
Figure 7
Significantly different levels of selected metabolites (anova, P ≤ .05, Tukey's honestly significant difference) in the leaves of two chickpea varieties under control and drought conditions at two time points (14 and 25 days). G1: drought‐sensitive chickpea variety (Punjab Noor‐2009); G2: drought‐tolerant chickpea variety (93127). Error bars represent standard errors of the mean (n = 6) at each time point. C = control, D = drought. Different letters indicate significant differences (P < .05) among treatments (drought vs. irrigation) for a genotype for mz/rt peak in a particular time point. Asterisk represents significant difference in mz/rt peak between sensitive (G1) and tolerant (G2) varieties under the drought condition at a specific time point of sampling

Similar articles

Cited by

References

    1. Ahmed, M. , & Fayyaz‐Ul‐Hassan (2015). Response of spring wheat (Triticum aestivum L.) quality traits and yield to sowing date. PLoS One, 10(4), e0126097. - PMC - PubMed
    1. Akhkha, A. , Tahar, B. , Hazem, K. , Parvaiz, A. , & Piotr, D. (2013). Chlorophyll fluorescence: A potential selection criterion for drought tolerance in selected durum wheat (Triticum durum Desf.) cultivars. SOAJ NanoPhotoBioSciences, 1, 147–156.
    1. Alia, S. P. P. , & Mohanty, P. (1997). Involvement of proline in protecting thylakoid membranes against free radical‐induced photodamage. Journal of Photochemistry and Photobiology B: Biology, 38, 253–257.
    1. Allakhverdiev, S. I. , & Murata, N. (2004). Environmental stress inhibits the synthesis de novo of proteins involved in the photodamage–repair cycle of photosystem II in Synechocystis sp.PCC6803. Biochimica et Biophysica Acta, Bioenergetics, 1657, 23–32. - PubMed
    1. Anjum, S. A. , Ashraf, U. , Tanveer, M. , Khan, I. , Hussain, S. , Shahzad, B. , … Wang, L. C. (2017). Drought induced changes in growth, osmolyte accumulation and antioxidant metabolism of three maize hybrids. Frontiers in Plant Science, 8(69), 1–12. - PMC - PubMed

Publication types