. 2018 Nov 2;9(6):559-566.
doi: 10.1080/19490976.2018.1448741. Epub 2018 May 9.

Bacterial growth, flow, and mixing shape human gut microbiota density and composition

Affiliations

Bacterial growth, flow, and mixing shape human gut microbiota density and composition

Markus Arnoldini et al. Gut Microbes. .

Abstract

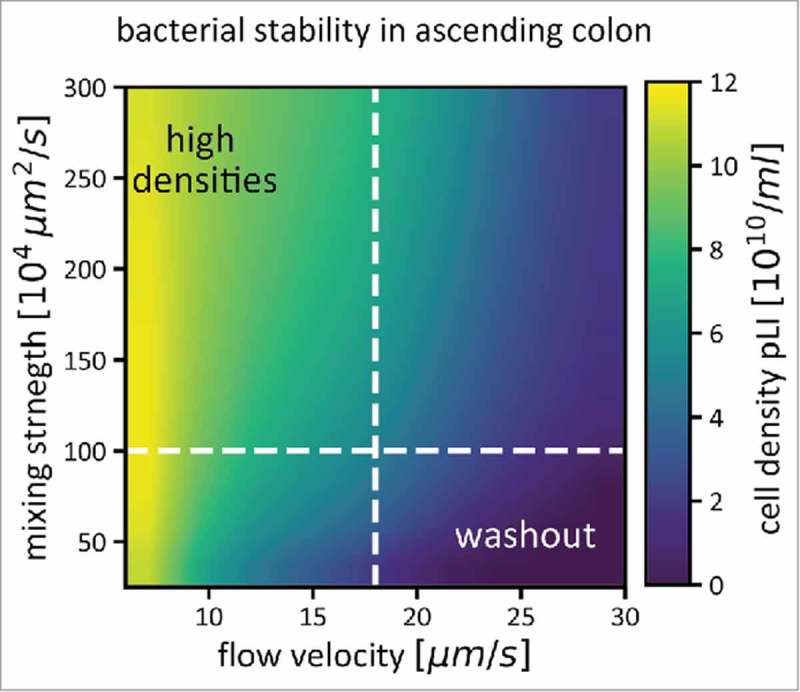
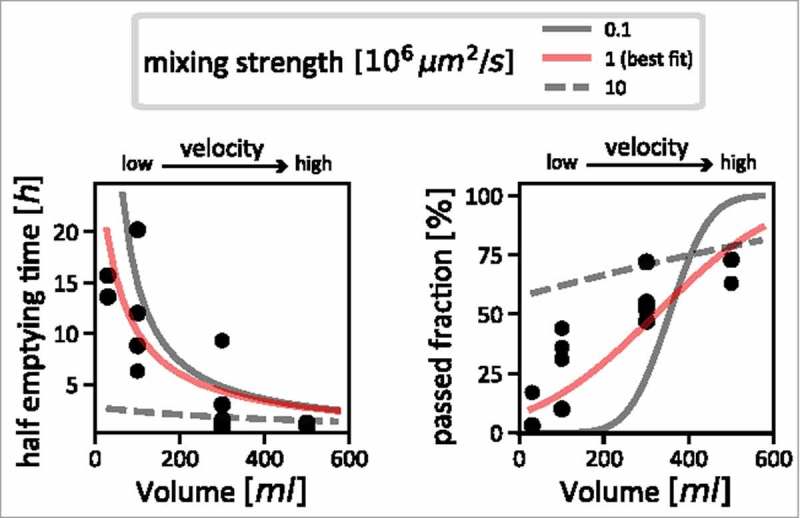
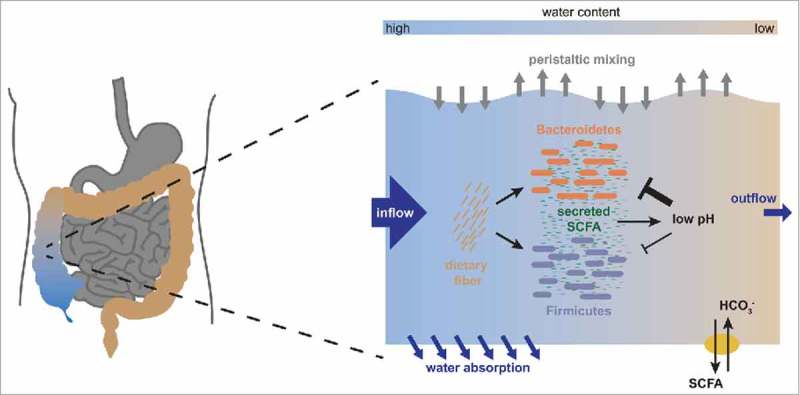
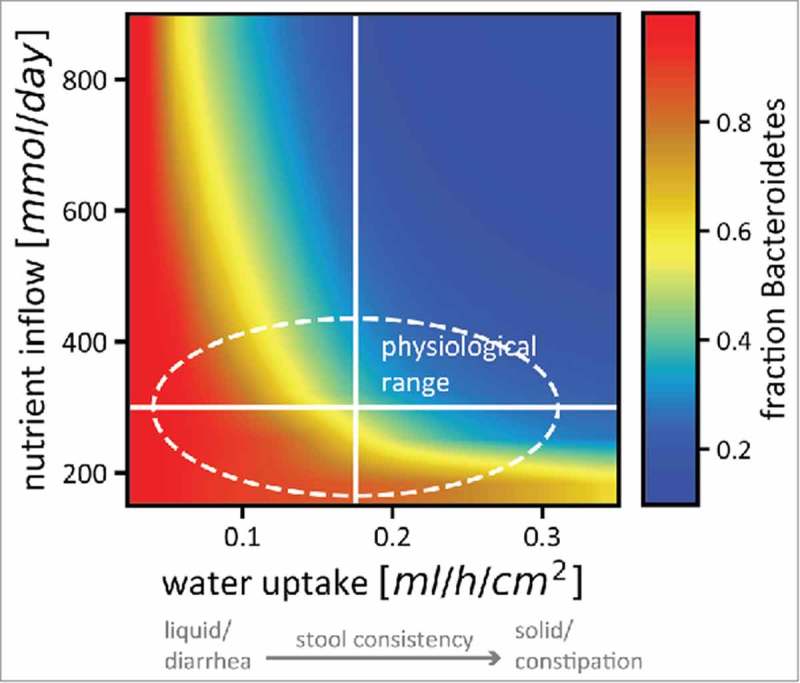
The human gut microbiota is highly dynamic, and host physiology and diet exert major influences on its composition. In our recent study, we integrated new quantitative measurements on bacterial growth physiology with a reanalysis of published data on human physiology to build a comprehensive modeling framework. This can generate predictions of how changes in different host factors influence microbiota composition. For instance, hydrodynamic forces in the colon, along with colonic water absorption that manifests as transit time, exert a major impact on microbiota density and composition. This can be mechanistically explained by their effect on colonic pH which directly affects microbiota competition for food. In this addendum, we describe the underlying analysis in more detail. In particular, we discuss the mixing dynamics of luminal content by wall contractions and its implications for bacterial growth and density, as well as the broader implications of our insights for the field of gut microbiota research.

Keywords: Bacteroidetes; Firmicutes; bacterial growth; colon physiology; colonic pH; human gut microbiota; stool consistency; water-uptake.


Figures

Figure 1.
Figure 1.
Bacterial density in the ascending colon (pLI) is determined by flow and mixing, in addition to bacterial growth. For a range of mixing strengths and flow velocities, average bacterial densities in the ascending colon are shown as a color gradient. If flow through the colon is fast, and mixing weak, the microbiota cannot reach high densities, as they are washed out quickly (bottom right corner of the plot). Both stronger mixing and slower flow rates help to increase microbiota densities. The dashed white lines indicate conditions that we assume to be prevalent in a healthy human colon (a mixing coefficient of 106 µm2/s, see Figure 2 for how this number was derived, and an average flow velocity of 17.5 µm/s). Simulations were performed as described in,17 Figure S2).
Figure 2.
Figure 2.
Estimating the strength of mixing in the colon. Measurements taken by Hammer and Phillips28 (black dots) are shown, together with simulation results with varying mixing strengths. We used the comparison between simulations and the measured data to estimate the actual strength of mixing in the human colon. The left panel shows the relation between inflow volume (flow velocity) and half-emptying time of content from the proximal colon; very strong mixing can be ruled out, as for slow flow velocities, it would lead to much lower half emptying times (dashed grey line) than are supported by the data (black dots). The right panel shows the relationship between inflow volume (flow velocity) with the fraction of particles that has passed the ascending colon after 4 hours. Using this data, we can rule out very weak mixing: with increasing flow velocity, one would observe a sharp jump from a regime where no particles have passed for low velocities to a regime where almost all particles have passed (solid grey line). This is also not supported by the data, which describes a much smoother dependence on flow velocity (black dots). Our best estimate for mixing strength that consolidates these two sets of data is shown as red curves in both panels.
Figure 3.
Figure 3.
The physiological architecture underlying the growth dependent pH feedback. We show a schematic representation of the interactions occurring in the ascending colon. As nutrients arrive from the small intestine along with fast water flow, both Bacteroidetes and Firmicutes start fermenting these nutrients and producing biomass. In this process, they produce acidic fermentation products (mainly short chain fatty acids, SCFA), which lower the local pH in the colon. This effect is counteracted by dedicated transporters in the epithelium which pump out SCFA in exchange for bicarbonate that acts as buffer, but this effect is increased by water absorption through the colonic epithelium, which concentrates the luminal content. Importantly, low pH affects growth of Bacteroidetes much more strongly than growth of Firmicutes, changing their relative competitive fitness. A change in pH will thus lead to a change in microbiota composition. Figure adapted from.17
Figure 4.
Figure 4.
Nutrient intake and stool consistency are sufficient to explain microbiota variation in healthy humans. The relative abundance of Bacteroidetes (color code) in a simplified microbiota consisting of 2 phyla changes drastically even for small changes in nutrient uptake and epithelial water absorption (which is related to stool consistency in a linear way). The solid white lines denote standard estimates for healthy humans as used in our model, the area inside the dashed line is the variation in nutrient intake and stool consistency considered healthy. Colors from red (almost only Bacteroidetes) to blue (almost no Bacteroidetes) are included in that area, indicating that small physiological changes that will not affect the perceived health status of the host can have strong effects on microbiota composition. The strong dependence of stool consistency on B/F ratios recapitulates recent observations.38,39 Figure adapted from.17

References

    1. Moore WE, Holdeman LV. Human fecal flora: the normal flora of 20 Japanese-Hawaiians. Appl Microbiol. 1974;27:961–79. PMID:4598229. - PMC - PubMed
    1. Holdeman LV, Cato EP, Moore W. Anaerobic Laboratory Manual. 1977;1–140.
    1. Holdeman LV, Good IJ, Moore WE. Human fecal flora: variation in bacterial composition within individuals and a possible effect of emotional stress. Appl Environ Microbiol. 1976;31:359–75. PMID:938032. - PMC - PubMed
    1. Macfarlane GT, Gibson GR. Carbohydrate Fermentation, Energy Transduction and Gas Metabolismin the Human Large Intestine In: Mackie R, White B, Isaacson RE, editors. Gastrointestinal Microbiology. Springer Science & Business Media; 1997. p. 269–318.
    1. Cummings JH. Dietary fibre. Br Med Bull. 1981;37:65–70. doi:10.1093/oxfordjournals.bmb.a071678. PMID:6266573. - DOI - PubMed