. 2018 Mar 13:7:e31023.
doi: 10.7554/eLife.31023.

NuRD and CAF-1-mediated silencing of the D4Z4 array is modulated by DUX4-induced MBD3L proteins

Affiliations

NuRD and CAF-1-mediated silencing of the D4Z4 array is modulated by DUX4-induced MBD3L proteins

Amy E Campbell et al. Elife. .

Abstract

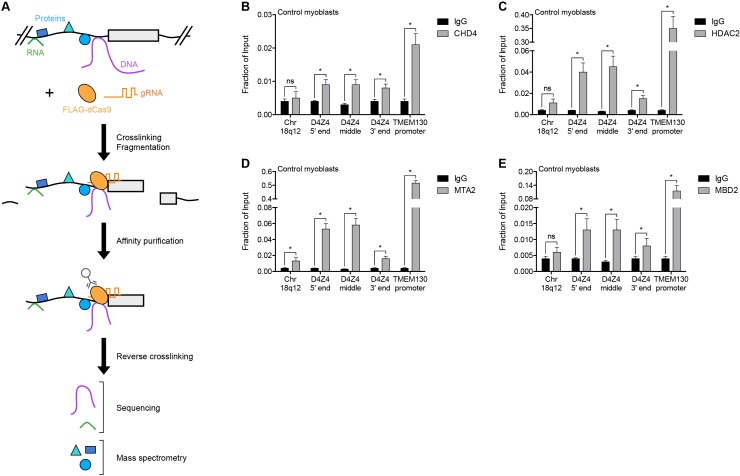
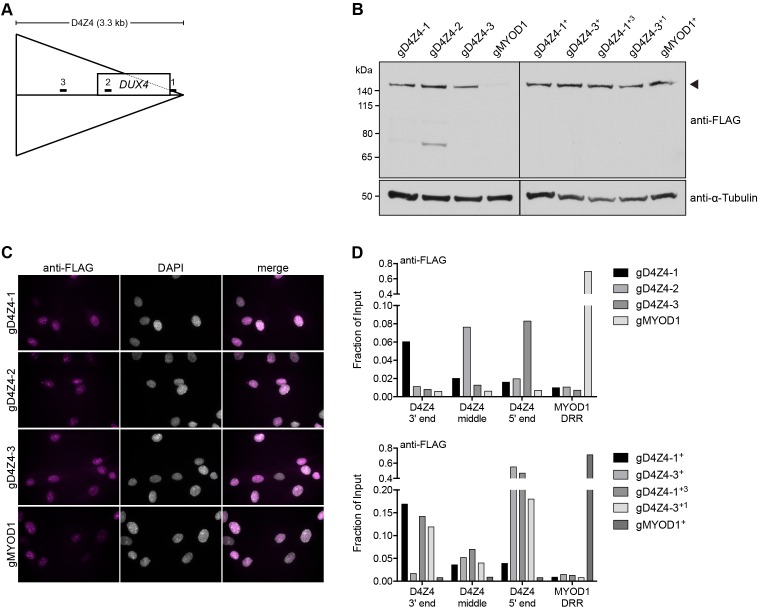
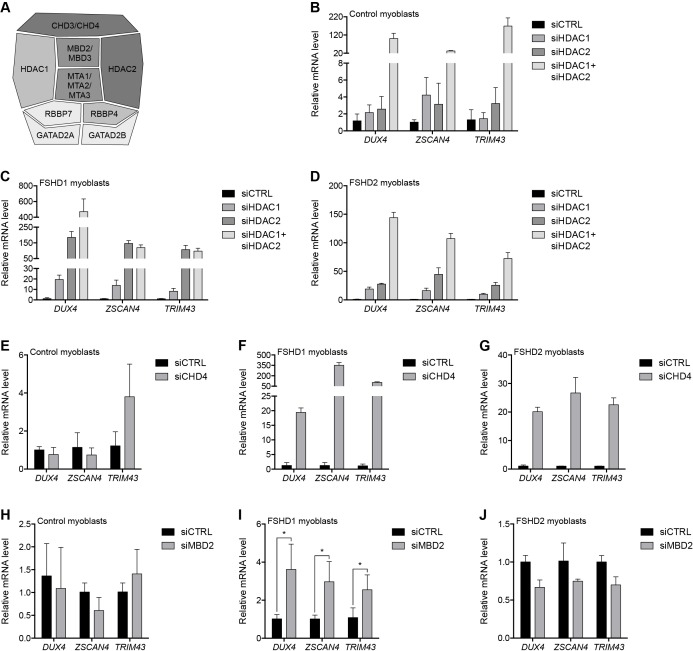
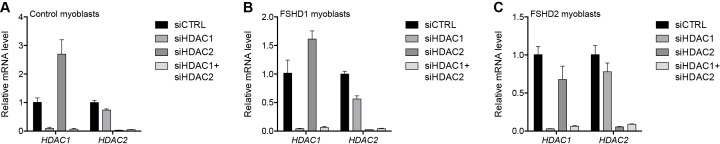
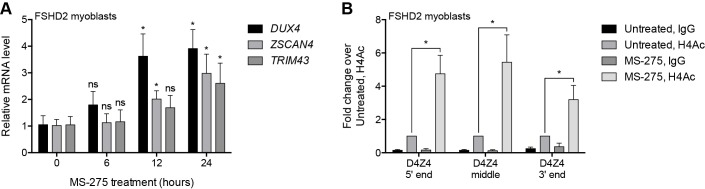
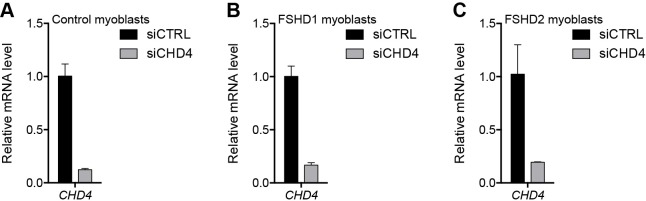
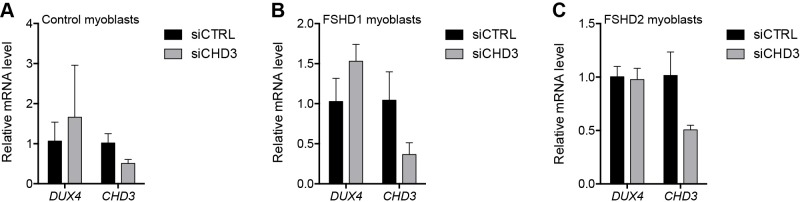
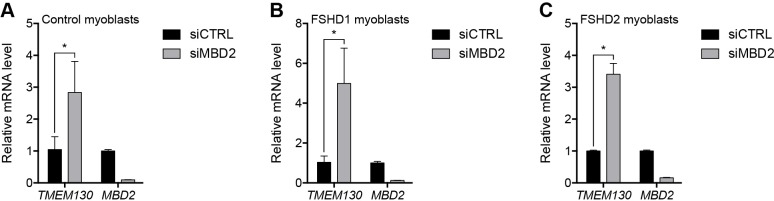
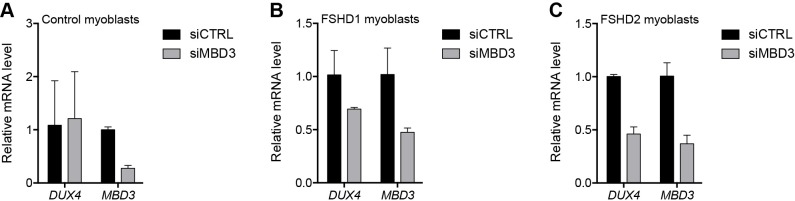
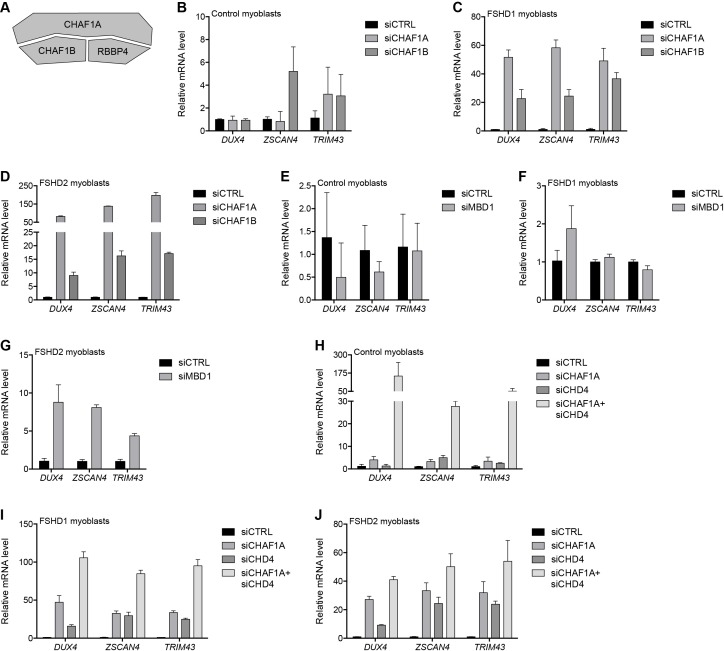
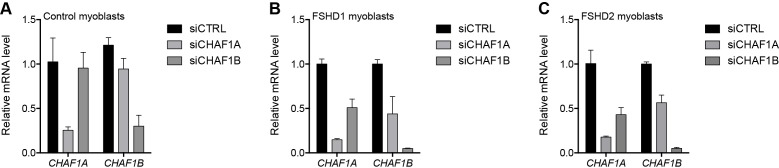
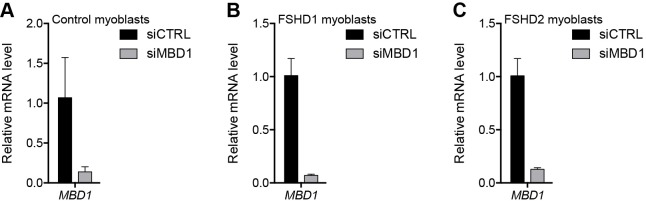
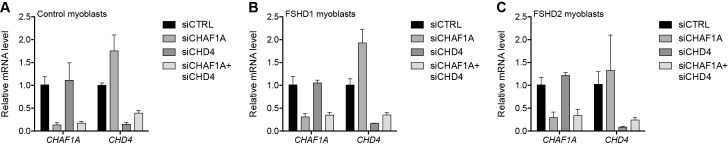
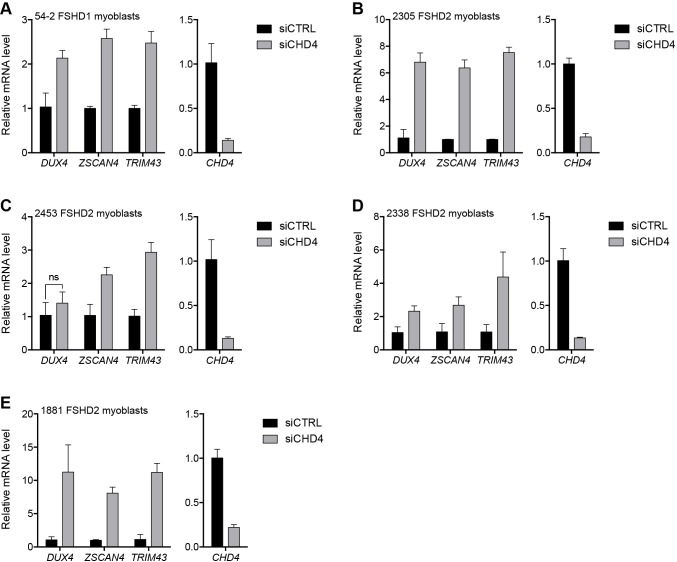
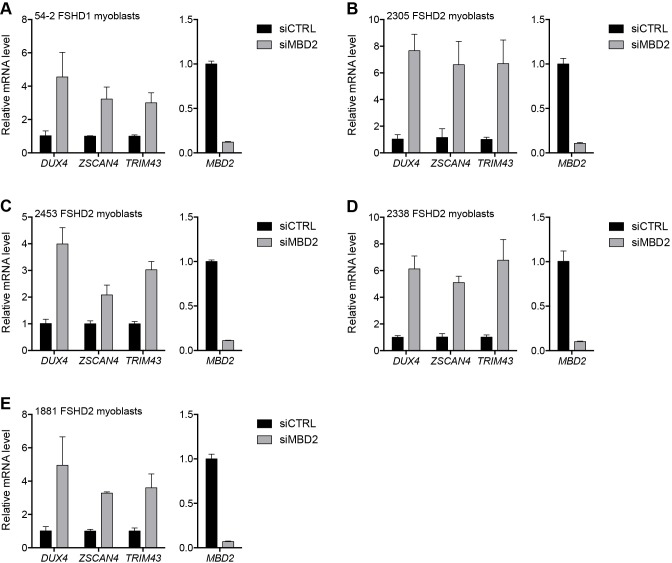
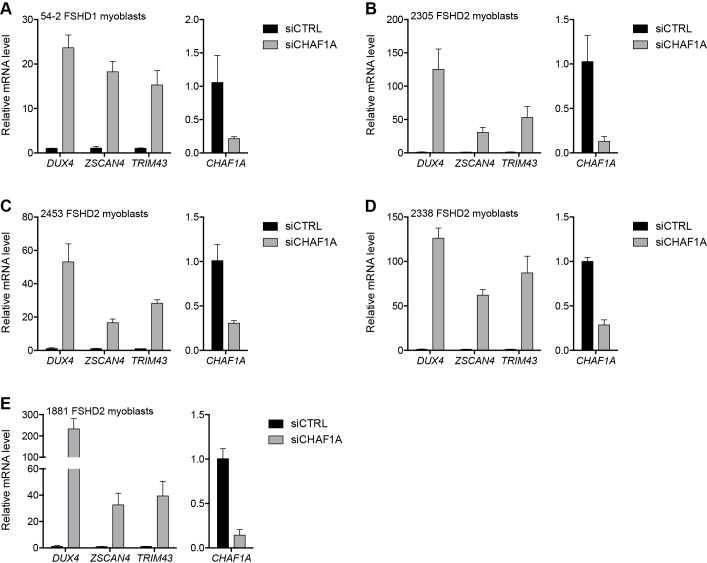
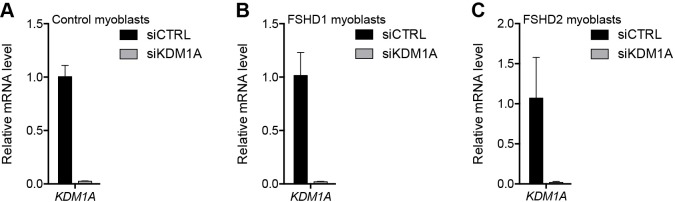
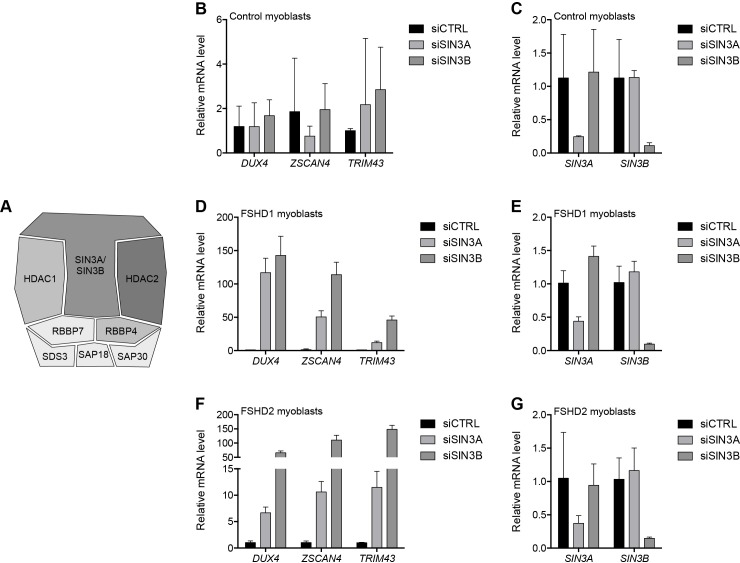
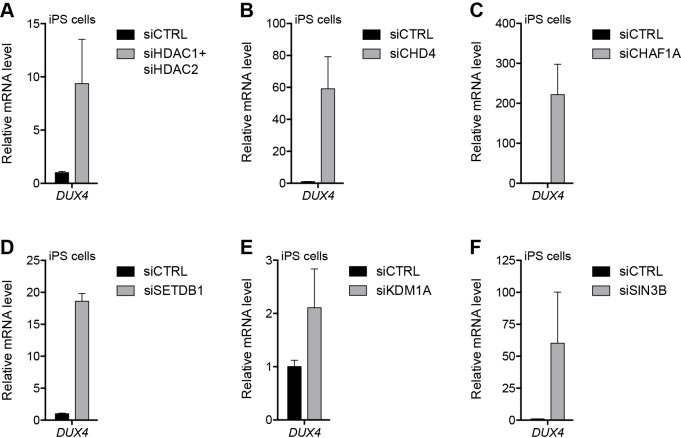
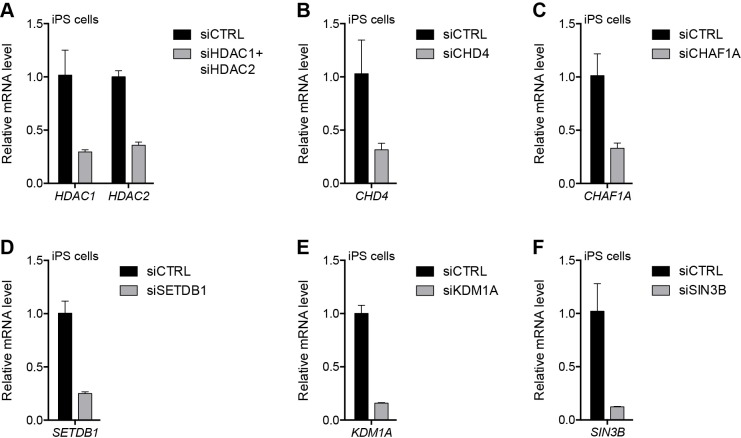
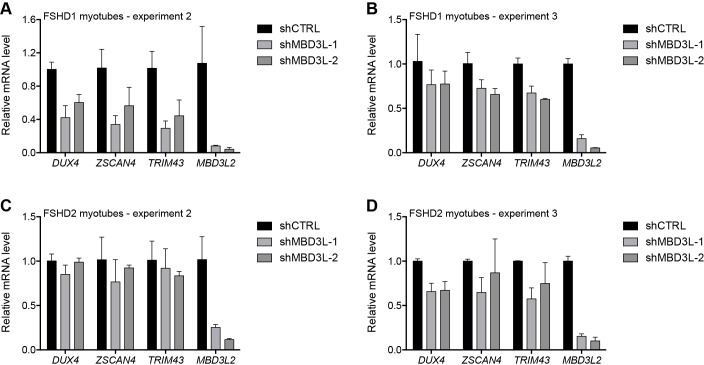
The DUX4 transcription factor is encoded by a retrogene embedded in each unit of the D4Z4 macrosatellite repeat. DUX4 is normally expressed in the cleavage-stage embryo, whereas chromatin repression prevents DUX4 expression in most somatic tissues. Failure of this repression causes facioscapulohumeral muscular dystrophy (FSHD) due to mis-expression of DUX4 in skeletal muscle. In this study, we used CRISPR/Cas9 engineered chromatin immunoprecipitation (enChIP) locus-specific proteomics to characterize D4Z4-associated proteins. These and other approaches identified the Nucleosome Remodeling Deacetylase (NuRD) and Chromatin Assembly Factor 1 (CAF-1) complexes as necessary for DUX4 repression in human skeletal muscle cells and induced pluripotent stem (iPS) cells. Furthermore, DUX4-induced expression of MBD3L proteins partly relieved this repression in FSHD muscle cells. Together, these findings identify NuRD and CAF-1 as mediators of DUX4 chromatin repression and suggest a mechanism for the amplification of DUX4 expression in FSHD muscle cells.

Keywords: CAF-1; D4Z4; DUX4; MBD3L; NuRD; chromosomes; facioscapulohumeral dystrophy; genes; human.


Conflict of interest statement

AC, SS, SJ, JL, RR, RT, Sv, ST No competing interests declared

Figures

Figure 1.
Figure 1.. NuRD complex components bind the D4Z4 macrosatellite repeat.
(A) Schematic summary of the enChIP procedure. A 3xFLAG-dCas9-HA-2xNLS fusion protein (FLAG-dCas9) consisting of an N-terminal triple FLAG (3xFLAG) epitope tag, catalytically inactive Cas9 endonuclease (dCas9), C-terminal human influenza hemagglutinin (HA) epitope tag and tandem nuclear localization signal (2xNLS) is expressed with one or more guide RNA (gRNA) in an appropriate cell context. Cells are crosslinked, chromatin is fragmented and complexes containing FLAG-dCas9 are immunoprecipitated with an anti-FLAG antibody. After reversing the crosslinks, molecules associated with the targeted genomic region are purified and identified by downstream analyses including mass spectrometry and next-generation sequencing. Adapted from Fujita et al. (2016). (B–E) ChIP-qPCR enrichment of NuRD complex components CHD4 (B), HDAC2 (C), MTA2 (D) and MBD2 (E) along the D4Z4 repeat in MB2401 control myoblasts. The Chr18q12 amplicon contains no CpG dinucleotides and serves as a negative control site, while the TMEM130 promoter is occupied by NuRD complex components in published ENCODE datasets (ENCODE Project Consortium, 2012) and functions as a positive control locus. Error bars denote the standard deviation from the mean of three biological replicates. Statistical significance was calculated by comparing the specific pulldown to the IgG control at each site using a two-tailed, two-sample Mann-Whitney U test. *, p≤0.05; ns, not significant, p>0.05. See also Figure 1—source data 1.
Figure 1—figure supplement 1.
Figure 1—figure supplement 1.. Validation of myoblast cell lines used for enChIP-MS.
(A) Diagram showing the location of the three gRNAs targeting the D4Z4 unit and their relationship to the DUX4 open-reading frame. 1, gD4Z4-1; 2, gD4Z4-2; 3, gD4Z4-3. (B–D) MB135 control myoblasts stably expressing FLAG-dCas9 together with gRNA targeting the D4Z4 repeat (gD4Z4-1, gD4Z4-2, gD4Z4-3) or the MYOD1 distal regulatory region (DRR) (gMYOD1) were examined for FLAG-dCas9 expression level by immunoblot (B), subcellular localization by immunofluorescence (C) and chromatin occupancy by enChIP-qPCR (D). A + indicates that existing cell lines were super-infected to enhance FLAG-dCas9 levels and/or to co-express two D4Z4 gRNAs. The arrowhead in (B) indicates the expected size of full-length FLAG-dCas9. See also Figure 1—source data 1.
Figure 2.
Figure 2.. The MBD2/NuRD complex represses the D4Z4 array.
(A) Schematic representation of the NuRD complex. Subunits colored darkest grey have the most lines of evidence linking them to DUX4 regulation (e.g. enChIP, siRNA and ChIP data), while more lightly colored subunits have progressively less experimental support. Adapted from Hota and Bruneau (2016). (B–J) DUX4 and DUX4 target gene expression as determined by RT-qPCR following control (CTRL), HDAC1/HDAC2 (B–D), CHD4 (E–G) or MBD2 (H–J) siRNA knockdown in MB2401 control (B,E,H), MB073 FSHD1 (C,F,I) or MB200 FSHD2 (D,G,J) myoblasts. Error bars denote the standard deviation from the mean of three biological replicates. Statistical significance was calculated by comparing the specific knockdown to the control knockdown for each gene using a two-tailed, two-sample Mann-Whitney U test. *, p≤0.05.See also Figure 2—source data 1.
Figure 2—figure supplement 1.
Figure 2—figure supplement 1.. Validation of HDAC1 and HDAC2 knockdown.
(A–C) HDAC1 and HDAC2 gene expression as determined by RT-qPCR following control (CTRL), HDAC1, HDAC2 or simultaneous HDAC1/HDAC2 siRNA knockdown in MB2401 control (A), MB073 FSHD1 (B) or MB200 FSHD2 (C) myoblasts. Error bars denote the standard deviation from the mean of three biological replicates. See also Figure 2—source data 1.
Figure 2—figure supplement 2.
Figure 2—figure supplement 2.. Pharmacological inhibition of HDAC1/HDAC2.
(A) DUX4 and DUX4 target gene expression as determined by RT-qPCR in MB200 FSHD2 myoblasts treated with 2.5 µM MS-275 for the indicated times. Statistical significance was calculated by comparing the mRNA level at each time point to that at 0 hr using a two-tailed, two-sample Mann-Whitney U test. (B) ChIP-qPCR enrichment of histone H4 acetylation (H4Ac) along the D4Z4 repeat in MB200 FSHD2 myoblasts treated with 2.5 µM MS-275 for 24 hr. Statistical significance was calculated by comparing the H4Ac signal in untreated versus MS-275-treated cells at each site using a one-tailed, one-sample Wilcoxon signed-rank test. *, p≤0.05; ns, not significant, p>0.05. Error bars denote the standard deviation from the mean of three (or six, for the 0 hr and 12 hr time points in (A)) biological replicates. See also Figure 2—source data 1.
Figure 2—figure supplement 3.
Figure 2—figure supplement 3.. Validation of CHD4 knockdown.
(A–C) CHD4 gene expression as determined by RT-qPCR following control (CTRL) or CHD4 siRNA knockdown in MB2401 control (A), MB073 FSHD1 (B) or MB200 FSHD2 (C) myoblasts. Error bars denote the standard deviation from the mean of three biological replicates. See also Figure 2—source data 1.
Figure 2—figure supplement 4.
Figure 2—figure supplement 4.. CHD3 depletion in control and FSHD myoblasts.
(A–C) DUX4 and CHD3 gene expression as determined by RT-qPCR following control (CTRL) or CHD3 siRNA knockdown in MB2401 control (A), MB073 FSHD1 (B) or MB200 FSHD2 (C) myoblasts. Error bars denote the standard deviation from the mean of three biological replicates. See also Figure 2—source data 1.
Figure 2—figure supplement 5.
Figure 2—figure supplement 5.. Validation of MBD2 knockdown.
(A–C) TMEM130 and MBD2 gene expression as determined by RT-qPCR following control (CTRL) or MBD2 siRNA knockdown in MB2401 control (A), MB073 FSHD1 (B) or MB200 FSHD2 (C) myoblasts. Error bars denote the standard deviation from the mean of three biological replicates. Statistical significance was calculated by comparing the specific knockdown to the control knockdown for each gene using a two-tailed, two-sample Mann-Whitney U test. *, p≤0.05. See also Figure 2—source data 1.
Figure 2—figure supplement 6.
Figure 2—figure supplement 6.. MBD3 depletion in control and FSHD myoblasts.
(A–C) DUX4 and MBD3 gene expression as determined by RT-qPCR following control (CTRL) or MBD3 siRNA knockdown in MB2401 control (A), MB073 FSHD1 (B) or MB200 FSHD2 (C) myoblasts. Error bars denote the standard deviation from the mean of three biological replicates. See also Figure 2—source data 1.
Figure 3.
Figure 3.. MBD1/CAF-1 components repress the D4Z4 array.
(A) Schematic representation of the CAF-1 complex, with shading as in Figure 2A. All subunits have one line of evidence linking them to DUX4 regulation. (B–J) DUX4 and DUX4 target gene expression as determined by RT-qPCR following control (CTRL), CHAF1A/CHAF1B (B–D), MBD1 (E–G) or CHAF1A/CHD4 (H–J) siRNA knockdown in MB2401 control (B,E,H), MB073 FSHD1 (C,F,I) or MB200 FSHD2 (D,G,J) myoblasts. Error bars denote the standard deviation from the mean of three biological replicates. See also Figure 3—source data 1.
Figure 3—figure supplement 1.
Figure 3—figure supplement 1.. Validation of CHAFA1 and CHAF1B knockdown.
(A–C) CHAF1A and CHAF1B gene expression as determined by RT-qPCR following control (CTRL), CHAF1A or CHAF1B siRNA knockdown in MB2401 control (A), MB073 FSHD1 (B) or MB200 FSHD2 (C) myoblasts. Error bars denote the standard deviation from the mean of three biological replicates. See also Figure 3—source data 1.
Figure 3—figure supplement 2.
Figure 3—figure supplement 2.. Validation of MBD1 knockdown.
(A–C) MBD1 gene expression as determined by RT-qPCR following control (CTRL) or MBD1 siRNA knockdown in MB2401 control (A), MB073 FSHD1 (B) or MB200 FSHD2 (C) myoblasts. Error bars denote the standard deviation from the mean of three biological replicates. See also Figure 3—source data 1.
Figure 3—figure supplement 3.
Figure 3—figure supplement 3.. Validation of CHAFA1 and CHD4 knockdown.
(A–C) CHAF1A and CHD4 gene expression as determined by RT-qPCR following control (CTRL), CHAF1A, CHD4 or simultaneous CHAF1A/CHD4 siRNA knockdown in MB2401 control (A), MB073 FSHD1 (B) or MB200 FSHD2 (C) myoblasts. Error bars denote the standard deviation from the mean of three biological replicates. See also Figure 3—source data 1.
Figure 3—figure supplement 4.
Figure 3—figure supplement 4.. CHD4 depletion in additional FSHD cell lines.
(A–E) CHD4, DUX4, and DUX4 target gene expression as determined by RT-qPCR following control (CTRL) or CHD4 siRNA knockdown in 54–2 FSHD1 (A), 2305 FSHD2 (B), 2453 FSHD2 (C), 2338 FSHD2 (D) or 1881 FSHD2 (E) myoblasts. Error bars denote the standard deviation from the mean of three biological replicates. Statistical significance was calculated by comparing the specific knockdown to the control knockdown for each gene using a two-tailed, two-sample Mann-Whitney U test and p was ≤0.05 unless otherwise specified as not significant (ns). See also Figure 3—source data 1.
Figure 3—figure supplement 5.
Figure 3—figure supplement 5.. MBD2 depletion in additional FSHD cell lines.
(A–E) MBD2, DUX4, and DUX4 target gene expression as determined by RT-qPCR following control (CTRL) or MBD2 siRNA knockdown in 54–2 FSHD1 (A), 2305 FSHD2 (B), 2453 FSHD2 (C), 2338 FSHD2 (D) or 1881 FSHD2 (E) myoblasts. Error bars denote the standard deviation from the mean of three biological replicates. Statistical significance was calculated by comparing the specific knockdown to the control knockdown for each gene using a two-tailed, two-sample Mann-Whitney U test and p was ≤0.05 unless otherwise specified as not significant (ns). See also Figure 3—source data 1.
Figure 3—figure supplement 6.
Figure 3—figure supplement 6.. CHAF1A depletion in additional FSHD cell lines.
(A–E) CHAF1A, DUX4, and DUX4 target gene expression as determined by RT-qPCR following control (CTRL) or CHAF1A siRNA knockdown in 54–2 FSHD1 (A), 2305 FSHD2 (B), 2453 FSHD2 (C), 2338 FSHD2 (D) or 1881 FSHD2 (E) myoblasts. Error bars denote the standard deviation from the mean of three biological replicates. Statistical significance was calculated by comparing the specific knockdown to the control knockdown for each gene using a two-tailed, two-sample Mann-Whitney U test and p was ≤0.05 unless otherwise specified as not significant (ns). See also Figure 3—source data 1.
Figure 3—figure supplement 7.
Figure 3—figure supplement 7.. MBD1 depletion in additional FSHD cell lines.
(A–E) MBD1, DUX4, and DUX4 target gene expression as determined by RT-qPCR following control (CTRL) or MBD1 siRNA knockdown in 54–2 FSHD1 (A), 2305 FSHD2 (B), 2453 FSHD2 (C), 2338 FSHD2 (D) or 1881 FSHD2 (E) myoblasts. Error bars denote the standard deviation from the mean of three biological replicates. Statistical significance was calculated by comparing the specific knockdown to the control knockdown for each gene using a two-tailed, two-sample Mann-Whitney U test and p was ≤0.05 unless otherwise specified as not significant (ns). See also Figure 3—source data 1.
Figure 4.
Figure 4.. Additional transcriptional repressors silence the D4Z4 repeat.
(A–I) DUX4 and DUX4 target gene expression as determined by RT-qPCR following control (CTRL), TRIM28 (A–C), SETDB1 (D–F) or KDM1A (G–I) siRNA knockdown in MB2401 control (A,D,G), MB073 FSHD1 (B,E,H) or MB200 FSHD2 (C,F,I) myoblasts. Error bars denote the standard deviation from the mean of three biological replicates. Statistical significance was calculated by comparing the specific knockdown to the control knockdown for each gene using a two-tailed, two-sample Mann-Whitney U test and p was ≤0.05 for all comparisons except those in (A) and (D). See also Figure 4—source data 1.
Figure 4—figure supplement 1.
Figure 4—figure supplement 1.. Validation of TRIM28 knockdown.
(A–C) TRIM28 gene expression as determined by RT-qPCR following control (CTRL) or TRIM28 siRNA knockdown in MB2401 control (A), MB073 FSHD1 (B) or MB200 FSHD2 (C) myoblasts. Error bars denote the standard deviation from the mean of three biological replicates. See also Figure 4—source data 1.
Figure 4—figure supplement 2.
Figure 4—figure supplement 2.. Validation of SETDB1 knockdown.
(A–C) SETDB1 gene expression as determined by RT-qPCR following control (CTRL) or SETDB1 siRNA knockdown in MB2401 control (A), MB073 FSHD1 (B) or MB200 FSHD2 (C) myoblasts. Error bars denote the standard deviation from the mean of three biological replicates. See also Figure 4—source data 1.
Figure 4—figure supplement 3.
Figure 4—figure supplement 3.. Validation of KDM1A knockdown.
(A–C) KDM1A gene expression as determined by RT-qPCR following control (CTRL) or KDM1A siRNA knockdown in MB2401 control (A), MB073 FSHD1 (B) or MB200 FSHD2 (C) myoblasts. Error bars denote the standard deviation from the mean of three biological replicates. See also Figure 4—source data 1.
Figure 4—figure supplement 4.
Figure 4—figure supplement 4.. SIN3A/SIN3B knockdown.
(A) Schematic representation of the SIN3 complex, with shading as in Figure 2A depicting the amount of experimental support linking each subunit to DUX4 regulation. (B–G) SIN3A, SIN3B, DUX4, and DUX4 target gene expression as determined by RT-qPCR following control (CTRL), SIN3A or SIN3B siRNA knockdown in MB2401 control (B–C), MB073 FSHD1 (D–E) or MB200 FSHD2 (F–G) myoblasts. Error bars denote the standard deviation from the mean of three biological replicates. See also Figure 4—source data 1.
Figure 5.
Figure 5.. NuRD and CAF-1 complex components repress DUX4 in iPS cells.
(A–F) DUX4 gene expression as determined by RT-qPCR in human eMHF2 iPS cells following control (CTRL), HDAC1/HDAC2 (A), CHD4 (B), CHAF1A (C), SETDB1 (D), KDM1A (E) or SIN3B (F) siRNA knockdown. Error bars denote the standard deviation from the mean of three biological replicates. Statistical significance was calculated by comparing the specific knockdown to the control knockdown for each gene using a two-tailed, two-sample Mann-Whitney U test and p was ≤0.05 unless otherwise specified as not significant (ns). See also Figure 5—source data 1.
Figure 5—figure supplement 1.
Figure 5—figure supplement 1.. Validation of repressor protein knockdowns in eMHF2 iPS cells.
(A–F) Gene expression as determined by RT-qPCR in human eMHF2 iPS cells following control (CTRL), HDAC1/HDAC2 (A), CHD4 (B), CHAF1A (C), SETDB1 (D), KDM1A (E) or SIN3B (F) siRNA knockdown. Error bars denote the standard deviation from the mean of three biological replicates. See also Figure 5—source data 1.
Figure 5—figure supplement 2.
Figure 5—figure supplement 2.. Validation of HFF3 iPS cell generation.
(A–E) Gene expression as determined by RT-qPCR in HFF3 fibroblasts (FB), three isogenic iPS cell lines generated by reprogramming the fibroblast line, and embryoid bodies (EB) derived from the iPS cells. OCT4 (A) is a pluripotency gene, while NCAM1 (B), KDR (C), AFP (D), and CDX2 (E) are highly expressed in ectoderm, mesoderm, endoderm, and trophoblast, respectively. See also Figure 5—source data 1.
Figure 5—figure supplement 3.
Figure 5—figure supplement 3.. NuRD and CAF-1 knockdown in HFF3 fibroblasts and iPS cells.
(A–D) Gene expression as determined by RT-qPCR following control (CTRL), CHD4 (A–B) or CHAF1A (C–D) siRNA knockdown in human HFF3 fibroblasts (FB) and three isogenic iPS cell lines generated by reprogramming the fibroblast line. DUX4 data were generated with 4qAL primers (see Materials and methods). Error bars denote the standard deviation from the mean of three biological replicates. See also Figure 5—source data 1.
Figure 6.
Figure 6.. MBD3L2 expression de-represses the D4Z4 array.
(A–C) DUX4 and DUX4 target gene expression as determined by RT-qPCR in MB2401 control (A), MB073 FSHD1 (B) or MB200 FSHD2 (C) myoblasts without (-) or with (+) doxycycline (Dox) treatment for 48 hr to induce MBD3L2 transgene expression in clonal cell lines. (D–E) DUX4-positive nuclei upon overexpression of MBD3L2 in MB200 FSHD2 myoblasts as in (C) were detected by immunofluorescence (D) and quantified by counting three fields representing >125 nuclei (E). (F–G) DUX4 and DUX4 target gene expression as determined by RT-qPCR following control (CTRL) or MBD3L family gene shRNA knockdown in MB073 FSHD1 (F) or MB200 FSHD2 (G) myotubes. Error bars denote the standard deviation from the mean of three biological replicates. Statistical significance was calculated by comparing the specific knockdown to the control knockdown for each gene using a two-tailed, two-sample Mann-Whitney U test and p was ≤0.05 for all comparisons except in (A). See also Figure 6—source data 1.
Figure 6—figure supplement 1.
Figure 6—figure supplement 1.. Validation of MBD3L2 overexpression and depletion.
(A–E) The ectopic (A–C) or endogenous (D–E) expression of MBD3L2 as determined by RT-qPCR in MB2401 control (A), MB073 FSHD1 (B) or MB200 FSHD2 (C) myoblasts cultured without (-) or with (+) doxycycline (Dox) for 48 hr, or in MB073 FSHD1 (D) or MB200 FSHD2 (E) myotubes expressing control (CTRL) or MBD3L gene shRNAs. Error bars denote the standard deviation from the mean of three biological replicates. See also Figure 6—source data 1.
Figure 6—figure supplement 2.
Figure 6—figure supplement 2.. Additional MBD3L knockdown experiments.
(A–D) MBD3L2, DUX4, and DUX4 target gene expression as determined by RT-qPCR in two additional independent experiments with control (CTRL) or MBD3L shRNA-expressing MB073 FSHD1 (A–B) or MB200 FSHD2 (C–D) muscle cell lines differentiated into myotubes. Error bars denote the standard deviation from the mean of three biological replicates. See also Figure 6—source data 1.

References

    1. Balog J, Thijssen PE, Shadle S, Straasheijm KR, van der Vliet PJ, Krom YD, van den Boogaard ML, de Jong A, F Lemmers RJ, Tawil R, Tapscott SJ, van der Maarel SM. Increased DUX4 expression during muscle differentiation correlates with decreased SMCHD1 protein levels at D4Z4. Epigenetics. 2015;10:1133–1142. doi: 10.1080/15592294.2015.1113798. - DOI - PMC - PubMed
    1. Basta J, Rauchman M. The nucleosome remodeling and deacetylase complex in development and disease. Translational Research. 2015;165:36–47. doi: 10.1016/j.trsl.2014.05.003. - DOI - PMC - PubMed
    1. Baubec T, Ivánek R, Lienert F, Schübeler D. Methylation-dependent and -independent genomic targeting principles of the MBD protein family. Cell. 2013;153:480–492. doi: 10.1016/j.cell.2013.03.011. - DOI - PubMed
    1. Birney E, Stamatoyannopoulos JA, Dutta A, Guigó R, Gingeras TR, Margulies EH, Weng Z, Snyder M, Dermitzakis ET, Thurman RE, Kuehn MS, Taylor CM, Neph S, Koch CM, Asthana S, Malhotra A, Adzhubei I, Greenbaum JA, Andrews RM, Flicek P, Boyle PJ, Cao H, Carter NP, Clelland GK, Davis S, Day N, Dhami P, Dillon SC, Dorschner MO, Fiegler H, Giresi PG, Goldy J, Hawrylycz M, Haydock A, Humbert R, James KD, Johnson BE, Johnson EM, Frum TT, Rosenzweig ER, Karnani N, Lee K, Lefebvre GC, Navas PA, Neri F, Parker SC, Sabo PJ, Sandstrom R, Shafer A, Vetrie D, Weaver M, Wilcox S, Yu M, Collins FS, Dekker J, Lieb JD, Tullius TD, Crawford GE, Sunyaev S, Noble WS, Dunham I, Denoeud F, Reymond A, Kapranov P, Rozowsky J, Zheng D, Castelo R, Frankish A, Harrow J, Ghosh S, Sandelin A, Hofacker IL, Baertsch R, Keefe D, Dike S, Cheng J, Hirsch HA, Sekinger EA, Lagarde J, Abril JF, Shahab A, Flamm C, Fried C, Hackermüller J, Hertel J, Lindemeyer M, Missal K, Tanzer A, Washietl S, Korbel J, Emanuelsson O, Pedersen JS, Holroyd N, Taylor R, Swarbreck D, Matthews N, Dickson MC, Thomas DJ, Weirauch MT, Gilbert J, Drenkow J, Bell I, Zhao X, Srinivasan KG, Sung WK, Ooi HS, Chiu KP, Foissac S, Alioto T, Brent M, Pachter L, Tress ML, Valencia A, Choo SW, Choo CY, Ucla C, Manzano C, Wyss C, Cheung E, Clark TG, Brown JB, Ganesh M, Patel S, Tammana H, Chrast J, Henrichsen CN, Kai C, Kawai J, Nagalakshmi U, Wu J, Lian Z, Lian J, Newburger P, Zhang X, Bickel P, Mattick JS, Carninci P, Hayashizaki Y, Weissman S, Hubbard T, Myers RM, Rogers J, Stadler PF, Lowe TM, Wei CL, Ruan Y, Struhl K, Gerstein M, Antonarakis SE, Fu Y, Green ED, Karaöz U, Siepel A, Taylor J, Liefer LA, Wetterstrand KA, Good PJ, Feingold EA, Guyer MS, Cooper GM, Asimenos G, Dewey CN, Hou M, Nikolaev S, Montoya-Burgos JI, Löytynoja A, Whelan S, Pardi F, Massingham T, Huang H, Zhang NR, Holmes I, Mullikin JC, Ureta-Vidal A, Paten B, Seringhaus M, Church D, Rosenbloom K, Kent WJ, Stone EA, Batzoglou S, Goldman N, Hardison RC, Haussler D, Miller W, Sidow A, Trinklein ND, Zhang ZD, Barrera L, Stuart R, King DC, Ameur A, Enroth S, Bieda MC, Kim J, Bhinge AA, Jiang N, Liu J, Yao F, Vega VB, Lee CW, Ng P, Shahab A, Yang A, Moqtaderi Z, Zhu Z, Xu X, Squazzo S, Oberley MJ, Inman D, Singer MA, Richmond TA, Munn KJ, Rada-Iglesias A, Wallerman O, Komorowski J, Fowler JC, Couttet P, Bruce AW, Dovey OM, Ellis PD, Langford CF, Nix DA, Euskirchen G, Hartman S, Urban AE, Kraus P, Van Calcar S, Heintzman N, Kim TH, Wang K, Qu C, Hon G, Luna R, Glass CK, Rosenfeld MG, Aldred SF, Cooper SJ, Halees A, Lin JM, Shulha HP, Zhang X, Xu M, Haidar JN, Yu Y, Ruan Y, Iyer VR, Green RD, Wadelius C, Farnham PJ, Ren B, Harte RA, Hinrichs AS, Trumbower H, Clawson H, Hillman-Jackson J, Zweig AS, Smith K, Thakkapallayil A, Barber G, Kuhn RM, Karolchik D, Armengol L, Bird CP, de Bakker PI, Kern AD, Lopez-Bigas N, Martin JD, Stranger BE, Woodroffe A, Davydov E, Dimas A, Eyras E, Hallgrímsdóttir IB, Huppert J, Zody MC, Abecasis GR, Estivill X, Bouffard GG, Guan X, Hansen NF, Idol JR, Maduro VV, Maskeri B, McDowell JC, Park M, Thomas PJ, Young AC, Blakesley RW, Muzny DM, Sodergren E, Wheeler DA, Worley KC, Jiang H, Weinstock GM, Gibbs RA, Graves T, Fulton R, Mardis ER, Wilson RK, Clamp M, Cuff J, Gnerre S, Jaffe DB, Chang JL, Lindblad-Toh K, Lander ES, Koriabine M, Nefedov M, Osoegawa K, Yoshinaga Y, Zhu B, de Jong PJ, ENCODE Project Consortium. NISC Comparative Sequencing Program. Baylor College of Medicine Human Genome Sequencing Center. Washington University Genome Sequencing Center. Broad Institute. Children's Hospital Oakland Research Institute Identification and analysis of functional elements in 1% of the human genome by the ENCODE pilot project. Nature. 2007;447:799–816. doi: 10.1038/nature05874. - DOI - PMC - PubMed
    1. Blewitt ME, Vickaryous NK, Hemley SJ, Ashe A, Bruxner TJ, Preis JI, Arkell R, Whitelaw E. An N-ethyl-N-nitrosourea screen for genes involved in variegation in the mouse. PNAS. 2005;102:7629–7634. doi: 10.1073/pnas.0409375102. - DOI - PMC - PubMed

Publication types

MeSH terms