. 2018 Mar 13:7:e32058.
doi: 10.7554/eLife.32058.

Closed-loop neuromodulation restores network connectivity and motor control after spinal cord injury

Affiliations

Closed-loop neuromodulation restores network connectivity and motor control after spinal cord injury

Patrick D Ganzer et al. Elife. .

Abstract

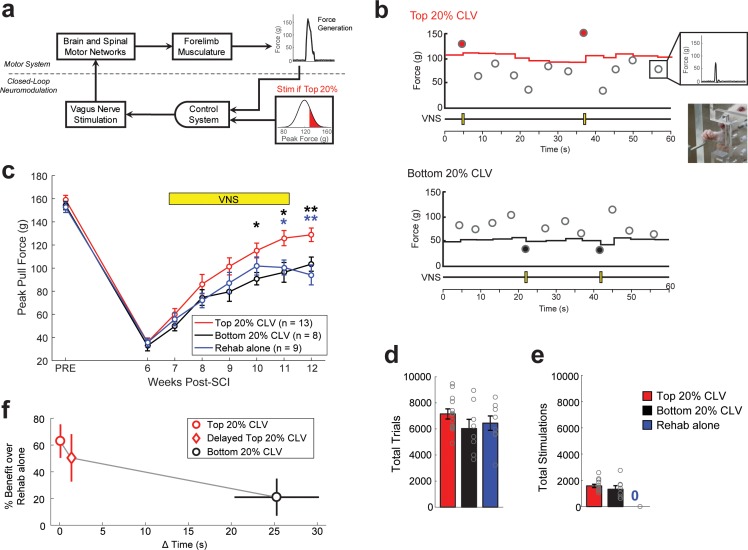
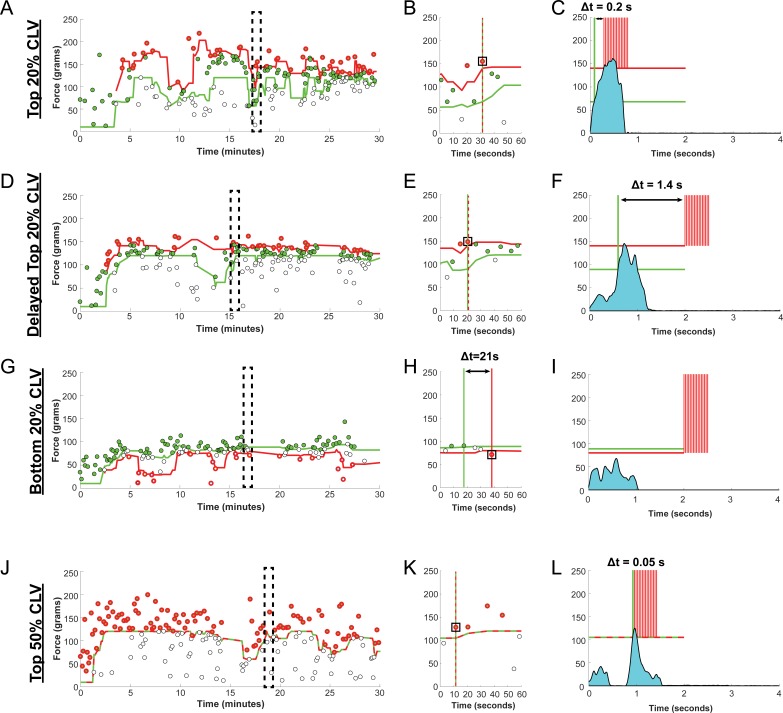
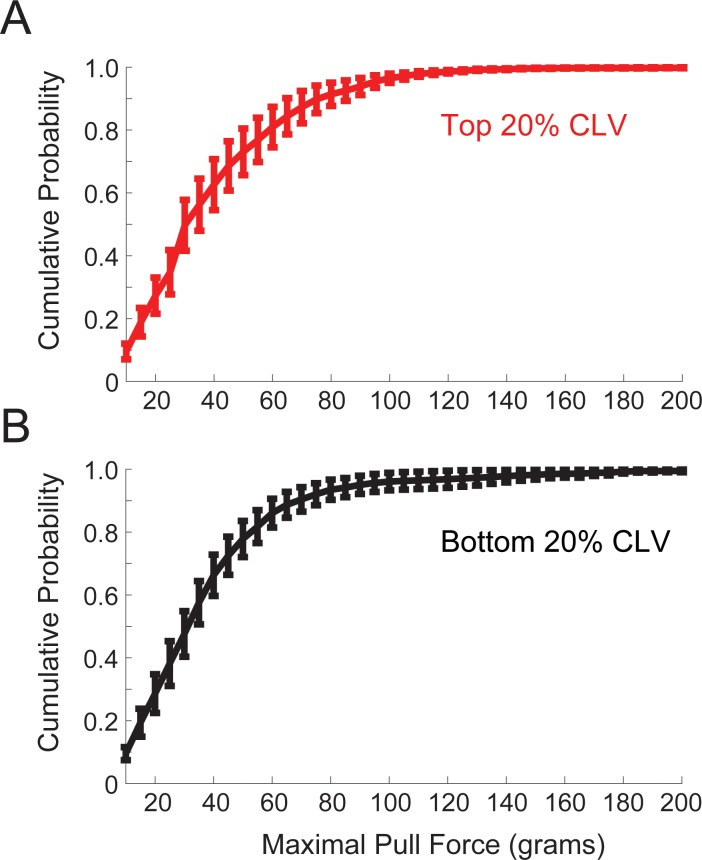
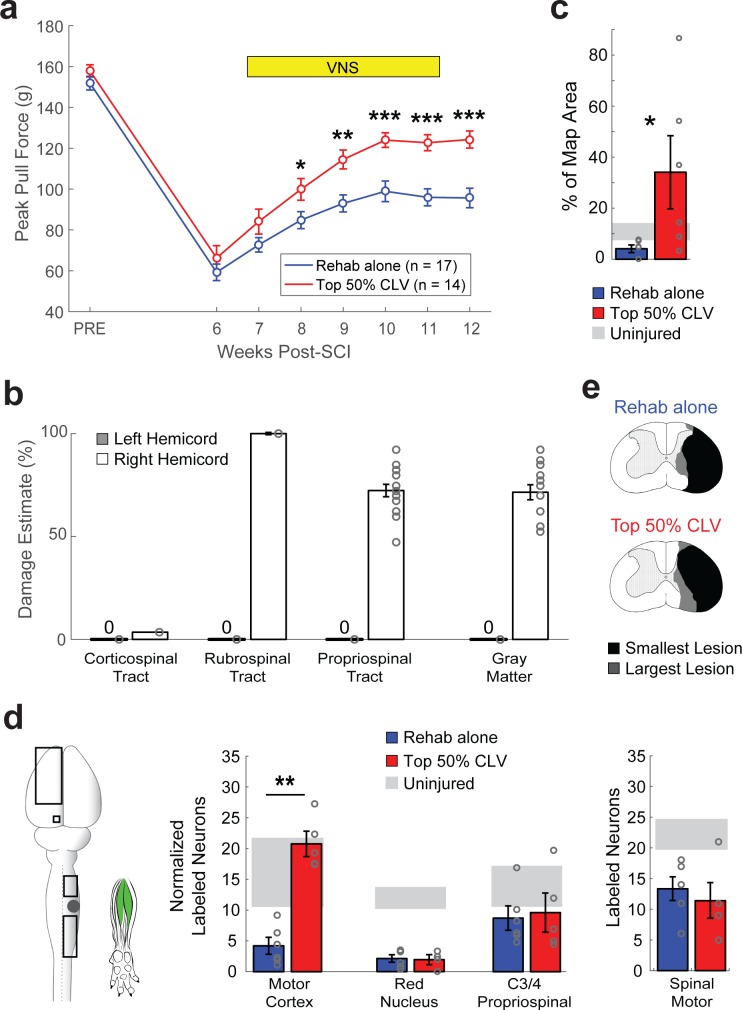
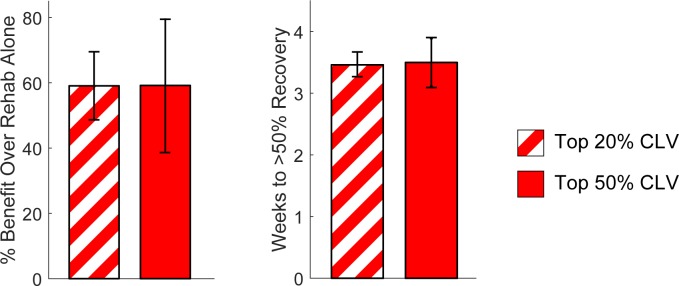
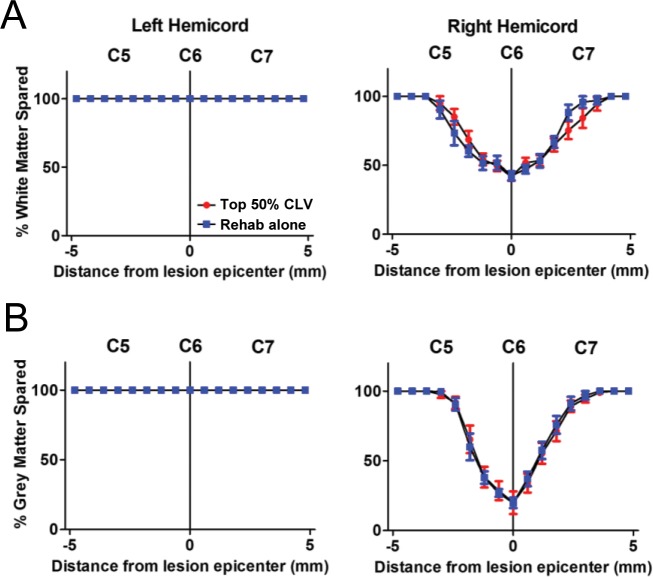
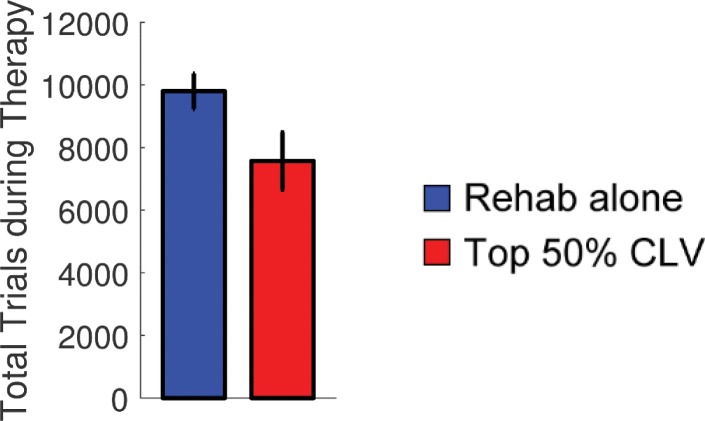
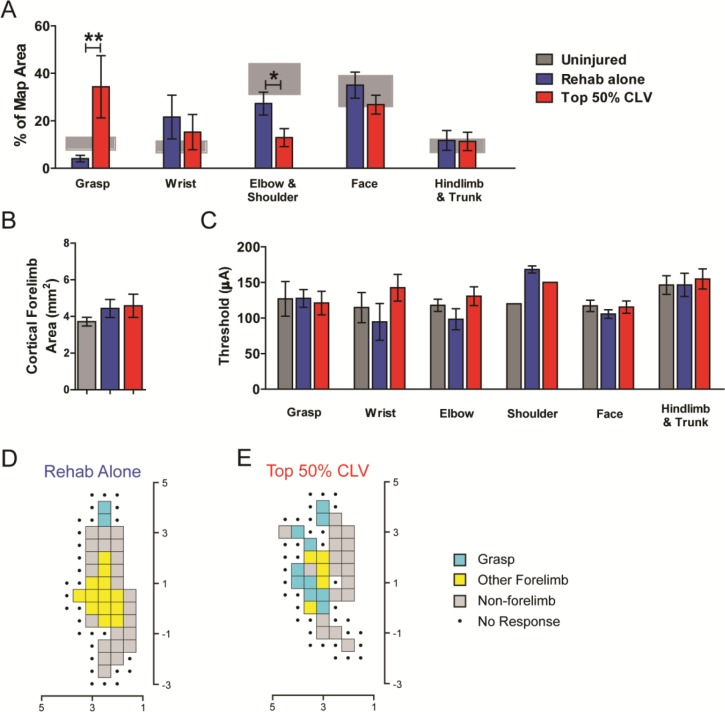
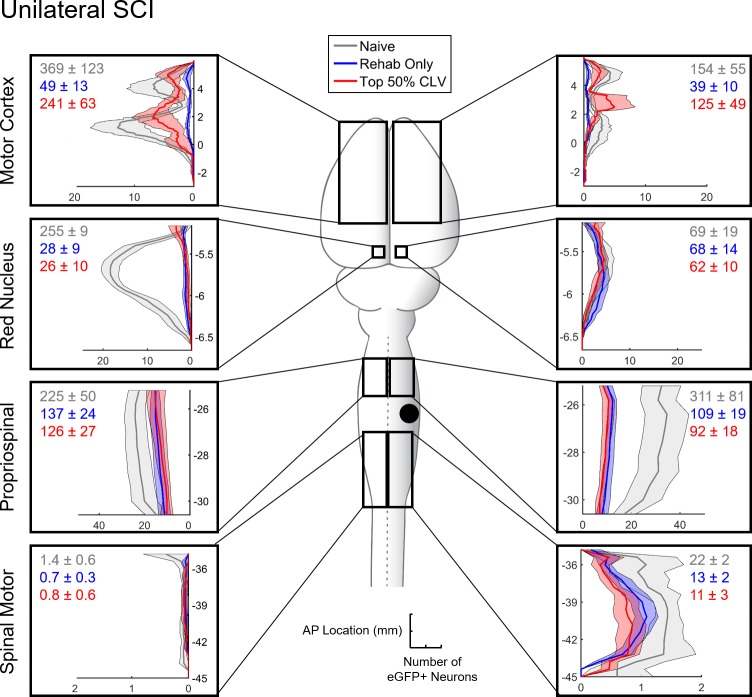
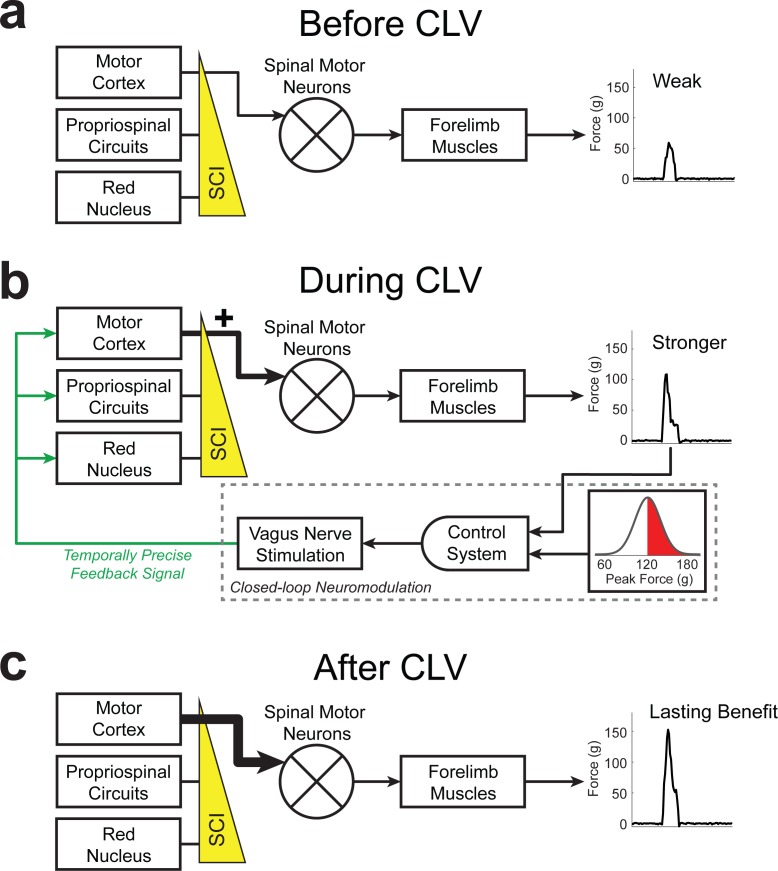
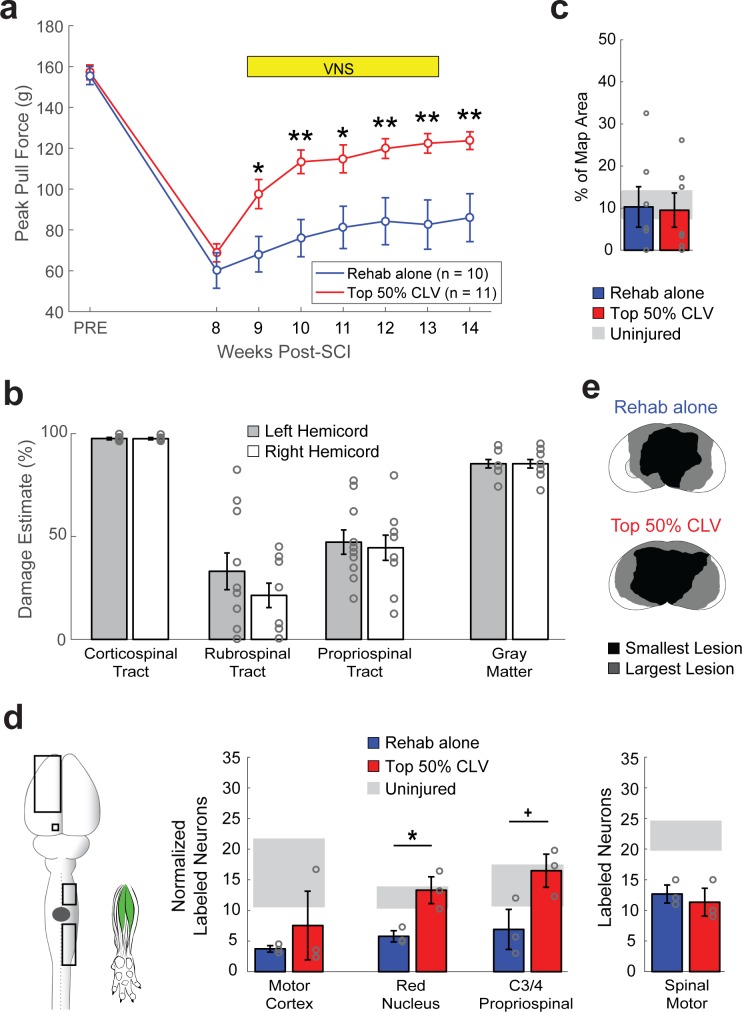
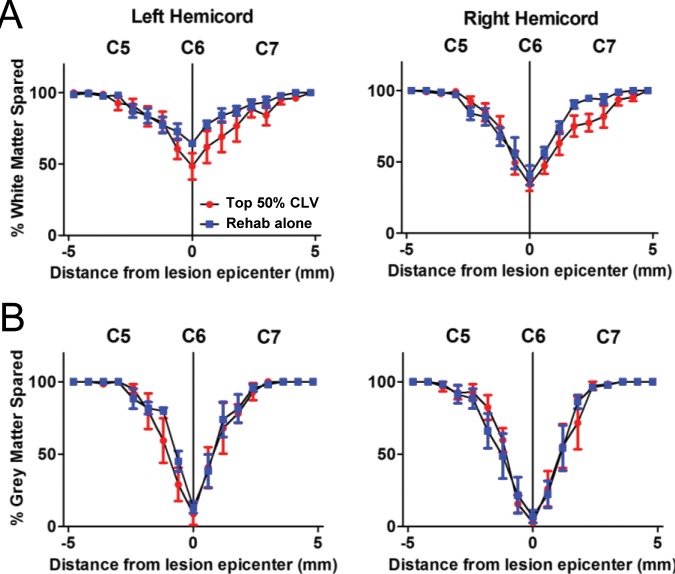
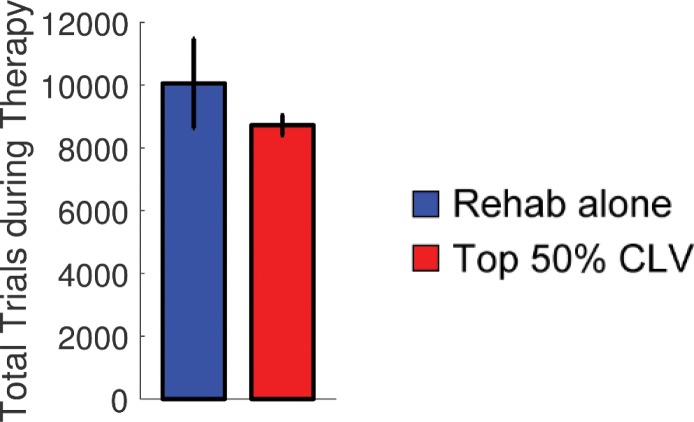
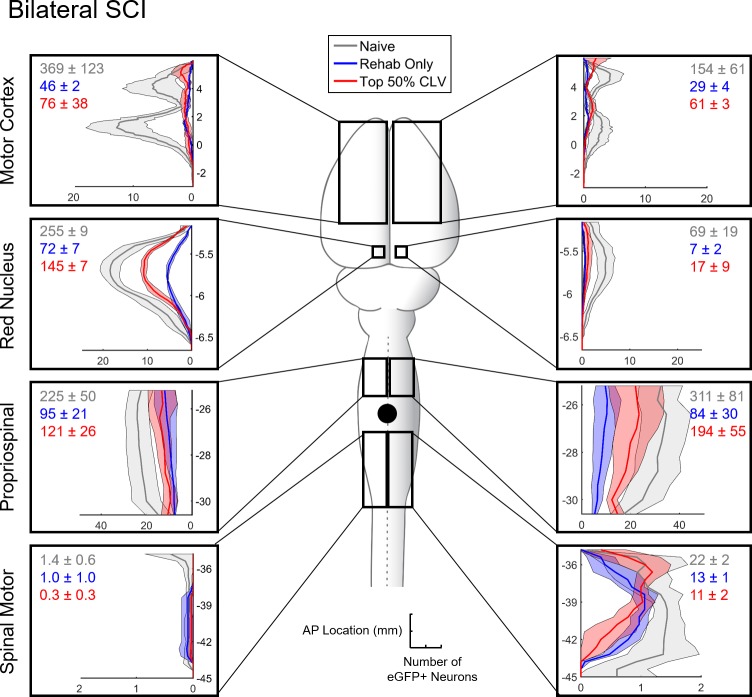
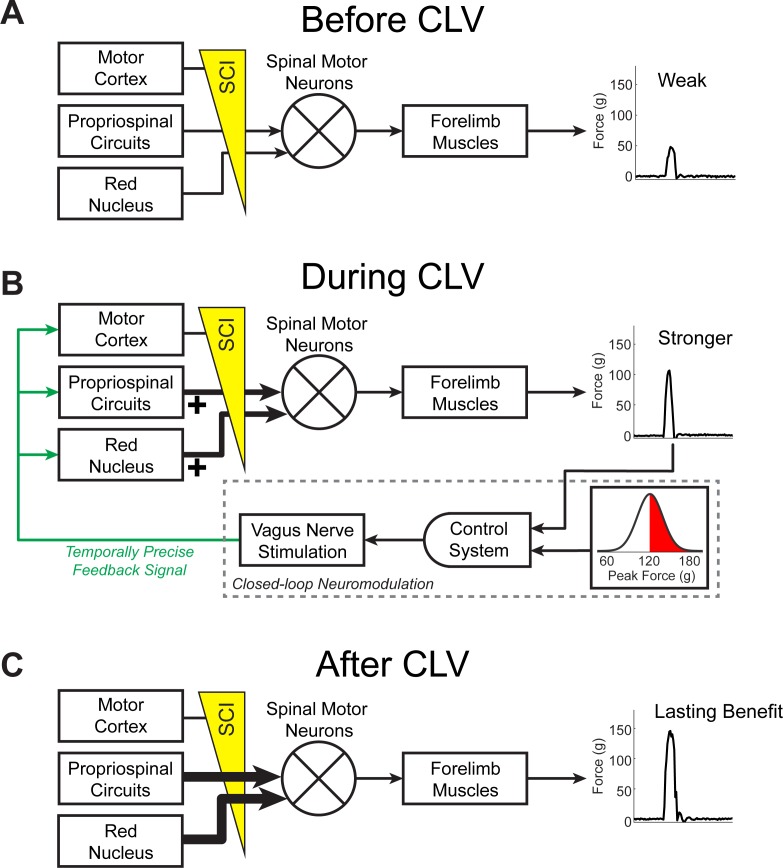
Recovery from serious neurological injury requires substantial rewiring of neural circuits. Precisely-timed electrical stimulation could be used to restore corrective feedback mechanisms and promote adaptive plasticity after neurological insult, such as spinal cord injury (SCI) or stroke. This study provides the first evidence that closed-loop vagus nerve stimulation (CLV) based on the synaptic eligibility trace leads to dramatic recovery from the most common forms of SCI. The addition of CLV to rehabilitation promoted substantially more recovery of forelimb function compared to rehabilitation alone following chronic unilateral or bilateral cervical SCI in a rat model. Triggering stimulation on the most successful movements is critical to maximize recovery. CLV enhances recovery by strengthening synaptic connectivity from remaining motor networks to the grasping muscles in the forelimb. The benefits of CLV persist long after the end of stimulation because connectivity in critical neural circuits has been restored.

Keywords: neuroscience; rat; recovery; rehabilitation; spinal cord injury; vagal nerve stimulation; vagus nerve stimulation.


Conflict of interest statement

PG, MD, EM, BS, AR, NR, KA, JJ, HJ, AB, MG, DP, SH, RR No competing interests declared, MK has a financial interesting in MicroTransponder, Inc., which is developing CLV for stroke and tinnitus

Figures

Figure 1.
Figure 1.. Precisely-timed closed-loop vagus nerve stimulation based on the synaptic eligibility trace enhances recovery after spinal cord injury.
(a) Closed-loop neuromodulation to deliver vagus nerve stimulation to reinforce the most successful trials during rehabilitative training after SCI. (b) Top 20% CLV received a 0.5 s train of VNS on trials in which pull force falls within the highest quintile of previous pull forces. The Bottom 20% CLV group received VNS on trials in which pull force falls within the lowest quintile. Rehab alone performed equivalent rehabilitative training without VNS. Each circle represents peak pull force on an individual trial. Inset shows an animal performing the isometric pull task. See Figure 1—figure supplement 1 for more detail. (c) Top 20% CLV significantly improves forelimb function after SCI compared to Bottom 20% CLV and Rehab alone, indicating that precisely-timed VNS enhances recovery. (d,e) Differences in the intensity of rehabilitative training or the amount of stimulations cannot account for improved recovery. A significant increase in recovery is observed with Top 20% CLV after correcting for number of trials and number of stimulations (ANCOVA, effect of group; number of trials: F[1,1]=11.89, p=0.0031; number of stimulations: F[1,1]=9.57, p=0.0066). Gray circles denote individual subjects. (f) CLV delivered within 2 s of successful trials increases recovery, whereas CLV separated 25 s from successful trials fails to yield substantial benefits. This time window is consistent with the synaptic eligibility trace hypothesis. Horizontal error bars for Top 20% CLV and Delayed Top 20% CLV are not visible because of their small size. In panel c, **p<0.01, *p<0.05 for t-tests across groups at each time point. The color of the asterisk denotes the group compared to Top 20% CLV. Error bars indicate S.E.M.
Figure 1—figure supplement 1.
Figure 1—figure supplement 1.. Adaptive Thresholding and Stimulation Timing.
During all rehabilitative training sessions throughout the study, an adaptive reward threshold was used to scale the difficulty of the task. Reward threshold was based on the median of the ten antecedent trials and capped at 120 g, thus rats received a food reward on a given trial if their pull force exceeded the best 50% of 10 most recent trials or 120 g (Ganzer et al., 2016a), (Meyers et al., 2017). This adaptive reward threshold was for all subjects at all times throughout the study. The reward threshold is shown as a green line in all panels and in Videos 1–5. An independent adaptive stimulation threshold specific to each CLV group was used to determine stimulation delivery during rehabilitative training (described in detail below). Adaptive stimulation thresholds are shown as a red line in the panels below. (A) In the Top 20% CLV group, the stimulation threshold was scaled such that VNS was delivered on trials in which pull force exceeded the top quintile of the peak pull force from the previous 10 trials. Circles represents the peak force of each individual trial during a rehabilitative training session. Green filled circles indicate the successful trials in which pull force exceeded the reward threshold. Green circles with a red border indicate trials on which VNS was delivered (the top 20% of trials). White circles indicate trials in which peak force did not exceed the reward threshold. A one minute representative segment of trials (marked with a dashed box) is shown in panel B. (B) The green vertical line represents the time in which the reward threshold is crossed. The dashed red vertical line indicates the timing of VNS delivery. Stimulation began after pull force crossed the stimulation threshold, resulting in a short difference between the closest successful trial and VNS (Δt) of 0.2 s. (C) This panel depicts pull force and VNS timing on an example stimulated trial (denoted with a black box in panel B). Note that the train of VNS (horizontal red lines) occurs coincident with crossing the red stimulation threshold and shortly after pull force exceeds the green success threshold. (D) A subset of rats received Delayed Top 20% CLV. In this configuration, VNS was still delivered on trials in which pull force exceeded the top 20% of the previous ten trials, but stimulation was delayed until the end of the 2 s trial window as shown in E and F. (E,F) This delay resulted in an average Δt of 1.4 s between the most successful trials and VNS. (G) In the Bottom 20% CLV group, the stimulation threshold was set such that VNS was delivered at the end of the trial window if pull force did not exceed the lowest quintile of the peak force of the 10 previous trials. White circles with a red border indicate trials on which VNS was delivered (the bottom 20% of trials). (H,I) Stimulation was delivered at the end of the 2 s trial window if the stimulation threshold was not exceeded, resulting in an average Δt of 25 s between the most successful trials and VNS. (J) For rats in the Top 50% CLV groups, the stimulation threshold was set such that VNS was delivered on trials in which pull force exceeded the median peak force of the previous ten trials or exceeded 120 g. (K,L) Stimulation began immediately (~50 ms) after pull force crossed the stimulation threshold.
Figure 1—figure supplement 2.
Figure 1—figure supplement 2.. Distribution of Pull Forces after SCI.
The distribution of pull forces after SCI on Wk 6 was similar in the Top 20% CLV and Bottom 20% CLV groups. This indicates that these groups had similar forelimb impairments prior to beginning CLV therapy. Data represent mean ± SEM.
Figure 2.
Figure 2.. CLV enhances plasticity in spared corticospinal networks and improves functional recovery after unilateral SCI.
(a) Top 50% CLV significantly improved recovery of forelimb function compared to Rehab alone. Sustained recovery was observed on week 12 after the cessation of stimulation, indicating lasting benefits. (b) Unilateral SCI caused substantial damage to gray matter, rubrospinal, and propriospinal tracts in the right hemicord, while largely sparing the right corticospinal tract and the entirety of the left hemicord. (c) ICMS reveals that Top 50% CLV significantly increases the area of the forelimb motor cortex evoking rehabilitated grasping movements compared to Rehab alone (N = 6,6). (d) Retrograde transneuronal tracing with PRV-152 was performed to evaluated anatomical connectivity from the left motor cortex neurons, left red nucleus neurons, and right C3/4 propriospinal neurons to grasping muscles in the trained (right) forelimb. Top 50% CLV restores connectivity and results in a significant increase in labeled neurons in the motor cortex compared to Rehab alone (N = 5,6). No changes were observed in red nucleus or C3/4 propriospinal neurons. Black boxes indicate ROIs; gray dot indicates lesion epicenter; inset shows injected muscles. (e) CLV does not affect lesion size. In all panels, gray circles denote individual subjects. In all panels, ***p<0.001, **p<0.01, *p<0.05 for t-tests across groups. Error bars indicate S.E.M.
Figure 2—figure supplement 1.
Figure 2—figure supplement 1.. Top 20% CLV and Top 50% CLV display comparable recovery.
We tested the hypothesis that more pairings of VNS would increase recovery after unilateral SCI. To do so, we compared recovery of forelimb function at in rats that received either Top 20% CLV or Top 50% CLV, resulting in approximately 2.5 fold more stimulation pairings. (A) As expected (Hays et al., 2014b), Top 20% CLV and Top 50% CLV displayed a comparable degree of recovery (Top 20% CLV v. Top 50% CLV, Unpaired t-test, p=0.99). (B) Similarly, more stimulations did not accelerate the rate of recovery, as assessed by the number of weeks of CLV required to reach 50% recovery (Top 20% CLV v. Top 50% CLV, Unpaired t-test, p=0.92). Together, these findings suggest that timing stimulation with the successful trials is more important that the total amount of stimulation pairings. Data represent mean ± SEM.
Figure 2—figure supplement 2.
Figure 2—figure supplement 2.. CLV does not affect lesion size after Unilateral SCI.
Consistent with previous studies in models of ischemic stroke, intracerebral hemorrhage, or traumatic brain injury, CLV does not affect lesion size or extent (Khodaparast et al., 2016; Pruitt et al., 2016; Hays et al., 2014a; Hays et al., 2016; Khodaparast et al., 2013; Khodaparast et al., 2014). After right unilateral SCI, no differences were observed in the extent of white matter damage (A) or gray matter damage (B) between the Top 50% CLV group and the Rehab alone group. The absence of differences in lesion size with CLV confirm that neuroprotective effects cannot account for the differences in recovery. Data represent mean ± SEM.
Figure 2—figure supplement 3.
Figure 2—figure supplement 3.. CLV does not influence the number of trials performed during rehabilitative training.
Greater intensities of task-oriented rehabilitative training are associated with better outcomes after neurological injury (Kwakkel et al., 1999). Thus, it was possible that CLV could improve recovery by increasing motivation and subsequently leading to more intensive rehabilitative training. We tested whether CLV increased the number of trials performed during rehabilitative training. After unilateral SCI, no differences in the total number of trials performed was observed between the Top 50% CLV group and Rehab alone group (Unpaired t-test, p=0.07). Contrary to the notion that CLV may increase training intensity, rats receiving Top 50% CLV displayed a trend towards a reduced total number of trials performed. Together, these findings confirming that CLV-dependent increases in motivation or task-focused repetition cannot explain improved recovery. Data represent mean ± SEM.
Figure 2—figure supplement 4.
Figure 2—figure supplement 4.. Motor Cortex Movement Representations.
(A) CLV-dependent changes in motor cortex movement representations as assessed with ICMS were observed after unilateral SCI, consistent with a sparing of the CST. CLV significantly increased the representation of grasp movements compared to Rehab alone (Unpaired t-test, Top 50% CLV v. Rehab alone, p<0.01). The representation of proximal elbow and shoulder movements was decreased in the Top 50% CLV group, likely to accommodate the expansion of grasp movement without changing the total area of forelimb representation. No differences were observed in non-forelimb movement representations. (B) After unilateral SCI, no differences in total forelimb representational area were observed (F[2,18]=1.05, p=0.37). (C) Stimulation thresholds to evoke movement were comparable across groups. Example ICMS movement representation maps from subjects with unilateral SCI at the conclusion of therapy after (D) Rehab alone and (E) Top 50% CLV. Note the expansion in the area of motor cortex generating grasp movements after Top 50% CLV. Each square represents a 0.25 mm2 (0.5 × 0.5 mm) area. Electrode penetrations occurred in the middle of each square. Data represent mean ± SEM. *p<0.05; **p<0.01.
Figure 2—figure supplement 5.
Figure 2—figure supplement 5.. Distribution of eGFP+ neurons with Rehabilitation alone or Top 50% CLV after Unilateral SCI.
We performed retrograde transneuronal tracing using PRV-152 to identify networks of neurons that were synaptically connected to forelimb grasping muscles in rats that received either Rehab alone or Top 50% CLV after unilateral SCI. The boxes in the center schematic show the areas throughout the neuraxis where eGFP+ labeled neurons were quantified. Boxes along each side of the schematic show the anterior-posterior distribution of eGFP+ neurons in each area in each hemisphere. Y axis denote distance from bregma in mm. X values represent the average number of eGFP+ neurons for each group using a moving average across ten histological sections. Values in the top corner of each box indicate the total number of labeled neurons in each region for each group. After unilateral SCI, CLV increases labeled neurons in the motor cortex compared to Rehab alone. Solid lines indicate mean and shaded area denotes SEM. The black circle indicates the location of the impactor tip during SCI.
Figure 3.
Figure 3.. Schematic of CLV-dependent recovery after unilateral SCI.
(a) After unilateral SCI, loss of motor out from rubrospinal and propriospinal networks results in forelimb paresis and impairments in motor control. (b) The addition of CLV provides temporally-precise feedback on the most successful trials to facilitate training-dependent plasticity in remaining motor networks. (c) The benefits of CLV persist after the cessation of closed-loop stimulation because connectivity in critical neural circuits has been restored.
Figure 4.
Figure 4.. CLV enhances synaptic plasticity and recovery after bilateral SCI.
(a) After bilateral SCI, Top 50% CLV substantially enhanced recovery of volitional forelimb strength compared to Rehab alone. Improved function was maintained on week 14 after the cessation of CLV, indicative of lasting recovery. (b) Bilateral SCI resulted in virtually complete bilateral ablation of the corticospinal tract and substantial damage to gray matter. The rubrospinal and propriospinal tracts were lesioned, but partially remaining. (c) Unlike after unilateral SCI, Top 50% CLV failed to increase the area of the motor cortex evoking rehabilitated grasping movements compared to Rehab alone (N = 7,7). (d) CLV significantly increased synaptic connectivity from the left red nucleus neurons and right C3/4 propriospinal neurons to grasping muscles compared to Rehab alone (N = 3,3). Black boxes indicate ROIs; gray dot indicates lesion epicenter; inset shows injected muscles. In all panels, gray circles denote individual subjects. In all panels, **p<0.01, *p<0.05,+P = 0.05 for t-tests across groups. Error bars indicate S.E.M.
Figure 4—figure supplement 1.
Figure 4—figure supplement 1.. CLV does not affect lesion size after Bilateral SCI.
After bilateral SCI, both white matter (C) and gray matter (D) are damaged to a similar extent on both sides of the spinal cord in the Top 50% CLV group and the Rehab alone group. The absence of differences in lesion size with CLV confirm that neuroprotective effects cannot account for the differences in recovery. Data represent mean ± SEM.
Figure 4—figure supplement 2.
Figure 4—figure supplement 2.. CLV does not influence the number of trials performed during rehabilitative training after bilateral SCI.
After bilateral SCI, no differences in the total number of trials performed was observed between the Top 50% CLV group and Rehab alone group (Unpaired t-test, p=0.051). Similar to unilateral SCI, a trend toward a reduced number of trials was observed in the Top 50% CLV group compared to Rehab alone. Together, these findings confirming that CLV-dependent increases in motivation or task-focused repetition cannot explain improved recovery. Data represent mean ± SEM.
Figure 4—figure supplement 3.
Figure 4—figure supplement 3.. Distribution of eGFP+ neurons with Rehabilitation alone or Top 50% CLV after Bilateral SCI.
We performed retrograde transneuronal tracing using PRV-152 to identify networks of neurons that were synaptically connected to forelimb grasping muscles in rats that received either Rehab alone or Top 50% CLV after bilateral SCI. The boxes in the center schematic show the areas throughout the neuraxis where eGFP+ labeled neurons were quantified. Boxes along each side of the schematic show the anterior-posterior distribution of eGFP+ neurons in each area in each hemisphere. Y values denote distance from bregma in mm. X values represent the average number of eGFP+ neurons for each group using a moving average across ten histological sections. Values in the top corner of each box indicate the total number of labeled neurons in each region for each group. After bilateral SCI, CLV increases labeled neurons in the red nucleus and C3/4 propriospinal neurons compared to Rehab alone. Solid lines indicate mean and shaded area denotes SEM. The black circle indicates the location of the impactor tip during SCI.
Figure 4—figure supplement 4.
Figure 4—figure supplement 4.. Motor Cortex Movement Representations.
(A) After bilateral SCI, no differences in any movement representations were observed with Top 50% CLV compared to Rehab alone. (B) No differences in total forelimb representational area were observed (F[2,20]=2.97, p=0.08). (C) Stimulation thresholds to evoke movement were comparable across groups. Example ICMS maps from subjects with bilateral SCI after (D) Rehab alone and (E) Top 50% CLV. Note the similar area of motor cortex generating grasp movements between groups. In all panels, each square represents a 0.25 mm2 (0.5 × 0.5 mm) area. Electrode penetrations occurred in the middle of each square. Data represent mean ± SEM.
Figure 4—figure supplement 5.
Figure 4—figure supplement 5.. CLV drives plasticity in remaining motor networks to support recovery after bilateral SCI.
(A) Bilateral SCI causes virtually complete elimination of the corticospinal tract and moderate damage to the propriospinal and rubrospinal tracts, resulting in deficits in forelimb strength. (B) CLV delivered on the most successful trials during rehabilitation provides temporally-precise neuromodulatory feedback to support plasticity in remaining propriospinal and rubrospinal networks. (C) After the conclusion of CLV, synaptic connectivity in propriospinal and rubrospinal motor networks is restored, resulting in an improvement in forelimb strength that lasts after the cessation of stimulation.
Figure 4—figure supplement 6.
Figure 4—figure supplement 6.. Post-SCI Time until Recumbency and Paw Placement.
The number of days until recumbency (A) and right forepaw plantar placement (B) was approximately one week longer after bilateral SCI compared to unilateral SCI (Recumbency: Unpaired t-test, p<0.001; Right Forepaw Plantar Placement: Unpaired t-test, p<0.001). As a result of the longer delay, experiments were designed such that rats that received bilateral SCI returned to rehabilitative training later (Week 8) than animals that received unilateral SCI (Week 6). Data represent mean ± SEM. ***p<0.001.

Comment in

References

    1. Alvarez-Dieppa AC, Griffin K, Cavalier S, McIntyre CK. Vagus nerve stimulation enhances extinction of conditioned fear in rats and modulates arc protein, CaMKII, and GluN2B-Containing NMDA receptors in the basolateral amygdala. Neural Plasticity. 2016;2016:1–11. doi: 10.1155/2016/4273280. - DOI - PMC - PubMed
    1. Anderson KD, Sharp KG, Steward O. Bilateral cervical contusion spinal cord injury in rats. Experimental Neurology. 2009;220:9–22. doi: 10.1016/j.expneurol.2009.06.012. - DOI - PMC - PubMed
    1. Bareyre FM, Kerschensteiner M, Misgeld T, Sanes JR. Transgenic labeling of the corticospinal tract for monitoring axonal responses to spinal cord injury. Nature Medicine. 2005;11:1355–1360. doi: 10.1038/nm1331. - DOI - PubMed
    1. Bareyre FM, Kerschensteiner M, Raineteau O, Mettenleiter TC, Weinmann O, Schwab ME. The injured spinal cord spontaneously forms a new intraspinal circuit in adult rats. Nature Neuroscience. 2004;7:269–277. doi: 10.1038/nn1195. - DOI - PubMed
    1. Ben-Menachem E. Vagus nerve stimulation, side effects, and long-term safety. Journal of Clinical Neurophysiology. 2001;18:415–418. doi: 10.1097/00004691-200109000-00005. - DOI - PubMed

Publication types

MeSH terms

Substances