

doi: 10.1107/S2059798317017235.
Epub 2018 Feb 1.
DIALS: implementation and evaluation of a new integration package
Affiliations
- PMID: 29533234
- PMCID: PMC5947772
- DOI: 10.1107/S2059798317017235
Item in Clipboard
DIALS: implementation and evaluation of a new integration package
Acta Crystallogr D Struct Biol.
.
Abstract
The DIALS project is a collaboration between Diamond Light Source, Lawrence Berkeley National Laboratory and CCP4 to develop a new software suite for the analysis of crystallographic X-ray diffraction data, initially encompassing spot finding, indexing, refinement and integration. The design, core algorithms and structure of the software are introduced, alongside results from the analysis of data from biological and chemical crystallography experiments.
Keywords: DIALS; X-ray diffraction; data processing; methods development.
Figures
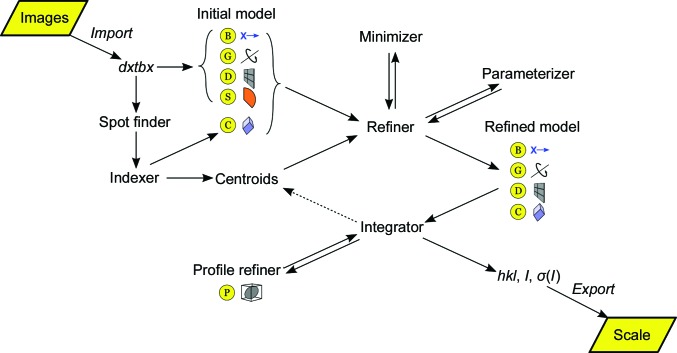
Flow diagram illustrating the scope and workflow of DIALS. The experiment is represented by a set of abstract models describing the parameters of the X-ray beam (B), goniometer (which incorporates the description of the goniometer hardware; G), imaging detector (D), scan (which includes goniometer settings for a given sequence of images and exposure times; S), crystal (C) and Bragg spot profile (P). The reflection data are passed from one step to the next as a list, with the properties of the reflections extended as processing proceeds.

Refinement statistics [mean of cosine of phase error (FOM), CC between F
o and F
c, and R factors] for LRR and thermolysin against data processed with xia2 and DIALS. While there are no surprises for LRR, for thermolysin it is important to note that the statistics remain well behaved as the I/σ(I) of the data tends towards zero.

R-factor gap using data to 1.8 Å resolution as a function of the resolution of the data used for the paired refinement. There is a clear reduction in the difference between R and R
free using the weaker measurements to around 1.56 Å resolution.
Commonly encountered reciprocal-space pathologies using dials.reciprocal_lattice_viewer. (a) Problems with image headers, such as an incorrect beam centre or an inverted rotation axis, may lead to an apparent distortion in the lattice. Depending on the severity of the distortion, autoindexing may identify an incorrect lattice or result in an offset in the assigned Miller indices. (b) Visible features that are not part of the primary lattice, such as points arranged in a spherical shell, may indicate the presence of ice rings or low-quality powder samples. (c) Split crystals or multiple lattices are visible as a set of two or more intersecting lattices. Unindexed reflections and reflections identified as belonging to distinct lattices are coloured separately to aid visualization. (d) Multiple sweeps from a single crystal on a multi-axis goniometer can be combined for display, with each sweep uniquely coloured.

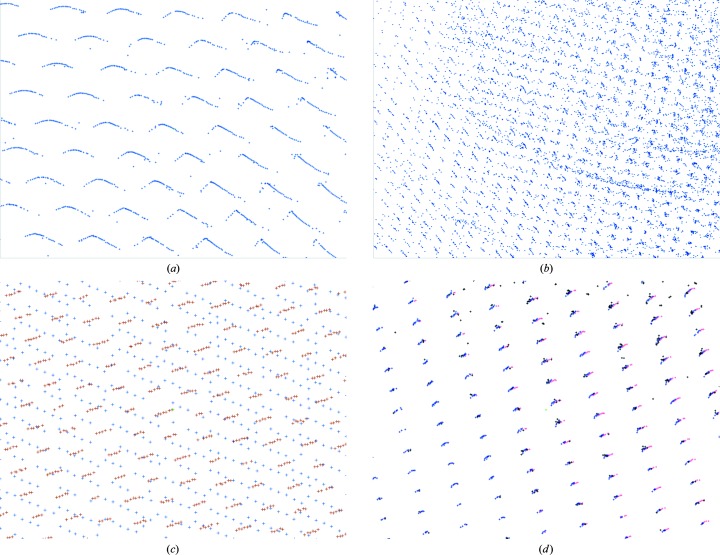
Spot count per image plots generated by the dials.report tool for three data sets. (a) shows what may be expected when there is no substantial radiation damage, (b) when there is substantial radiation damage and (c) when a poorly centred sample is rotated out of the beam for part of the scan. These indicators may very rapidly be used to diagnose issues with data sets without needing to individually inspect the images.
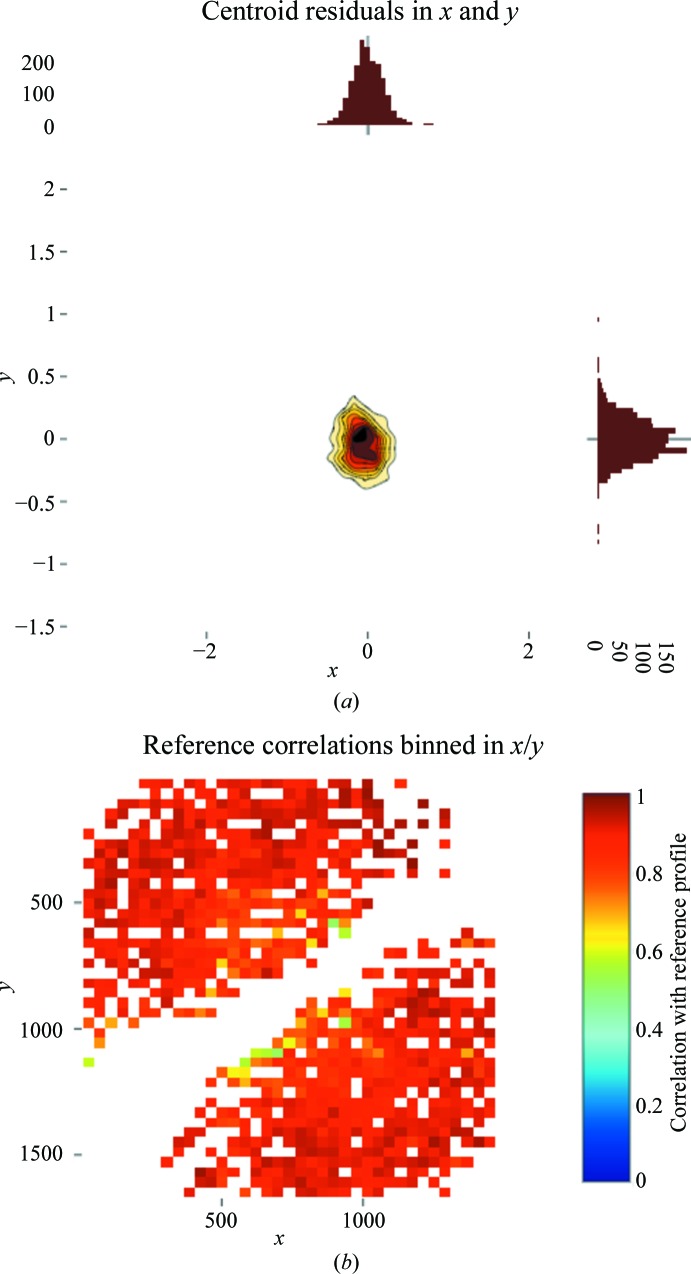
Images generated by dials.report showing (a) a histogram of x, y deviations between observed and calculated spot positions from refinement and (b) correlation between modelled and observed spot profiles in integration. The diagonal blank region corresponds to reflections close to the rotation axis in a φ scan (both taken from the small-molecule example in the main text).
Similar articles
-
Improving signal strength in serial crystallography with DIALS geometry refinement.Acta Crystallogr D Struct Biol. 2018 Sep 1;74(Pt 9):877-894. doi: 10.1107/S2059798318009191. Epub 2018 Sep 3. Acta Crystallogr D Struct Biol. 2018. PMID: 30198898 Free PMC article.
-
Electron diffraction data processing with DIALS.Acta Crystallogr D Struct Biol. 2018 Jun 1;74(Pt 6):506-518. doi: 10.1107/S2059798318007726. Epub 2018 May 30. Acta Crystallogr D Struct Biol. 2018. PMID: 29872002 Free PMC article.
-
Processing serial synchrotron crystallography diffraction data with DIALS.Methods Enzymol. 2024;709:207-244. doi: 10.1016/bs.mie.2024.10.004. Epub 2024 Oct 29. Methods Enzymol. 2024. PMID: 39608945
-
X-ray data processing.Biosci Rep. 2017 Oct 6;37(5):BSR20170227. doi: 10.1042/BSR20170227. Print 2017 Oct 31. Biosci Rep. 2017. PMID: 28899925 Free PMC article. Review.
-
Ongoing developments in CCP4 for high-throughput structure determination.Acta Crystallogr D Biol Crystallogr. 2002 Nov;58(Pt 11):1929-36. doi: 10.1107/s0907444902016116. Epub 2002 Oct 21. Acta Crystallogr D Biol Crystallogr. 2002. PMID: 12393924 Review.
Cited by
-
GPC3-Unc5 receptor complex structure and role in cell migration.Cell. 2022 Oct 13;185(21):3931-3949.e26. doi: 10.1016/j.cell.2022.09.025. Cell. 2022. PMID: 36240740 Free PMC article.
-
Characterizing pathological imperfections in macromolecular crystals: lattice disorders and modulations.Crystallogr Rev. 2020;26(1):3-50. doi: 10.1080/0889311x.2019.1692341. Epub 2019 Dec 10. Crystallogr Rev. 2020. PMID: 33041501 Free PMC article. No abstract available.
-
A 2.8 Å Structure of Zoliflodacin in a DNA Cleavage Complex with Staphylococcus aureus DNA Gyrase.Int J Mol Sci. 2023 Jan 13;24(2):1634. doi: 10.3390/ijms24021634. Int J Mol Sci. 2023. PMID: 36675148 Free PMC article.
-
Conformational heterogeneity in apo and drug-bound structures of Toxoplasma gondii prolyl-tRNA synthetase.Acta Crystallogr F Struct Biol Commun. 2019 Nov 1;75(Pt 11):714-724. doi: 10.1107/S2053230X19014808. Epub 2019 Nov 7. Acta Crystallogr F Struct Biol Commun. 2019. PMID: 31702585 Free PMC article.
-
Characterisation of an unusual cysteine pair in the Rieske carnitine monooxygenase CntA catalytic site.FEBS J. 2023 Jun;290(11):2939-2953. doi: 10.1111/febs.16722. Epub 2023 Jan 19. FEBS J. 2023. PMID: 36617384 Free PMC article.
References
-
- Abrahams, D. & Grosse-Kunstleve, R. W. (2003). C/C++ Users J. 21, 29–36.
-
- Adams, P. D. et al. (2010). Acta Cryst. D66, 213–221. - PubMed
-
- Brewster, A. S., Waterman, D. G., Parkhurst, J. M., Gildea, R. J., Michels-Clark, T., Young, I. D., Bernstein, H. J., Winter, G., Evans, G. & Sauter, N. K. (2016). Comput. Crystallogr. Newsl. 7, 32–53. https://www.phenix-online.org/newsletter/CCN_2016_07.pdf.
-
- Bricogne, G. (1986a). Proceedings of the EEC Cooperative Workshop on Position-Sensitive Detector Software (Phases I and II). Paris: LURE.
-
- Bricogne, G. (1986b). Proceedings of the EEC Cooperative Workshop on Position-Sensitive Detector Software (Phase III). Paris: LURE.
Publication types
MeSH terms
Substances
Grants and funding
- 202933/Z/16/Z/WT_/Wellcome Trust/United Kingdom
- 283570/Seventh Framework Programme, FP7 Research Infrastructures/International
- R01 GM095887/GM/NIGMS NIH HHS/United States
- GM117126/National Institutes of Health, National Institute of General Medical Sciences/International
- GM095887/National Institutes of Health, National Institute of General Medical Sciences/International
LinkOut - more resources
Full Text Sources
Other Literature Sources
