. 2018 Aug;32(8):4270-4283.
doi: 10.1096/fj.201701016R. Epub 2018 Mar 13.

Bcr-Abl regulation of sphingomyelin synthase 1 reveals a novel oncogenic-driven mechanism of protein up-regulation

Affiliations

Bcr-Abl regulation of sphingomyelin synthase 1 reveals a novel oncogenic-driven mechanism of protein up-regulation

Sitapriya Moorthi et al. FASEB J. 2018 Aug.

Abstract

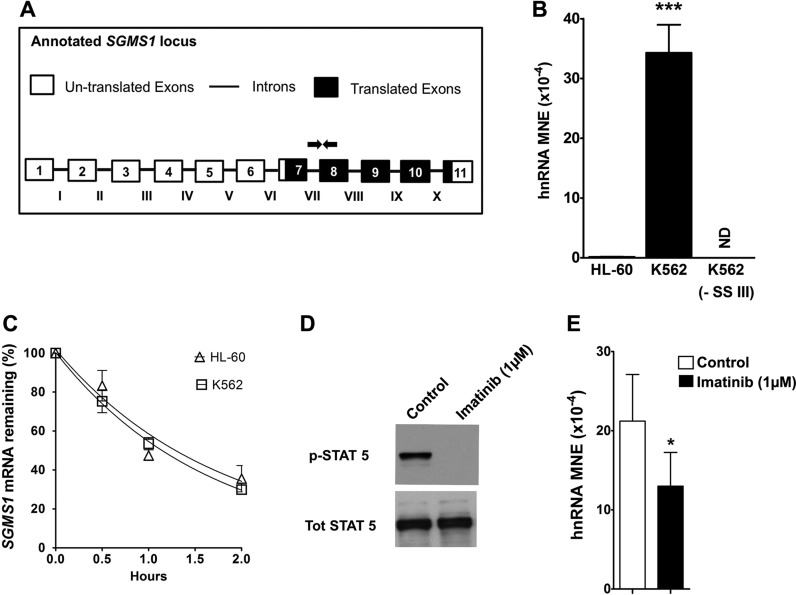
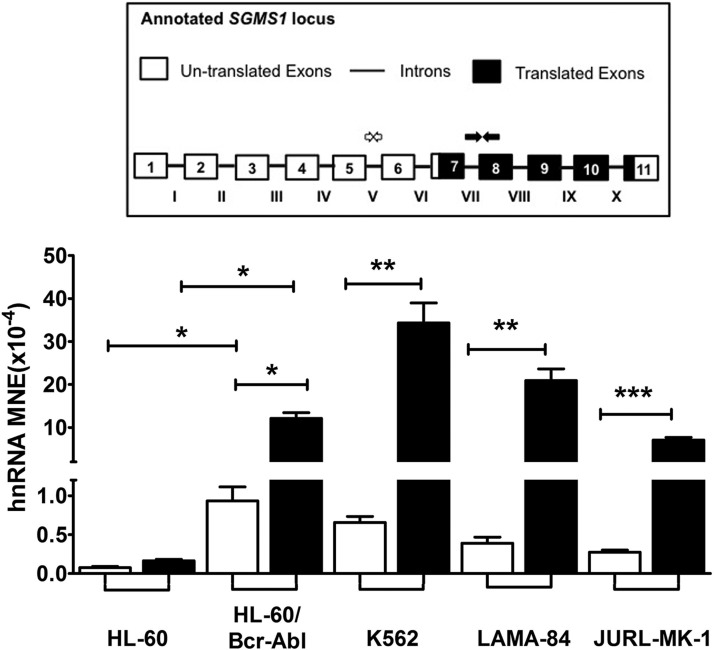
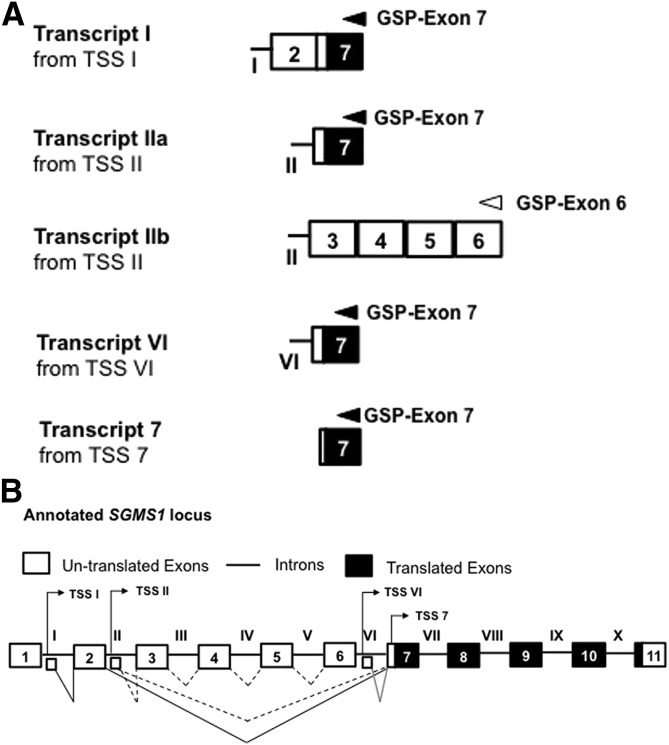
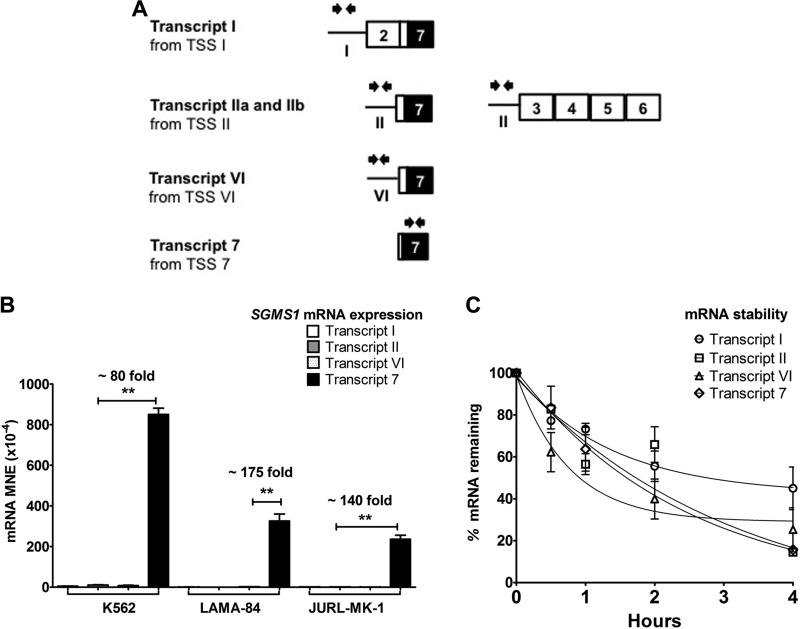
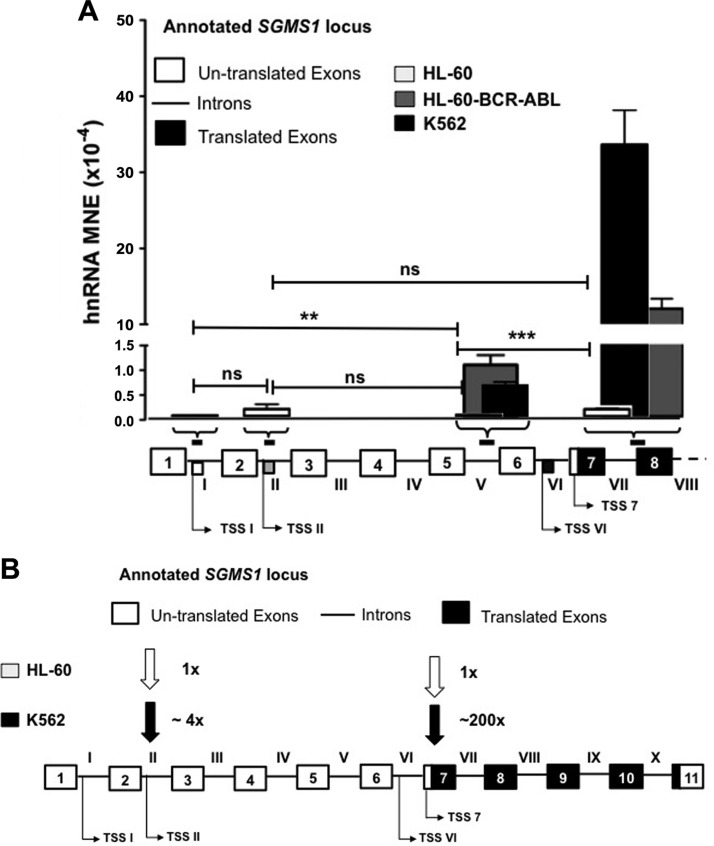
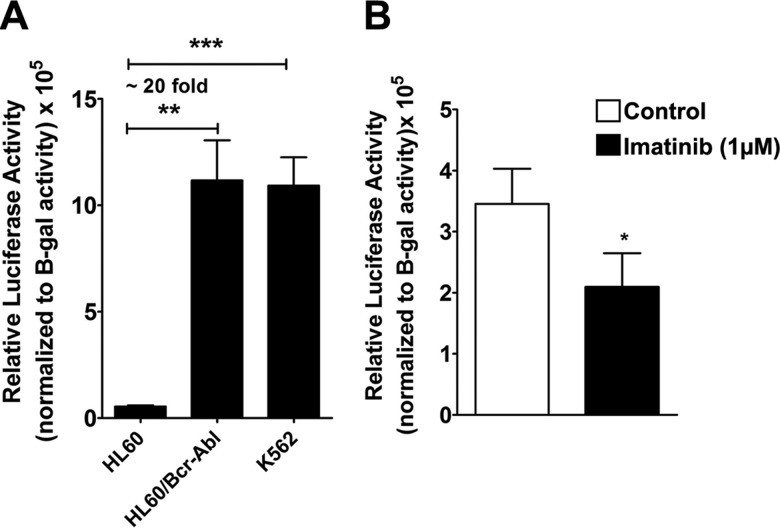
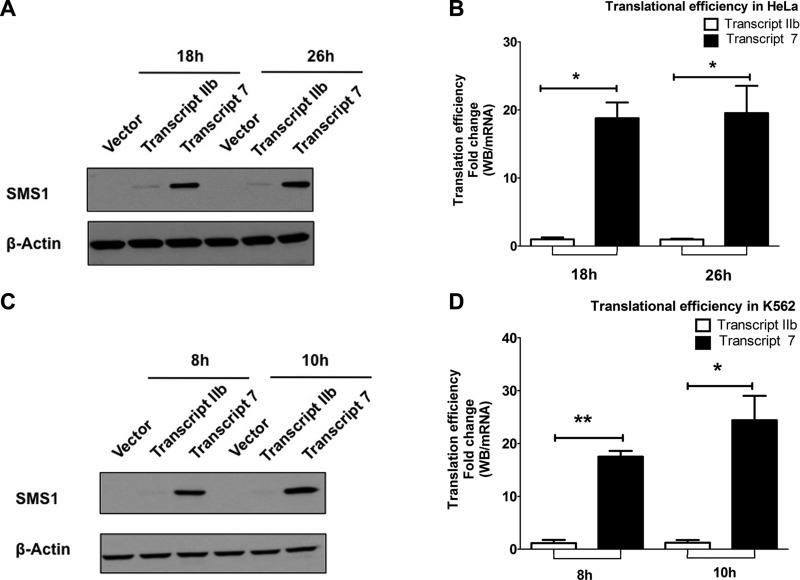
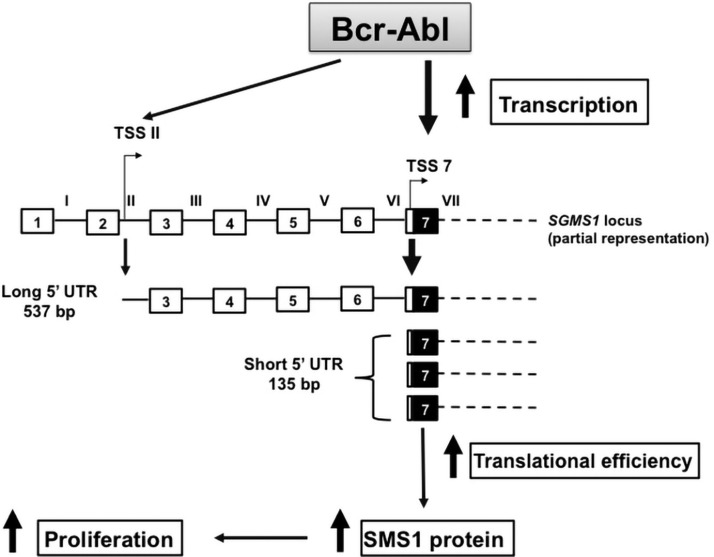
Bcr-Abl (break-point cluster region-abelson), the oncogenic trigger of chronic myelogenous leukemia (CML), has previously been shown to up-regulate the expression and activity of sphingomyelin synthase 1 (SMS1), which contributes to the proliferation of CML cells; however, the mechanism by which this increased expression of SMS1 is mediated remains unknown. In the current study, we show that Bcr-Abl enhances the expression of SMS1 via a 30-fold up-regulation of its transcription. Of most interest, the Bcr-Abl-regulated transcription of SMS1 is initiated from a novel transcription start site (TSS) that is just upstream of the open reading frame. This shift in TSS utilization generates an SMS1 mRNA with a substantially shorter 5' UTR compared with its canonical mRNA. This shorter 5' UTR imparts a 20-fold greater translational efficiency to SMS1 mRNA, which further contributes to the increase of its expression in CML cells. Therefore, our study demonstrates that Bcr-Abl increases SMS1 protein levels via 2 concerted mechanisms: up-regulation of transcription and enhanced translation as a result of the shift in TSS utilization. Remarkably, this is the first time that an oncogene-Bcr-Abl-has been demonstrated to drive such a mechanism that up-regulates the expression of a functionally important target gene, SMS1.-Moorthi, S., Burns, T. A., Yu, G.-Q., Luberto, C. Bcr-Abl regulation of sphingomyelin synthase 1 reveals a novel oncogenic-driven mechanism of protein up-regulation.

Keywords: alternative TSS; cancer; transcription; translation; translation efficiency.


Conflict of interest statement

The authors thank Dr. Paola Signorelli (Department of Health Sciences, University of Milan, Milan, Italy) and Dr. Daniella Ishimaru (Medical University of South Carolina) for expert advice. The authors also thank Dr. Can Senkal and Dr. Yusuf Hannun (both of the Department of Medicine and Cancer Center at Stony Brook University) for critical input when writing the manuscript. The authors thank the Stony Brook DNA Sequencing facility for timely assistance. This work was supported by U.S. National Institutes of Health, National Cancer Institute Grant P01-CA097132 (to C. L. for Project #4) and the Stony Brook Scholars in Biomedical Sciences Award (to S. M.). The authors declare no conflicts of interest.

Figures

Figure 1
Figure 1
SGMS1 is transcriptionally up-regulated in K562 cells. A, B) SGMS1 transcription was assessed by quantifying hnRNA by qRT-PCR. Primers that targeted intron VII and exon 8 (primer sequences provided in Supplemental Table 1) were used to quantify hnRNA expression, normalized to β-actin and expressed as MNE. Primer locations are indicated on the SGMS1 locus (white boxes represent untranslated exons, black boxes represent translated exons, and lines represent introns). Negative control for cDNA synthesis (without superscript III) in K562 showed no amplification, thus verifying the absence of genomic DNA. Results from 3 independent experiments are shown. C) K562 and HL-60 cells were treated with vehicle (H2O) or actinomycin D (5 μg/ml) over a 2-h time course. SGMS1 mRNA abundance was measured at different times by qRT-PCR using primers within exon 7 (primer sequences provided in Supplemental Table 1) to quantify the percent of remaining mRNA. D) K562 cells were treated with imatinib (1 μM) for 8 h. Cells were harvested and lysates were prepared for Western blot analysis. Total STAT5 and pSTAT5 levels were measured in control and treated cells. E) In control and imatinib-treated cells, RNA was extracted to measure hnRNA levels of SGMS1. Intron VII and exon 8–specific RT-PCR primers were used. Results represent 3 independent experiments. ND, not detectable; SSIII, superscript III. *P < 0.05, ***P < 0.0005.
Figure 2
Figure 2
Bcr-Abl up-regulates SGMS1 transcription and shifts transcription initiation. Transcriptional up-regulation of SGMS1 was verified by qRT-PCR of hnRNA (normalized to β-actin) using 2 primer pairs, 1 designed to span within intron V (white arrows and white bars), the other pair across the junction of intron VII and exon 8 (black arrows and black bars; primer sequences are provided in Supplemental Table 1) in HL-60, HL-60-Bcr-Abl, K562, LAMA-84, and JURL-MK-1 cells. Approximate primer locations are indicated on the SGMS1 locus. Results represent 3 independent experiments. *P < 0.05, **P < 0.005, ***P < 0.0005.
Figure 3
Figure 3
Identification of SGMS1 TSSs in K562 cells. A) Representation of the 5′ RLM-RACE products of SGMS1. Five different transcript variants were identified and annotated on the basis of the location of transcription initiation site—that is, TSS I, TSS II, TSS VI, and TSS 7. Gene-specific primers within exon 7 (black arrow) and exon 6 (white arrow) that were used to perform the 5′ RLM-RACE in K562 cells are indicated above the respective exons. Results are representative of 2 independent 5′ RLM-RACE experiments (sequences of clones are given in Supplemental Table 2). B) Graphical representation of the 4 TSSs that were identified by 5′ RLM-RACE positioned on the SGMS1 locus. Large white boxes with α-numerals represent annotated exons, straight connecting solid lines with Roman numerals represent annotated introns, and small white boxes represent new first exons identified by 5′ RLM-RACE. Solid/dashed connector lines correspond to potential splicing events that result in mature transcripts.
Figure 4
Figure 4
SGMS1 is transcriptionally up-regulated via TSS 7 in CML cells. A) Representation of primers used for FEP analysis to quantify the transcriptional abundance from each TSS. Black arrows (facing each other, above each new first exon) represent the location of primers at each new first exon (primer sequences are provided in Supplemental Table 1). B) Abundance of mRNA from each TSS was measured by using the FEP method in Bcr-Abl–positive cells (K562, LAMA-84, and JURL-MK-1). Expression of mRNA was normalized to β-actin and expressed as MNE. C) Stability of mRNA of the different transcripts in K562 cells. Cells were treated with vehicle (H2O) or actinomycin D (5 μg/ml) for different intervals over a 4-h time course (described in Materials and Methods). Abundance of mRNA was measured by FEP to quantify the percent of remaining mRNA. Results represent 3 independent qRT-PCR experiments. There is no significant difference in the stability of different SGMS1 transcripts. The SGMS1 locus is graphically represented (white boxes represent untranslated exons, black boxes represent translated exons, and lines represent introns). *P < 0.05, **P < 0.005.
Figure 5
Figure 5
Bcr-Abl transforms the transcriptional landscape of SGMS1. A) Bar graph displays qRT-PCR data of hnRNA abundance with primers at intron I, II, and V and intron VII–exon 8 in Bcr-Abl–positive (K562 and HL-60-Bcr-Abl) and negative (HL-60) cells. Shown below the bar graph are the (approximate) regions on the SGMS1 locus targeted by primers used (primer sequences are provided in Supplemental Table 1) and the position of the different TSSs that were identified in K562 cells. Results represent 3 independent qRT-PCR experiments. B) Graphical representation of the transcriptional landscape of SGMS1 in Bcr-Abl–positive vs. –negative cells. Arrows indicate the utilization of different TSSs in Bcr-Abl–positive and –negative cells with fold abundance compared with TSS II in HL-60 cells, as quantified from qRT-PCR data. The SGMS1 locus is graphically represented (white boxes represent untranslated exons, black boxes represent translated exons, and lines represent introns). **P < 0.005, ***P < 0.0005.
Figure 6
Figure 6
Identification of a promoter upstream of TSS 7 and its regulation by Bcr-Abl. A) A stretch of 832 bp upstream of TSS 7 was isolated from K562 genomic DNA and cloned into the pGL3-basic vector to assess promoter activity (construct sequence is provided in Supplemental Table 3). HL-60, HL-60-Bcr-Abl, and K562 cells were transfected with 5 μg each of the promoter 7 pGL3 construct or pGL3-basic vector and 5 μg pCMV β-galactosidase plasmid vectors (transfection control). Promoter activity was measured by luciferase activity normalized to β-galactosidase (β-gal) activity, subtracted from the vector activity, and expressed as relative luciferase units (RLU). Results represent 3 independent experiments. B) K562 cells were cotransfected with 1.5 μg of the promoter 7 pGL3 or 1.5 μg of pGL3-basic vector and 5 μg of pCMV β-galactosidase plasmid, then treated with 1 μM imatinib for 8 h. Cells were then analyzed for promoter activity. *P < 0.05, **P < 0.005, ***P < 0.0005.
Figure 7
Figure 7
SGMS1 mRNA from TSS 7 is translated more efficiently. A) Representative Western blot of SMS1 protein in HeLa cells that overexpress either transcript IIb or transcript 7 (upper; sequences are provided in Supplemental Table 4) and β-actin (lower). B) Translational efficiency of the 2 transcripts was calculated by dividing the intensity of the Western blot band over mRNA at 10 and 26 h post-transfection. mRNA was quantified by using transcript-specific primers as in FEP. C) Representative Western blot of SMS1 protein in K562 cells that overexpress either transcript IIb or transcript 7 (upper) and β-actin (lower). D) Translational efficiency of the 2 transcripts was calculated by dividing the intensity of the Western blot band over mRNA at 8 and 10 h post-transfection. mRNA was quantified by using transcript-specific primers. All results represent 3 independent experiments. *P < 0.05, **P < 0.005, ***P < 0.0005.
Figure 8
Figure 8
Model for the regulation of SMS1 expression by Bcr-Abl. Bcr-Abl up-regulates SGMS1 mRNA by promoting transcription mostly from 2 alternative TSSs, TSS II and TSS 7; however, in Bcr-Abl–positive cells, the maximum transcription of SGMS1 occurs from TSS 7. mRNA from TSS 7 is characterized by a comparatively shorter 5′ UTR (135 bp), which is devoid of translational inhibitory features that are present in the longer SGMS1 5′ UTR found in Bcr-Abl–negative HL-60 cells. The Bcr-Abl–induced TSS 7 transcript is therefore translated more efficiently, which results in an additional increase of the SMS1 protein. Overall, Bcr-Abl exponentially enhances the expression of SGSM1 by up-regulating the transcription of a specific SGMS1 mRNA isoform that is translated more efficiently. Increased SGMS1 expression supports Bcr-Abl–mediated proliferation (1). Of note, the SGMS1 locus is represented up to exon 7, beyond which the mRNA structure is represented as dashed lines and is assumed to be identical for both transcripts shown. The SGMS1 locus is graphically represented (white boxes represent untranslated exons, black boxes represent translated exons, and lines represent introns).

Similar articles

Cited by

References

    1. Huitema K., van den Dikkenberg J., Brouwers J. F., Holthuis J. C. (2004) Identification of a family of animal sphingomyelin synthases. EMBO J. 23, 33–44 - PMC - PubMed
    1. Yamaoka S., Miyaji M., Kitano T., Umehara H., Okazaki T. (2004) Expression cloning of a human cDNA restoring sphingomyelin synthesis and cell growth in sphingomyelin synthase-defective lymphoid cells. J. Biol. Chem. 279, 18688–18693 - PubMed
    1. Bernert J. T., Jr., Ullman M. D. (1981) Biosynthesis of sphingomyelin from erythro-ceramides and phosphatidylcholine by a microsomal cholinephosphotransferase. Biochim. Biophys. Acta 666, 99–109 - PubMed
    1. Hatch G. M., Vance D. E. (1992) Stimulation of sphingomyelin biosynthesis by brefeldin A and sphingomyelin breakdown by okadaic acid treatment of rat hepatocytes. J. Biol. Chem. 267, 12443–12451 - PubMed
    1. Marggraf W. D., Anderer F. A., Kanfer J. N. (1981) The formation of sphingomyelin from phosphatidylcholine in plasma membrane preparations from mouse fibroblasts. Biochim. Biophys. Acta 664, 61–73 - PubMed

Publication types

MeSH terms