. 2018 Jul 1;315(1):E110-E125.
doi: 10.1152/ajpendo.00392.2017. Epub 2018 Mar 13.

β-Actin shows limited mobility and is required only for supraphysiological insulin-stimulated glucose transport in young adult soleus muscle

Affiliations

β-Actin shows limited mobility and is required only for supraphysiological insulin-stimulated glucose transport in young adult soleus muscle

Agnete B Madsen et al. Am J Physiol Endocrinol Metab. .

Abstract

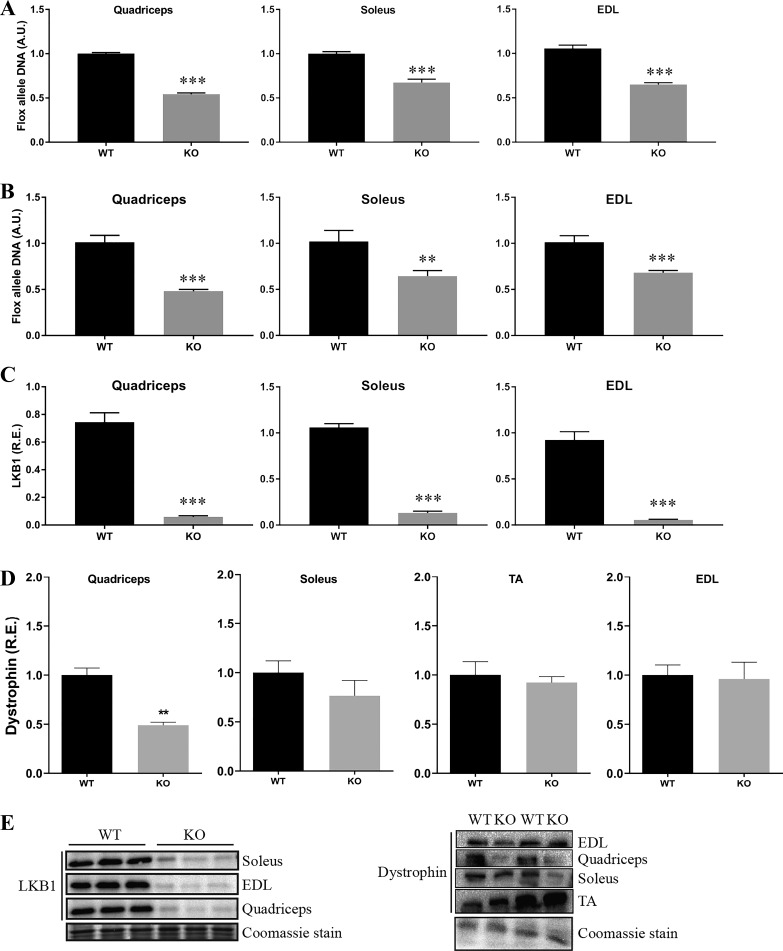
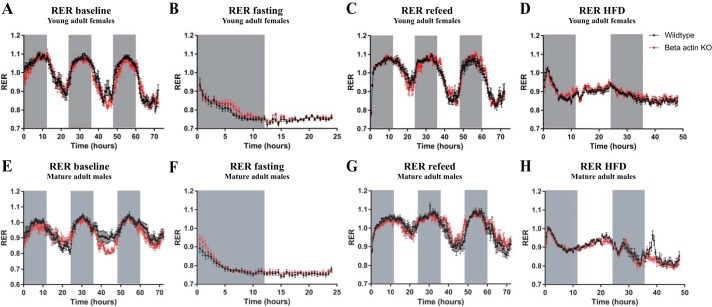
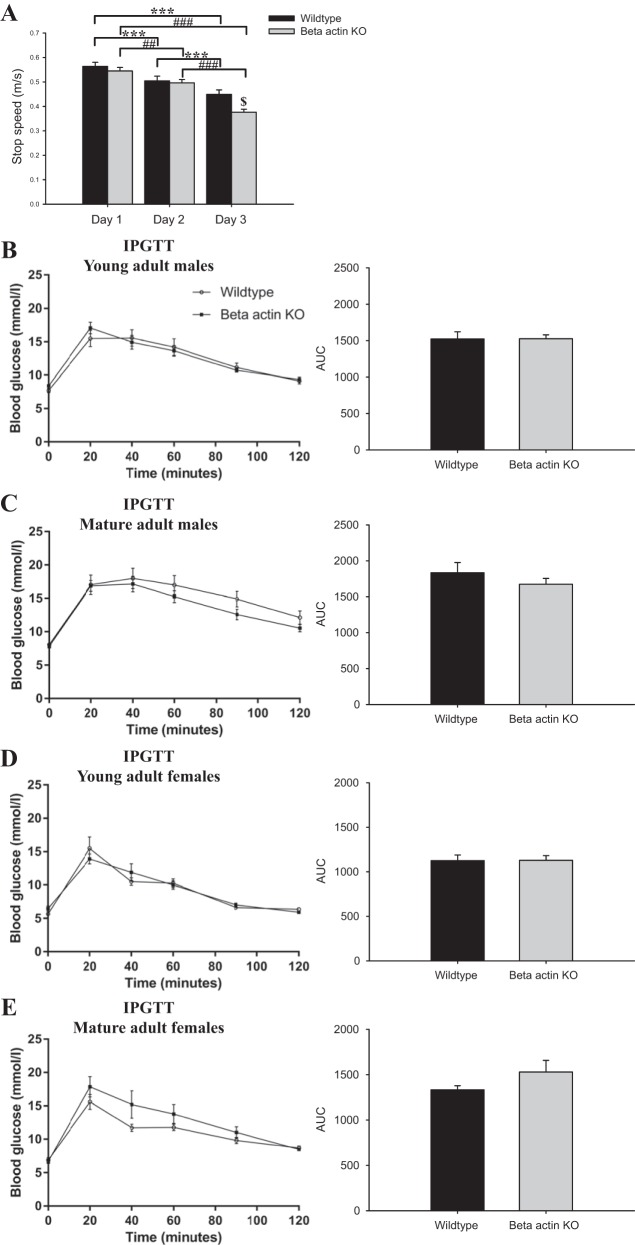
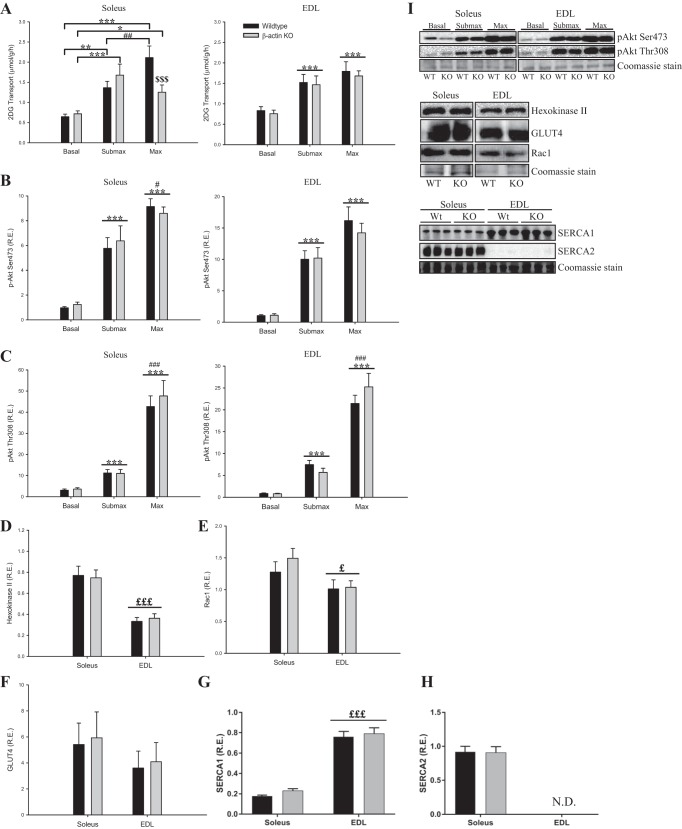
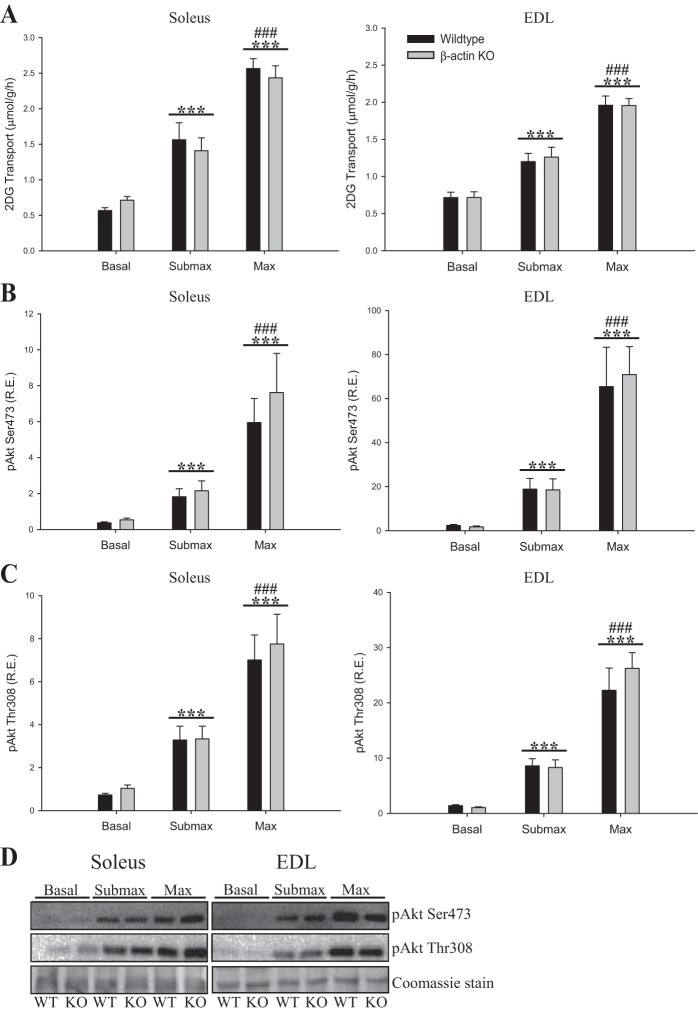
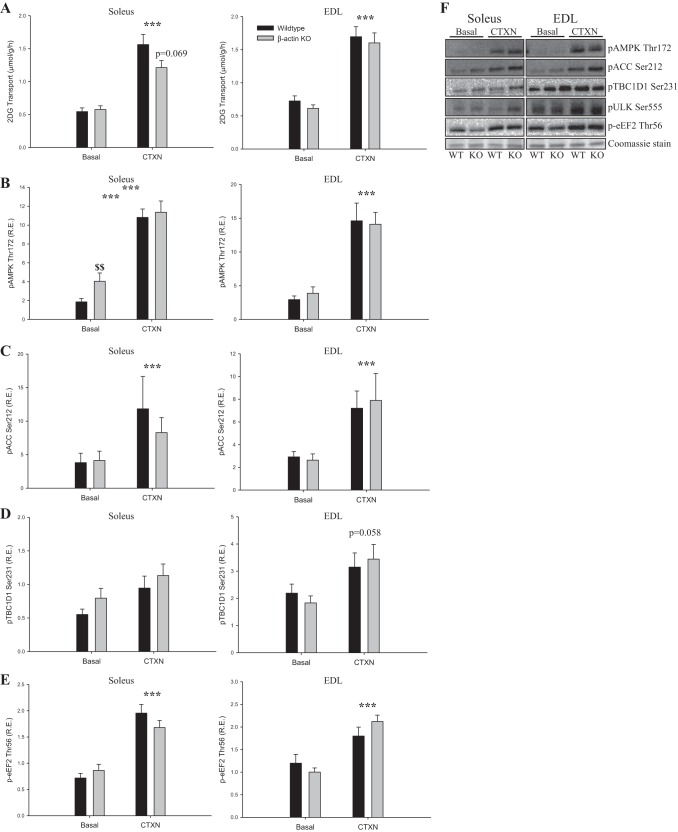
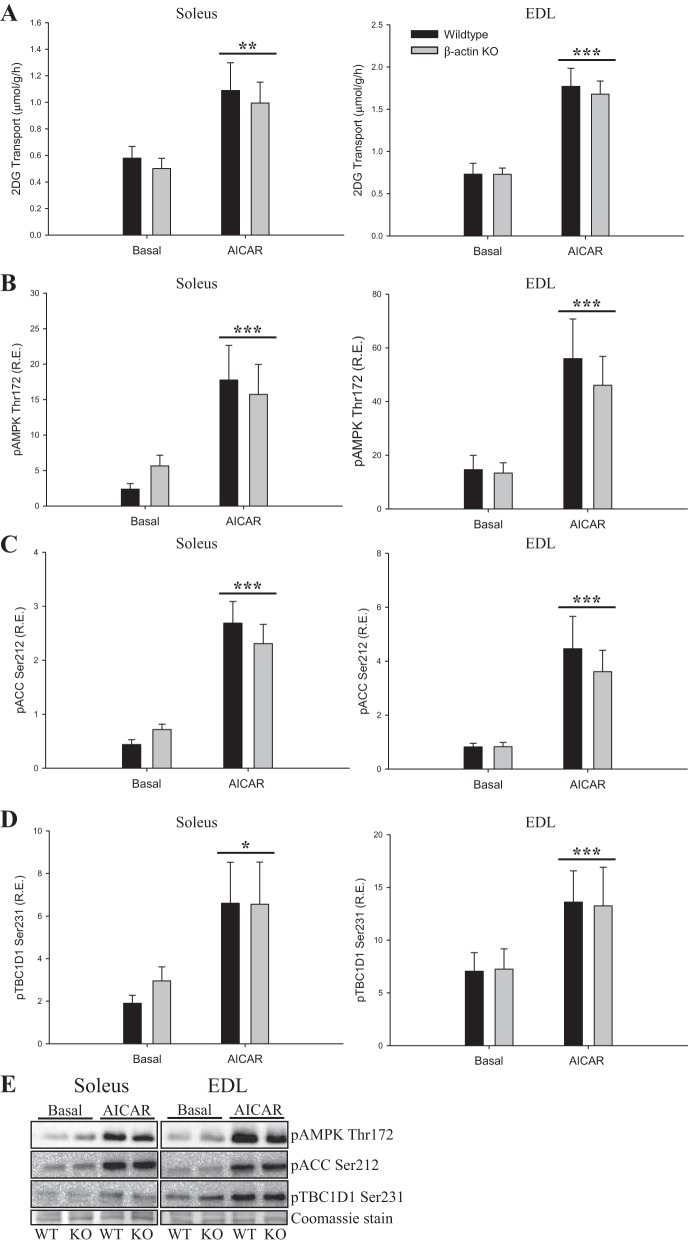
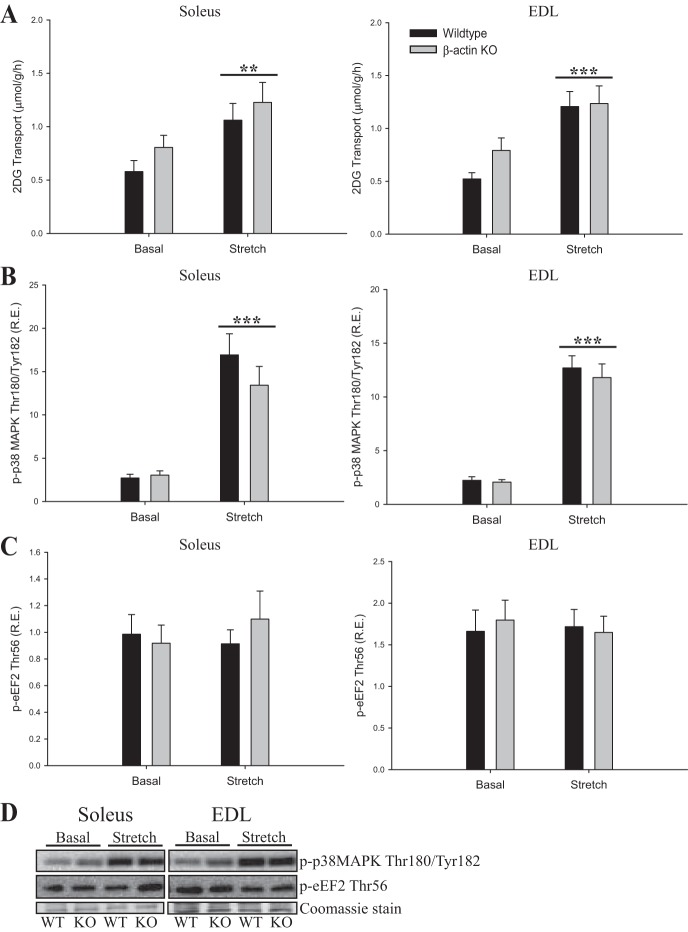
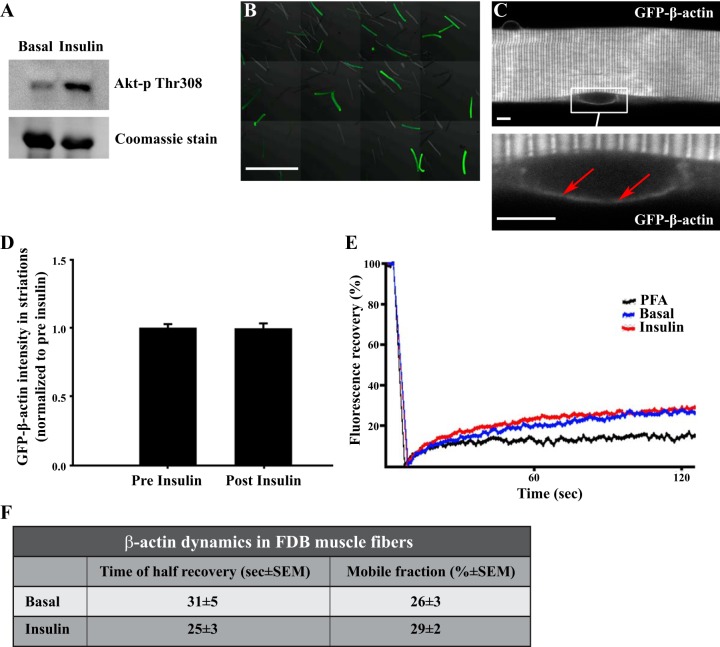
Studies in skeletal muscle cell cultures suggest that the cortical actin cytoskeleton is a major requirement for insulin-stimulated glucose transport, implicating the β-actin isoform, which in many cell types is the main actin isoform. However, it is not clear that β-actin plays such a role in mature skeletal muscle. Neither dependency of glucose transport on β-actin nor actin reorganization upon glucose transport have been tested in mature muscle. To investigate the role of β-actin in fully differentiated muscle, we performed a detailed characterization of wild type and muscle-specific β-actin knockout (KO) mice. The effects of the β-actin KO were subtle; however, we confirmed the previously reported decline in running performance of β-actin KO mice compared with wild type during repeated maximal running tests. We also found insulin-stimulated glucose transport into incubated muscles reduced in soleus but not in extensor digitorum longus muscle of young adult mice. Contraction-stimulated glucose transport trended toward the same pattern, but the glucose transport phenotype disappeared in soleus muscles from mature adult mice. No genotype-related differences were found in body composition or glucose tolerance or by indirect calorimetry measurements. To evaluate β-actin mobility in mature muscle, we electroporated green fluorescent protein (GFP)-β-actin into flexor digitorum brevis muscle fibers and measured fluorescence recovery after photobleaching. GFP-β-actin showed limited unstimulated mobility and no changes after insulin stimulation. In conclusion, β-actin is not required for glucose transport regulation in mature mouse muscle under the majority of the tested conditions. Thus, our work reveals fundamental differences in the role of the cortical β-actin cytoskeleton in mature muscle compared with cell culture.

Keywords: actin cytoskeleton; glucose transport; insulin; skeletal muscle; β-actin.


Figures

Fig. 1.
Fig. 1.
Verification of the β-actin knockout (KO) genotype. A: quantification of the flox allele in quadriceps, soleus, and extensor digitorum longus (EDL) muscles of wild-type (WT) and β-actin KO mice; n = 7–9 mice. All values are shown as means ± SE; ***P < 0.001. B: quantification of the flox allele in quadriceps, soleus, and EDL muscles of WT and liver kinase B1 (LKB1) KO mice; n = 4–6 mice. All values are shown as means ± SE; **P = 0.019, ***P ≤ 0.001. C: quantification of LKB1 protein expression in quadriceps, soleus, and EDL muscle lysates of WT and LKB1 KO mice; n = 5–7. All values are shown as means ± SE; ***P < 0.001. D: quantification of dystrophin protein expression in soleus, tibialis anterior (TA), quadriceps, and EDL muscle lysates of young adult WT and β-actin KO mice; n = 3–4. All values are shown as means ± SE; **P = 0.003. E: representative blots of quantified proteins in C and D. Coomassie staining is used as loading control. R.E., relative expression to WT; A.U., arbitrary units.
Fig. 2.
Fig. 2.
β-Actin KO mice display no whole body metabolic phenotype. Respiratory exchange ratio (RER) during baseline (72 h), fasting (24 h), refeed (72 h), and high-fat diet (HFD; 48 h) conditions were measured in young adult (8–13 wk old; A–D) female and mature adult (18–23 wk old; E–H) male mice; n = 8. Measurements were obtained in both young and mature adult male and female mice, showing the same pattern in both sexes with no genotype-related differences. Gray bars indicate dark hours. Values shown are means ± SE.
Fig. 3.
Fig. 3.
No differences in glucose tolerance, but β-actin KO mice display decreased running performance. A: young adult female mice were subjected to a maximal running test each day for 3 days. Maximal running speed is denoted as stop speed (m/s; n = 8–10). Values\shown are means ± SE; ***P ≤ 0.001 within WT; ###P ≤ 0.001, ##P = 0.016 within KO; $P = 0.005, genotype difference. Young adult (B) and mature adult (C) male mice were fasted for 5 h and injected with 2 g/kg body wt d-glucose; n = 10. Blood glucose was measured after 0, 20, 40, 60, 90, and 120 min. Young adult (D) and mature adult (E) female mice were subjected to a similar protocol, n = 9–10. Area under the curve (AUC) of blood glucose is calculated from 1 to 120 min and shown as means ± SE. Young adult mice, 8–13 wk old; mature adult mice, 18–23 wk old.
Fig. 4.
Fig. 4.
2-Deoxyglucoes (2-DG) transport and insulin signaling during submaximal and maximal insulin stimulation in young adult mice. A: insulin-stimulated 2-DG transport during submaximal (soleus 1.8 nM, EDL 3 nM) and maximal (60 nM) insulin concentrations in soleus and EDL muscles from young adult (8–13 wk old) WT and β-actin KO mice. Akt Ser473 (B) and Akt Thr308 (C) phosphorylation in soleus and EDL muscles from young adult WT and β-actin KO mice, as well as total protein expression of hexokinase II (D), Rac1 (E), GLUT4 (F), sarco/endoplasmic reticulum Ca2+-ATPase (SERCA1; G) and SERCA2 (H) in soleus and EDL muscles from WT and β-actin KO mice; n = 10–15. I: representative blots of quantified proteins. Coomassie staining was used as loading control. All values shown are means ± SE; *P < 0.05, ***P < 0.001 vs. basal; #P < 0.05, ##P < 0.01, ###P < 0.001 max vs. submax insulin; $$$P < 0.001 genotype difference; £P < 0.05, £££P < 0.001 soleus vs. EDL.
Fig. 5.
Fig. 5.
2-DG transport and insulin signaling during submaximal and maximal insulin stimulation in mature adult mice. A: insulin-stimulated 2-DG transport during submaximal (soleus 1.8 nM, EDL 3 nM) and maximal (60 nM) insulin concentrations in soleus and EDL muscles from mature adult (18–23 wk old) WT and β-actin KO mice. Akt Ser473 (B) and Akt Thr308 (C) phosphorylation in soleus and EDL muscles from mature adult WT and β-actin KO mice; n = 12 for submaximal insulin and n = 19–21 for maximal insulin stimulation. D: representative blots of Akt Ser473 and Akt Thr308 protein phosphorylation in soleus and EDL muscles of mature adult WT and β-actin KO mice. Coomassie staining is used as loading control. All values shown are means ± SE; ***P < 0.001 vs. basal; ###P < 0.001 max vs. submax insulin.
Fig. 6.
Fig. 6.
2-DG transport during electrically stimulated contraction (CTXN) and contraction-mediated signaling in young adult mice. A: contraction-stimulated 2-DG transport during electrical stimulation in soleus and EDL muscles from young adult (8–13 wk old) WT and β-actin KO mice. AMP-activated protein kinase(AMPK) Thr172 (B), acetyl-CoA carboxylase (ACC) Ser212 (C), TBC1 domain family member 1 (TBC1D1) Ser231 (D), and eukaryotic elongation factor 2 (eEF2) Thr56 (E) phosphorylation in soleus and EDL muscles from young adult WT and β-actin KO mice. F: representative blots of AMPK Thr172, ACC Ser212, TBC1D1 Ser231, and eEF2 Thr56 protein phosphorylation in soleus and EDL muscles of young adult WT and β-actin KO mice; n = 28–29. Coomassie staining is used as loading control. All values shown are means ± SE; ***P < 0.001 vs. basal; $$P < 0.01 genotype difference.
Fig. 7.
Fig. 7.
2-DG transport during 5-aminoimidazole-4-carboxamide ribonucleotide (AICAR) stimulation and AICAR-mediated signaling in young adult mice. A: AICAR-stimulated (4 mM) 2-DG transport in soleus and EDL muscles from young adult (8–13 wk old) WT and β-actin KO mice. AMPK Thr172 (B), ACC Ser212 (C), and TBC1D1 Ser231 (D) phosphorylation in soleus and EDL muscles from young adult WT and β-actin KO mice; n = 12. E: representative blots of AMPK Thr172, ACC Ser212, and TBC1D1 Ser231 protein phosphorylation in soleus and EDL muscles of young adult WT and β-actin KO mice. Coomassie staining is used as loading control. All values shown are means ± SE; *P < 0.05, **P < 0.01, ***P < 0.001 vs. basal.
Fig. 8.
Fig. 8.
2-DG transport during passive stretch stimulation and stretch-mediated signaling in young adult mice. A: stretch-stimulated (130 mN) 2-DG transport in soleus and EDL muscles from young adult (8–13 wk old) WT and β-actin KO mice. p38 mitogen-activated protein kinase (MAPK) Thr180/Tyr182 (B), and eEF2 Thr56 (C) phosphorylation in soleus and EDL muscles from young adult WT and β-actin KO mice. No increase in eEF2 phosphorylation indicates that the muscles were not stretched excessively, which otherwise might lead to Ca2+ influx through the plasma membrane; n = 16. D: representative blots of p-p38 MAPK Thr180/Tyr180 and p-eEF2 Thr56 protein phosphorylation in soleus and EDL muscles of young adult WT and β-actin KO mice. Coomassie staining is used as loading control. All values shown are mean ± SE; **P < 0.01, ***P < 0.001 vs. basal.
Fig. 9.
Fig. 9.
A fraction of GFP-β-actin is mobile but not affected by insulin stimulation. A: Akt Thr308 phosphorylation in overnight-cultered flexor digitorum brevis (FDB) single fibers with and without 30 min of prior insulin stimulation (60 nM). B: overview of live single fibers isolated from a p-EGFP-actin-transfected FDB muscle. Bar = 1 mm. C: GFP-β-actin structure in successfully transfected live single fiber. Top: characteristic striated pattern, which was observed throughout the core of the fibers. Bottom: GFP-β-actin in the region surrounding a nucleus (arrows). Bar = 5 µm. D: GFP-β-actin intensity accumulation in striations relative to total GFP-β-actin intensity in live single fibers before and 10 min after insulin stimulation (60 nM); n = 3. E: average fluorescence recovery curve after photobleaching (FRAP) of FDB fibers with and without 30 min of prior insulin stimulation (60 nM); n = 41–43 from 3 independent experiments. As a negative control, fibers (n = 17) were fixed before the FRAP experiment. F: mean time of half recovery and mobile fraction from recovery curves fitted using a single-term exponential equation, as described in Ref. ; n = 41–43 from 3 independent experiments. All values shown are means ± SE.

Similar articles

Cited by

References

    1. Balasubramanian S, Mani SK, Kasiganesan H, Baicu CC, Kuppuswamy D. Hypertrophic stimulation increases beta-actin dynamics in adult feline cardiomyocytes. PLoS One 5: e11470, 2010. doi:10.1371/journal.pone.0011470. - DOI - PMC - PubMed
    1. Balteau M, Tajeddine N, de Meester C, Ginion A, Des Rosiers C, Brady NR, Sommereyns C, Horman S, Vanoverschelde JL, Gailly P, Hue L, Bertrand L, Beauloye C. NADPH oxidase activation by hyperglycaemia in cardiomyocytes is independent of glucose metabolism but requires SGLT1. Cardiovasc Res 92: 237–246, 2011. doi:10.1093/cvr/cvr230. - DOI - PubMed
    1. Banas K, Clow C, Jasmin BJ, Renaud JM. The KATP channel Kir6.2 subunit content is higher in glycolytic than oxidative skeletal muscle fibers. Am J Physiol Regul Integr Comp Physiol 301: R916–R925, 2011. doi:10.1152/ajpregu.00663.2010. - DOI - PubMed
    1. Bengtsson T, Orselius K, Wetterö J. Role of the actin cytoskeleton during respiratory burst in chemoattractant-stimulated neutrophils. Cell Biol Int 30: 154–163, 2006. doi:10.1016/j.cellbi.2005.10.017. - DOI - PubMed
    1. Bergeron SE, Zhu M, Thiem SM, Friderici KH, Rubenstein PA. Ion-dependent polymerization differences between mammalian beta- and gamma-nonmuscle actin isoforms. J Biol Chem 285: 16087–16095, 2010. doi:10.1074/jbc.M110.110130. - DOI - PMC - PubMed

Publication types

MeSH terms