. 2018 Mar 12;33(3):512-526.e8.
doi: 10.1016/j.ccell.2018.02.003.

Loss of KDM6A Activates Super-Enhancers to Induce Gender-Specific Squamous-like Pancreatic Cancer and Confers Sensitivity to BET Inhibitors

Affiliations

Loss of KDM6A Activates Super-Enhancers to Induce Gender-Specific Squamous-like Pancreatic Cancer and Confers Sensitivity to BET Inhibitors

Jaclyn Andricovich et al. Cancer Cell. .

Abstract

KDM6A, an X chromosome-encoded histone demethylase and member of the COMPASS-like complex, is frequently mutated in a broad spectrum of malignancies and contributes to oncogenesis with poorly characterized mechanisms. We found that KDM6A loss induced squamous-like, metastatic pancreatic cancer selectively in females through deregulation of the COMPASS-like complex and aberrant activation of super-enhancers regulating ΔNp63, MYC, and RUNX3 oncogenes. This subtype of tumor developed in males had concomitant loss of UTY and KDM6A, suggesting overlapping roles, and points to largely demethylase independent tumor suppressor functions. We also demonstrate that KDM6A-deficient pancreatic cancer is selectively sensitive to BET inhibitors, which reversed squamous differentiation and restrained tumor growth in vivo, highlighting a therapeutic niche for patient tailored therapies.

Keywords: COMPASS-like complex; JQ1; KDM6A; KMT2D; MYC; UTY; p63; pancreatic cancer; squamous; super-enhancer.


Conflict of interest statement

DECLARATION OF INTERESTS

The authors declare no competing interests.

Figures
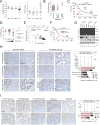
Figure 1
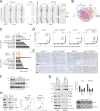
Figure 1. Mutations and genomic losses of KDM6A in poorly differentiated and squamous-like pancreatic cancer
(A) Scatter dot plots showing the z-score normalized expression of KDM6A and TP63 in the Immunogenic (IMG), Pancreatic Progenitor (PP), Aberrantly Differentiated Endocrine Exocrine (ADEX), and Squamous (SQ) subtypes of pancreatic cancer in the Australian Pancreatic Cancer Cohort (PACA_AU). (B) Scatter dot plot showing the z-score normalized expression of TP63 in the TCGA-PAAD cohort in samples stratified based on KDM6A copy number variations (CNV). Red circles and squares denote samples carrying deep deletions and mutations of KDM6A, respectively. (C) Kaplan-Meier plot showing the overall survival of patients in the TCGA-PAAD cohort stratified based on TP63 expression. Median survival is shown in brackets. n, number of patients. HR, Hazard Ratio; CI, Confidence Interval. (D) Scatter dot plot showing UTY expression in tumors in male patients stratified based on TP63 expression. Tumors carrying mutations or genomic deletions of UTY (blue), KDM6A (red) or both (green) loci are highlighted. (E) Schematic showing the genomic locus of UTY and the position of cg04448376 probe that detects the methylation of a CpG island in its promoter (top). Scatter plot showing the correlation between UTY expression and methylation of the CpG island (bottom). (F) Patients in the TCGA-PAAD cohort were stratified based on the presence (red) or absence (black) of mutations or genomic deletions of KDM6A and UTY in their tumors. Median survival is shown in brackets. n, number of patients. HR, Hazard Ratio; CI, Confidence Interval. (G) RT-PCR (top) and western blots (bottom) showing the expression of KDM6A and p63 in the indicated cell lines. LOY: Loss of Y chromosome. (H, I) Left: Representative images of IHC for KDM6A in TMA representing different stages of pancreatic cancer progression (H) and histology (I). Right: contingency tables and stacked bar graphs showing the staining intensity of KDM6A. Significance was determined by a chi-square test; L, Liver; n.s., non-significant. Scale bar 200 µm (100 µm inset in (H)). Data in (A), (B), and (D) are presented as mean ± SEM. **, p < 0.01 and ***, p < 0.001 as determined by one-way ANOVA and followed by Tukey’s multiple comparison test. See also Figure S1 and Table S1.
Figure 2
Figure 2. A gender-specific tumor suppressor role for Kdm6a
(A) Kaplan-Meier plots showing the survival of Kdm6a mutant mice in Pdx1Cre;KrasG12D (left) and Ptf1αCre;KrasG12D (right) cohorts. Asterisks denote animals in control arms that were not terminally ill, but were euthanized because they presented with enlarged abdomen that would compromise their ability to move and feed. Median survival is shown in brackets. n, number of mice. (B) H&E staining of murine pancreata isolated from male and female mice of the indicated genotypes and ages from the Ptf1αCre;KrasG12D cohort. Arrows point to low-grade lesions. Scale bar 200 µm. (C, D) Tumors of the indicated gender and genotype from the Ptf1αCre;KrasG12D cohort were stained for Amylase, Alcian Blue, and Sirius Red in (C), and p63 in (D). Scale bar 200 µm. See also Figure S2.
Figure 3
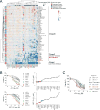
Figure 3. Loss of Kdm6a activates gene expression programs favoring squamous and quasi-mesenchymal differentiation
(A) Heatmap showing the pairwise comparison (Pearson’s rank correlation) of gene expression profiles from indicated genotypes of the Ptf1αCre;KrasG12D cohort. (B) IPA of differentially expressed genes in female Ptf1αCre;KrasG12D wild-type and Kdm6a null tumors. The x axis corresponds to the raw binomial p values. (C) Bar graphs showing the relative expression (mean ± SD) of the indicated transcripts (left) and cell morphology (right) of cell lines established from female pancreata of the indicated genotypes from the Ptf1αCre;KrasG12D cohort. Squamous-like (SQ) and QM cell lines formed irregular islets comprised of relatively large polygonal and small fibroblast-looking cells, respectively, as opposed to classical PDA cell lines driven by KrasG12D which formed well-defined islets made of flat round cells. The cell lines are color coded based on the expression of markers of SQ and QM differentiation. Scale bar 200 µm. (D) Western blots showing the expression of ΔNp63 isoform in Kdm6a null females and a male cell line with concomitant loss of Uty. (E) Composite heatmap showing the genome-wide distribution and signal intensity of H3K4me3 and H3K27me3 in Ptf1αCre;KrasG12D wild-type and Kdm6a null pancreatic cancer cell lines. Each horizontal line represents the normalized signal intensity for a gene over its transcription start site (TSS). A ± 10 kb window is shown for each TSS. The grayscale bar shows the normalized signal intensity (RPKM, reads per kb per million mapped reads). Right: heatmap shows the genome-wide binding of KDM6A in Ptf1αCre;KrasG12D female. The color scale bar shows the relative binding intensity. Regions were sorted in ascending order of H3K27me3. (F) Read density profiles of H3K4me3 and H3K27me3 over the TSS ± 10 kb. The y axis shows the mean RPKM. (G) IPA of genes with de novo bivalent promoters in Kdm6a knockout female. The x axis corresponds to the raw binomial p value. See also Figure S3.
Figure 4
Figure 4. Loss of Kdm6a activates super-enhancers linked to genes encoding transcription factors that drive squamous and quasi-mesenchymal differentiation
(A) Composite heatmap showing the distribution and signal intensity of H3K4me1, KMT2D, KDM6A, and H3K27ac over SE in Ptf1αCre;KrasG12D wild-type and Kdm6a null cell lines. K-means clustering (K = 6) was performed based on the H3K27ac signal that defines active SE. Each horizontal line represents the normalized signal intensity over a SE. A ± 100 kb window is shown for each SE. The grayscale bar shows the normalized signal intensity (RPKM, reads per kb per million mapped reads). Right: color heatmap showing the normalized H3K27ac signal and highlights SE that are selectively rewired in knockout females. (B) Venn diagram showing the overlap of genes associated with active SE in the indicated cell lines from the Ptf1αCre;KrasG12D cohort. (C) Canonical pathway and upstream regulator IPA of genes associated with de novo SE in both genders. The x axis corresponds to the raw binomial p value. (D) Rank ordering of SE based on the normalized H3K27ac signal intensity. The positions of SE linked to Myc, Tp63, and Runx3 as well as the SE that ranks first in each cell line are indicated. (E, F) IHC (E) and western blot (F) showing MYC levels in murine tumors of the indicated gender and genotype of the Ptf1αCre;KrasG12D cohort. Scale bar 200 µm, inset 50 µm (bottom). (G) 1 × 10⁶ L3.6PL and MIAPACA cells were electroporated with constructs expressing wild-type or mutant (H1146A/E1148A) KDM6A, or UTY, or with empty vector. The bulk of the cells were plated for western blotting (left) whereas 5 × 10⁴ cells were plated for proliferation assays in triplicate (right). The bar graph shows the number of cells (mean ± SD) after six days. Representative images of colonies stained with crystal violet are shown (bottom). *, p < 0.05 and **, p < 0.01 as determined by two-tailed unpaired Student's t-test for each condition compared to the control. (H) L3.6PL and MIAPACA were infected with lentiviruses expressing short hairpins targeting p63 and MYC. Left: Western blots showing the knockdown efficiency. Right: 5 × 10⁴ cells were plated in triplicate and passaged every three days. The line graph showing the cumulative number of cells (mean ± SD) for the duration of the experiment. See also Figure S4.
Figure 5
Figure 5. KDM6A deficient pancreatic cancer cell lines are sensitive to BET inhibitors
(A) Heatmap showing the sensitivity of 17 human pancreatic cancer cell lines treated for 72 hr with 0.5 and 5 µM of compounds. KDM6A null (red) and EP300/KMT2D mutant (green) cell lines are highlighted. Euclidean distance was used for row and column clustering. The color bar shows the normalized effect of compounds on cell viability (blue = inhibit and red = stimulate) compared to cells treated with DMSO. (B) Estimation of JQ1 (top) and iBET-151 (bottom) IC50 values for human pancreatic cancer cell lines treated in triplicate with a range of concentrations [0.3125 to 20 µM]. Data points showing cell viability (mean ± SEM) from duplicates. KDM6A null (MIAPACA and L3.6PL), EP300 (BXPC3), and KMT2D (HUPT4) mutant cell lines are highlighted. (C) Estimation of JQ1 IC50 values for murine cell lines. The average IC50 values (mean ± SD) are shown from two independent cell line preparations for each genotype. See also Figure S5.
Figure 6
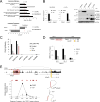
Figure 6. JQ1 disrupts long range interaction between the ΔNp63 promoter and super-enhancer to reverse squamous differentiation
(A) Canonical pathways (top) and upstream regulator (bottom) IPA of differentially expressed genes in MIAPACA and L3.6PL cells after treatment with 500 nM of JQ1 for 24 hr. Top: the x axis corresponds to the raw binomial p values. Bottom: the x axis shows normalized z-scores > 2 and p overlap values < 0.01. (B) qRT-PCR (left) and western blots (right) of the indicated cell lines treated with 500 nM JQ1 for 24 hr. Bar graphs showing the relative expression (mean ± SD) of TP63 isoforms from two independent experiments. (C) Expression of TP63 in HUPT4 (KMT2D mutant) and MIAPACA (KDM6A null) treated with 200 nM JQ1 for 2 and 24 hr. Raw data from GSE63782. (D) BRD4 ChIP in L3.6PL cells treated with 500 nM JQ1 for 24 hr. The bar graph shows the relative enrichment (mean ± SD) over the control (IgG) in the SE and promoter of ΔNp63 from two independent experiments. (E) Chromosome Conformation Capture (3C) in L3.6PL cells treated with either vehicle or 500 nM JQ1 for 24 hr. The H3K27ac track (GSE90110) shows the enrichment over the TPRG1-TP63 locus, and shaded boxes highlight the SE (pink) and promoter (yellow); the HindIII fragments tested as regions of interest (red stripes) are depicted above the H3K27ac track (top). The graph shows the contact frequency between the SE within the TPRG1 locus and the ΔNp63 promoter. Data points in the contact matrix show the mean of duplicates ± SD from two independent 3C library preparations. The schematic (right) shows disruption of the interaction between the SE and ΔNp63 promoter upon JQ1 treatment. See also Figure S6.
Figure 7
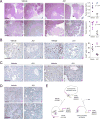
Figure 7. JQ1 restrains Kdm6a null pancreatic cancer and reverses squamous differentiation in vivo
(A) Littermate pairs of male (n = 4) and female (n = 6) Ptf1αCre;KrasC12D;Kdm6anull mice were treated with JQ1 (50 mg/kg) or vehicle control starting at three weeks of age, every three days for five doses. Scale bar 500 µm. Right: Scatter dot plots show the average tumor area (mean ± SEM). Each dot represents a mouse. (B) IHC for Ki-67 in Ptf1αCre;KrasC12D;Kdm6anull mice treated with JQ1. The scatter dot plot shows the number of Ki-67 positive cells (mean ± SEM) in vehicle and JQ1 treated female knockout mice. Three different tumor areas were analyzed from two independent littermate pairs (black and gray dots). Scale bar 100 µm. (C, D) IHC for MYC (C) and p63 (D) in JQ1-treated Ptf1αCre;KrasG12D;Kdm6anull mice. Scale bar 100 µm in (C) and 200 µm (100 µm inset) in (D). (E) Loss of KDM6A in the context of the KRAS oncogene induces squamous-like pancreatic cancer through activation of SE that regulate the ΔNp63, MYC, and RUNX3 oncogenes. Treatment with JQ1 disrupts long range SE-promoter interactions to restore pancreatic cell identity. See also Figure S7.

Comment in

References

    1. Agger K, Cloos PA, Christensen J, Pasini D, Rose S, Rappsilber J, Issaeva I, Canaani E, Salcini AE, Helin K. UTX and JMJD3 are histone H3K27 demethylases involved in HOX gene regulation and development. Nature. 2007;449:731–734. - PubMed
    1. Andricovich J, Kai Y, Peng W, Foudi A, Tzatsos A. Histone demethylase KDM2B regulates lineage commitment in normal and malignant hematopoiesis. The Journal of clinical investigation. 2016;126:905–920. - PMC - PubMed
    1. Bailey P, Chang DK, Nones K, Johns AL, Patch AM, Gingras MC, Miller DK, Christ AN, Bruxner TJ, Quinn MC, et al. Genomic analyses identify molecular subtypes of pancreatic cancer. Nature. 2016;531:47–52. - PubMed
    1. Bardi G, Johansson B, Pandis N, Mandahl N, Bak-Jensen E, Andren-Sandberg A, Mitelman F, Heim S. Karyotypic abnormalities in tumours of the pancreas. British journal of cancer. 1993;67:1106–1112. - PMC - PubMed
    1. Barretina J, Caponigro G, Stransky N, Venkatesan K, Margolin AA, Kim S, Wilson CJ, Lehar J, Kryukov GV, Sonkin D, et al. The Cancer Cell Line Encyclopedia enables predictive modelling of anticancer drug sensitivity. Nature. 2012;483:603–607. - PMC - PubMed

Publication types