. 2018 Jun 1;128(6):2252-2265.
doi: 10.1172/JCI96765. Epub 2018 Apr 23.

Mutant ataxin1 disrupts cerebellar development in spinocerebellar ataxia type 1

Affiliations

Mutant ataxin1 disrupts cerebellar development in spinocerebellar ataxia type 1

Chandrakanth Reddy Edamakanti et al. J Clin Invest. .

Abstract

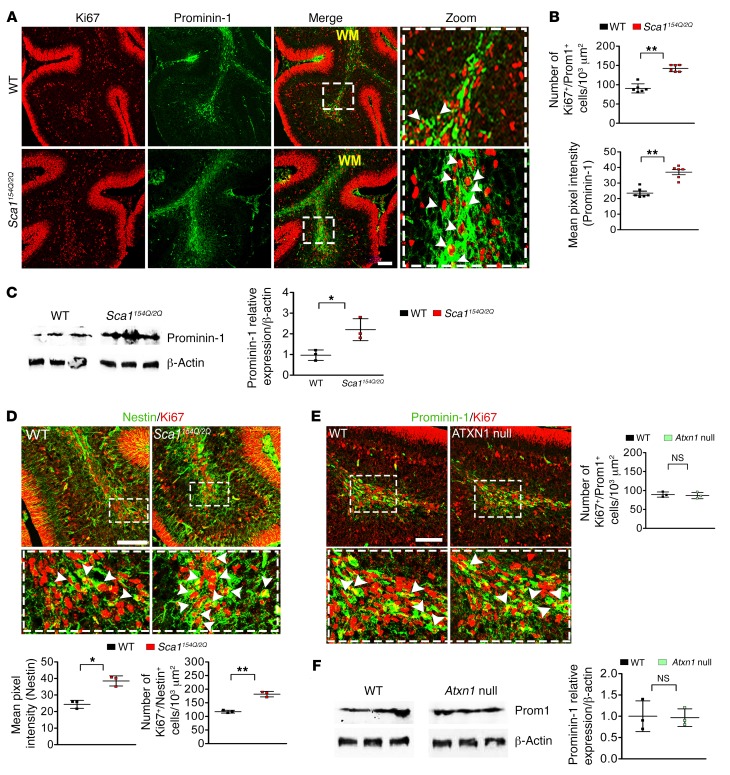
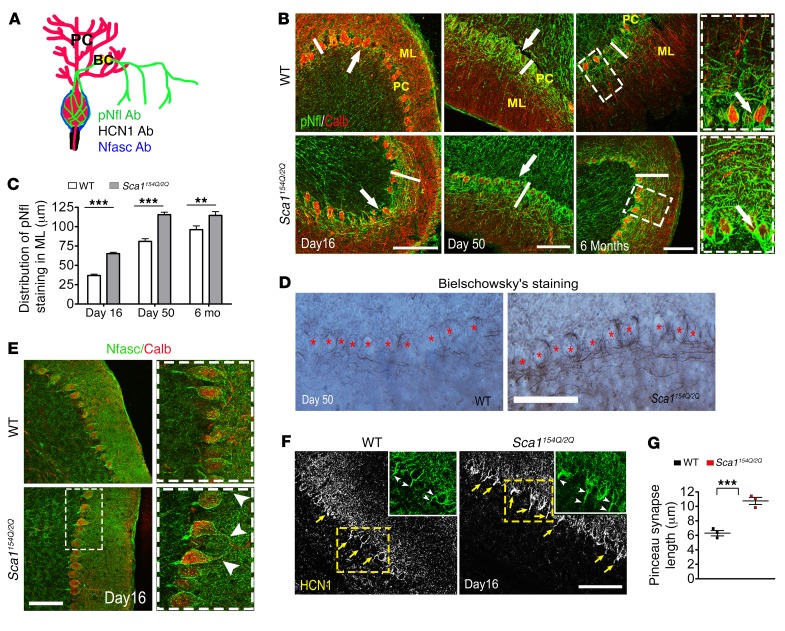
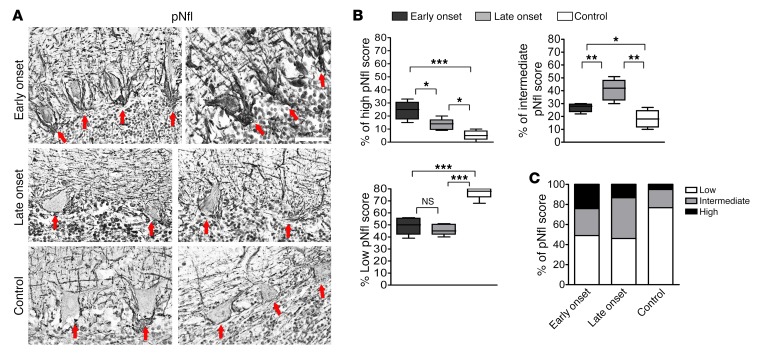
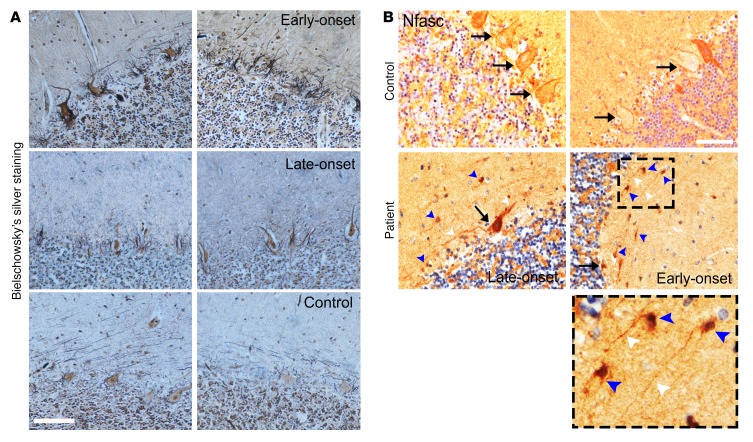
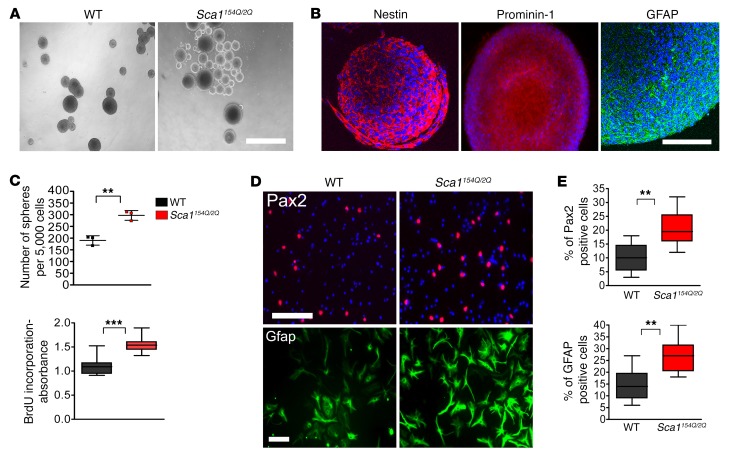
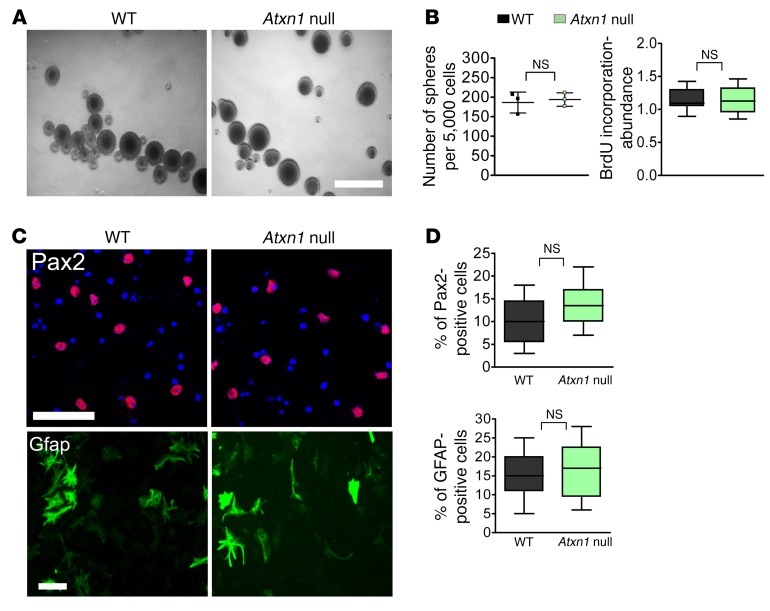
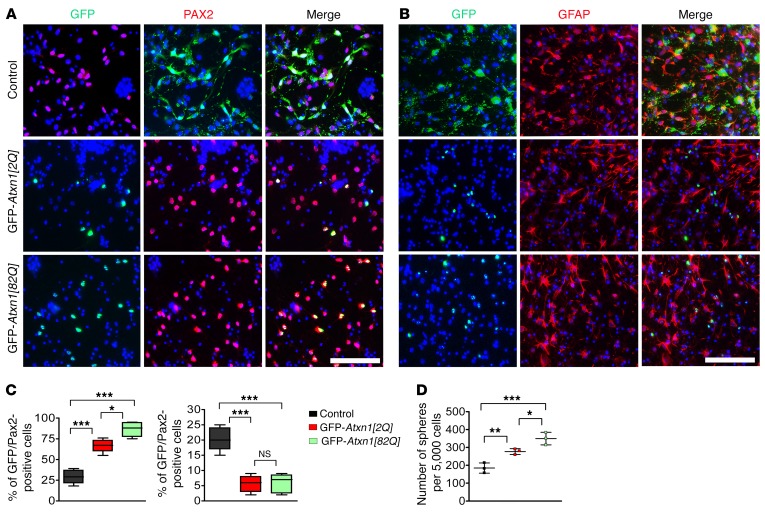
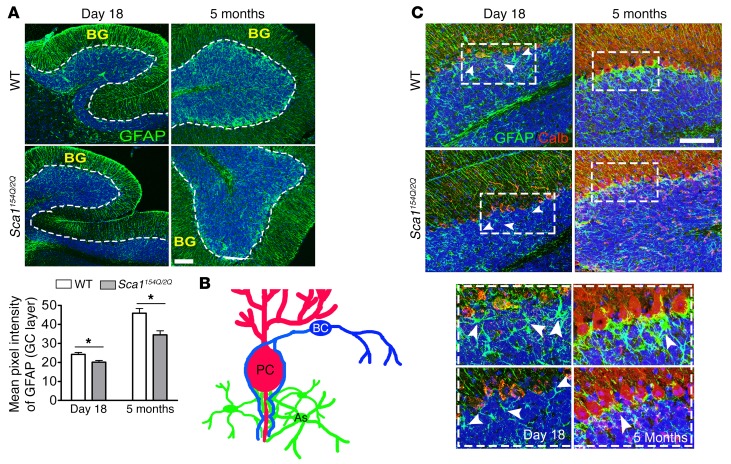
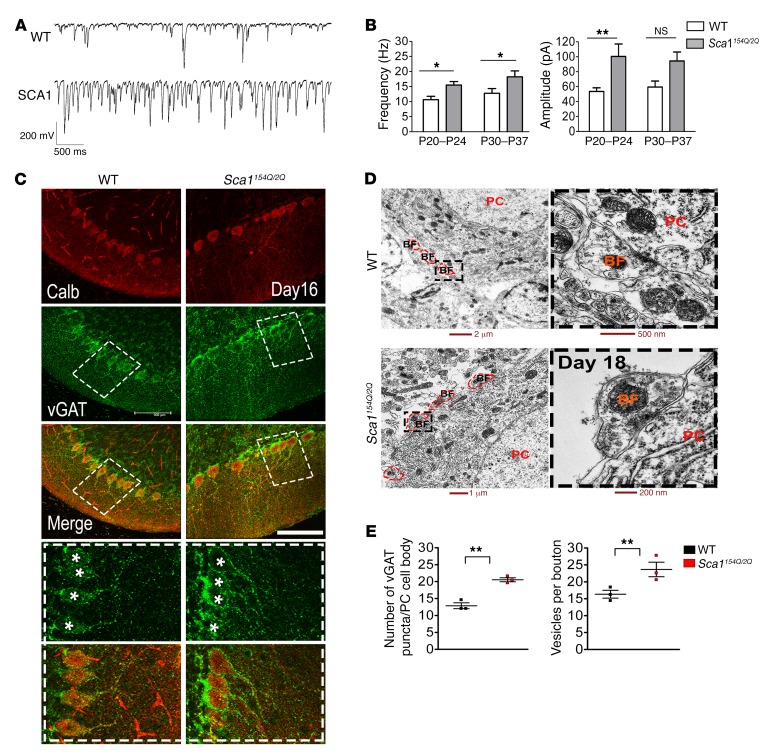
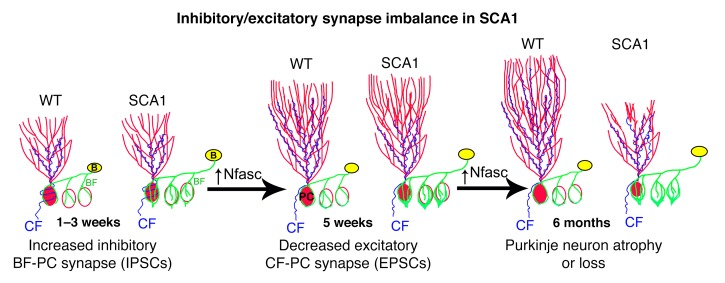
Spinocerebellar ataxia type 1 (SCA1) is an adult-onset neurodegenerative disease caused by a polyglutamine expansion in the protein ATXN1, which is involved in transcriptional regulation. Although symptoms appear relatively late in life, primarily from cerebellar dysfunction, pathogenesis begins early, with transcriptional changes detectable as early as a week after birth in SCA1-knockin mice. Given the importance of this postnatal period for cerebellar development, we asked whether this region might be developmentally altered by mutant ATXN1. We found that expanded ATXN1 stimulates the proliferation of postnatal cerebellar stem cells in SCA1 mice. These hyperproliferating stem cells tended to differentiate into GABAergic inhibitory interneurons rather than astrocytes; this significantly increased the GABAergic inhibitory interneuron synaptic connections, disrupting cerebellar Purkinje cell function in a non-cell autonomous manner. We confirmed the increased basket cell-Purkinje cell connectivity in human SCA1 patients. Mutant ATXN1 thus alters the neural circuitry of the developing cerebellum, setting the stage for the later vulnerability of Purkinje cells to SCA1. We propose that other late-onset degenerative diseases may also be rooted in subtle developmental derailments.

Keywords: Neurodegeneration; Neurological disorders; Neuronal stem cells; Neuroscience; Stem cells.


Conflict of interest statement

Conflict of interest: The authors have declared that no conflict of interest exists.

Figures

Figure 1
Figure 1. Mutant ATXN1 increases proliferation and enlarges the population of cerebellar stem cells at P7 in Sca1154Q/2Q mice.
(A) Ki67 (red) and prominin-1 (green) staining show that SCA1 mice have greater cerebellar stem cell proliferation than WT controls at P7. Scale bar: 100 μm. n = 6 pairs of mice. (B) Quantification of prominin-1/Ki67 double-positive cells and intensity of prominin-1. (C) Western blot analysis and quantification show greater prominin-1 expression in SCA1 cerebella than in WT littermates. n = 3 independent mouse samples loaded in each lane for each genotype. See complete unedited blots in the Supplemental Figure 8. (D) We used Ki67 (red) and nestin (green) staining as an independent measure of cerebellar stem cell number and proliferation. Scale bar: 50 μm. n = 3 pairs of mice. (E) Atxn1–/– cerebellar sections costained with Ki67 (red) and prominin-1 (green) show numbers of double-positive cells similar to those in WT cerebella. Scale bar: 50 μm. n = 3 pairs of mice. Arrowheads indicate double-positive cells in A, D, and E. (F) Western blot analysis and quantification show that prominin-1 expression in Atxn1–/– cerebella is similar to that of WT cerebella. n = 3 independent mouse samples loaded in each lane for each genotype; lanes loaded onto same gel. See complete unedited blots in the Supplemental Figure 8. *P < 0.05, **P < 0.01, 2-tailed unpaired Student’s t test. Original magnification ×40 in A, D, and E.
Figure 2
Figure 2. Exaggerated BC phenotype in Sca1154Q/2Q mice.
(A) Schematic depicting BC (red) morphology with antibodies. Regions of BCs stained: pNfl (BC axonal and dendritic processes: green); HCN1 (Pinceau: black); Nfasc (PC somata and BC axonal ends: blue). (B and C) pNfl staining highlights profuse BC arborization around PCs (stained with calbindin) in the molecular layer of SCA1 cerebella at P16, P50, and 6 months of age. Arrows point to BC arbors surrounding PC soma; white bars mark the extent of BC collaterals extending into the molecular layer. n = 4 pairs of mice. (D) Representative images of Bielschowsky’s silver–stained cerebella from SCA1 and WT mice. SCA1 mice show prominent BC axonal processes around PCs when compared with WT. Asterisks represent PC soma. (E) Nfasc staining (green) is intensified at the junction of BC axonal endings and PC soma (arrowheads). n = 3 pairs of mice. (F) HCN1 staining of cerebellar sections at P16 revealed that the SCA1 mice show exaggerated pinceau formation (arrows) compared with controls. (G) Quantification of the length of pinceau (distance between 2 arrowheads) using HCN1 staining. n = 3 pairs of mice. **P < 0.01; ***P < 0.001, 2-tailed unpaired Student’s t test. Scale bars: 100 μm. Original magnification ×40 in B, E, and F.
Figure 3
Figure 3. Brain tissue from human SCA1 patients with longer CAG repeat tracts shows denser BCs.
(A) Representative images of cerebella from SCA1 patients and controls stained with pNfl. Photos are representative of 12 SCA1 patients; the samples come from patients with early onset and late-onset disease, as noted. Scale bar: 100 μM. (B) Quantification of pNfl score showing the percentage of low, intermediate, and high BC scores; 100 BCs/sample were counted. (C) Stacked bar graph shows the percentage of low, intermediate, and high BC scores of early onset, late-onset, and control cerebella. *P < 0.05; **P < 0.01; ***P < 0.001, 2-way ANOVA with Bonferroni’s post hoc test.
Figure 4
Figure 4. SCA1 patients show denser axonal processes and upregulated Nfasc expression in BCs.
(A) Representative images of cerebellar tissue from SCA1 patients and controls stained with Bielschowsky’s silver staining. Early onset patients show very dense BC axonal processes compared with late-onset patients, and control cerebella show sparse axonal processes around PCs. n = 2 samples from each category (early onset, late onset, and control). (B) Representative images of Nfasc-stained cerebella from SCA1 patients and controls. SCA1 patient cerebella show more intense Nfasc staining in both PCs (arrows) and BCs (arrowheads) than those of controls, with the more severe mutations producing greater changes. Scale bars: 100 μm. n = 12 patients and 7 controls. Original magnification ×40 in B.
Figure 5
Figure 5. Sca1154Q/2Q cerebellar stem cells show increased proliferation and differentiation in vitro.
(A) Neurospheres derived from isolated prominin-1+ cerebellar stem cells of WT mice and SCA1 littermates. Scale bar: 100 μm. (B) Neurospheres express typical stem cell markers prominin-1, nestin, and GFAP. Scale bar: 50 μm. (C) The number of neurospheres derived from prominin-1–positive SCA1 cells is greater than that from WT controls; SCA1 cells also show greater BrdU uptake. n = 4 pairs of mice. (D and E) Differentiated cerebellar stem cells stained for GABAergic. Scale bars: 50 μm (Pax2); 100 μm (glial markers GFAP). SCA1 stem cells yield a greater number of both Pax2 and GFAP cells than WT stem cells. n = 3 pairs of mice. **P < 0.01; ***P < 0.001, 2-tailed unpaired Student’s t test.
Figure 6
Figure 6. Gain of ATXN1 function contributes to the abnormal cerebellar stem cell phenotype.
(A and B) Neurospheres derived from isolated prominin-1 stem cells of Atxn1–/– mice show proliferative capacity similar to that of WT stem cells. Scale bar: 100 μm. n = 3 pairs of mice. (C and D) Differentiated cerebellar stem cells stained for GABAergic. Scale bars: 50 μm (Pax2); 100 μm (glial markers GFAP). Atxn1–/– stem cells and WT stem cells resulted in a similar number of Pax2 and GFAP cells. n = 3 pairs of mice. Two-tailed unpaired Student’s t test.
Figure 7
Figure 7. ATXN1 determines the GABAergic and glial lineage specificity of cerebellar stem cells.
Differentiation of WT stem cells transduced with lentivirus particles expressing GFP, GFP-ATXN1[2Q], and GFP-ATXN1[82Q] constructs. (A) Mutant ATXN1 produced significantly more GABAergic precursors (revealed by Pax2 staining) and (B) fewer glial precursors (revealed by GFAP staining). (C) Quantification of both Pax2/GFP- and GFAP/GFP-positive cells. n = 3 independent experiments. (D) Number of neurospheres formed from WT stem cells that are transduced with lentiviral vectors expressing GFP (control), GFP-ATXN1[2Q], or GFP-ATXN1[82Q]. n = 3 pairs of mice. *P < 0.05; **P < 0.01; ***P < 0.001; 2-tailed unpaired Student’s t test. Scale bars: 100 μm.
Figure 8
Figure 8. Sca1154Q/2Q mice cerebella show fewer white matter astrocytes than WT.
(A) SCA1 cerebellum has less GFAP staining, indicating fewer velate astrocytes than WT cerebella, at P18 and 5 months. (B) Schematic showing that the majority of the PC AIS is covered by astrocyte (As) processes. (C) Costaining of cerebella (P18 and 5 months) with calbindin and GFAP shows the loss of connection between astrocytes and PC AIS (arrowheads). n = 3 pairs of mice. *P < 0.05, 2-tailed unpaired Student’s t test. Scale bars: 100 μm. Original magnification ×40 in B.
Figure 9
Figure 9. GABAergic inhibition of PCs is stronger in Sca1154Q/2Q mice.
(A and B) IPSC frequencies and amplitudes are higher in SCA1-knockin mice than in WT controls. n = 4 pairs of mice. (C) vGAT (green), which marks GABA vesicles, and calbindin (red), which marks PCs, shows SCA1 mouse cerebella have more GABAergic presynaptic terminals than WT controls (asterisks represent PC soma). Scale bar: 100 μm. n = 3 pairs of mice. Original magnification ×40 in C. (D) EM images show SCA1 BC boutons have greater vesicle density than WT boutons. Scale bars: 500 and 200 nm (Enlarged images of the boxed areas) 2 μm and 1 μm for lower magnification images. n = 3 pairs of mice. (E) Quantification of GABAergic presynaptic terminals and GABA vesicles. *P < 0.05; **P < 0.01, 2-tailed unpaired Student’s t test (E) and 2-way ANOVA with Bonferroni’s post hoc test (B). Scale bar: 100 μm (C).
Figure 10
Figure 10. Model of the development of inhibitory/excitatory imbalance in SCA1 cerebellum.
Increased GABAergic basket cell fibers innervations (green) from basket cells (‘B’/yellow ovals) onto PCs occurs during the first 3 postnatal weeks in SCA1 mice, followed by an increase in IPSCs in PCs at P20–P24 (Figure 9). A decrease in glutamatergic CF synapses (blue) occurs at 5 weeks (and is manifested in motor incoordination on the rotarod), followed by PC atrophy or loss (red). B, basket cells.

References

    1. Banfi S, et al. Identification and characterization of the gene causing type 1 spinocerebellar ataxia. Nat Genet. 1994;7(4):513–520. doi: 10.1038/ng0894-513. - DOI - PubMed
    1. Guo L, et al. A cellular system that degrades misfolded proteins and protects against neurodegeneration. Mol Cell. 2014;55(1):15–30. doi: 10.1016/j.molcel.2014.04.030. - DOI - PMC - PubMed
    1. Servadio A, Koshy B, Armstrong D, Antalffy B, Orr HT, Zoghbi HY. Expression analysis of the ataxin-1 protein in tissues from normal and spinocerebellar ataxia type 1 individuals. Nat Genet. 1995;10(1):94–98. doi: 10.1038/ng0595-94. - DOI - PubMed
    1. Watase K, et al. A long CAG repeat in the mouse Sca1 locus replicates SCA1 features and reveals the impact of protein solubility on selective neurodegeneration. Neuron. 2002;34(6):905–919. doi: 10.1016/S0896-6273(02)00733-X. - DOI - PubMed
    1. Seidel K, Siswanto S, Brunt ER, den Dunnen W, Korf HW, Rüb U. Brain pathology of spinocerebellar ataxias. Acta Neuropathol. 2012;124(1):1–21. doi: 10.1007/s00401-012-1000-x. - DOI - PubMed

Publication types