. 2018 Jun 1;128(6):2339-2355.
doi: 10.1172/JCI96208. Epub 2018 Apr 30.

Transient HIF2A inhibition promotes satellite cell proliferation and muscle regeneration

Affiliations

Transient HIF2A inhibition promotes satellite cell proliferation and muscle regeneration

Liwei Xie et al. J Clin Invest. .

Abstract

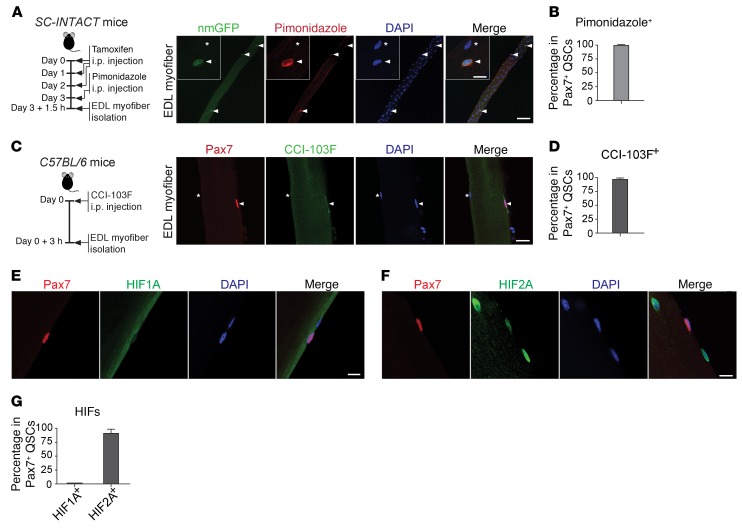
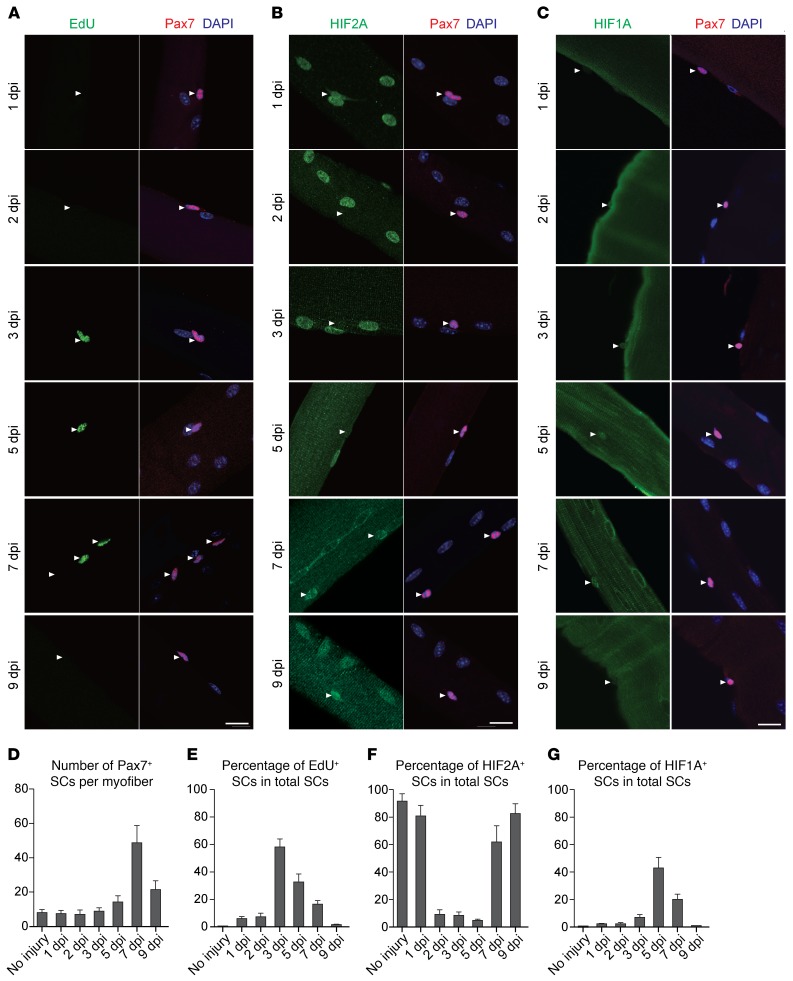
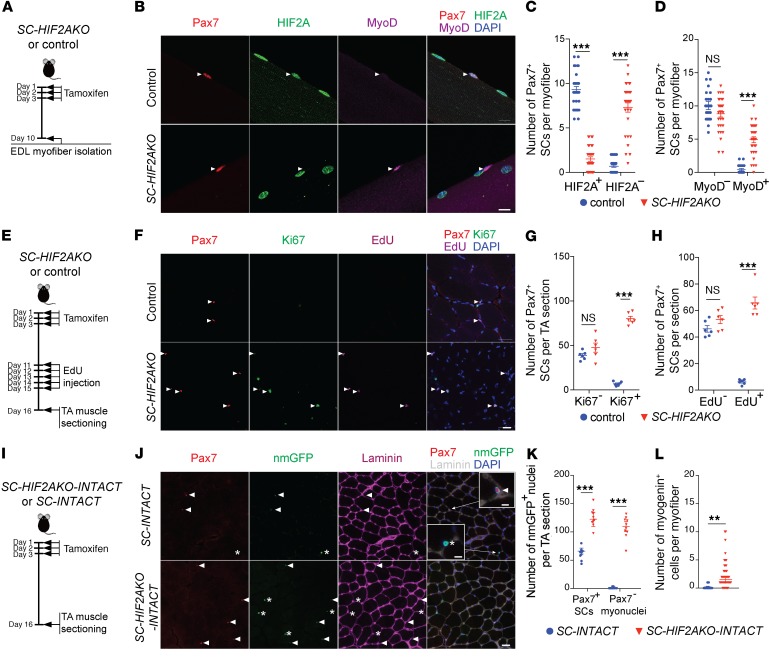
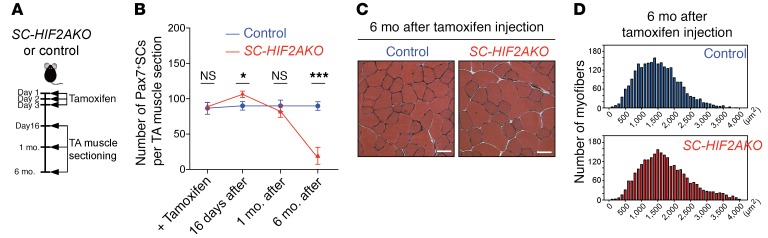
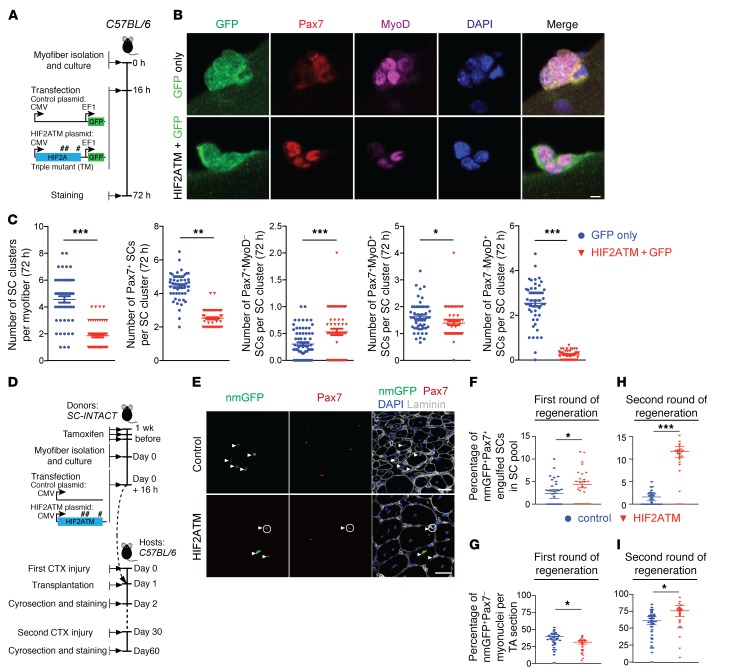
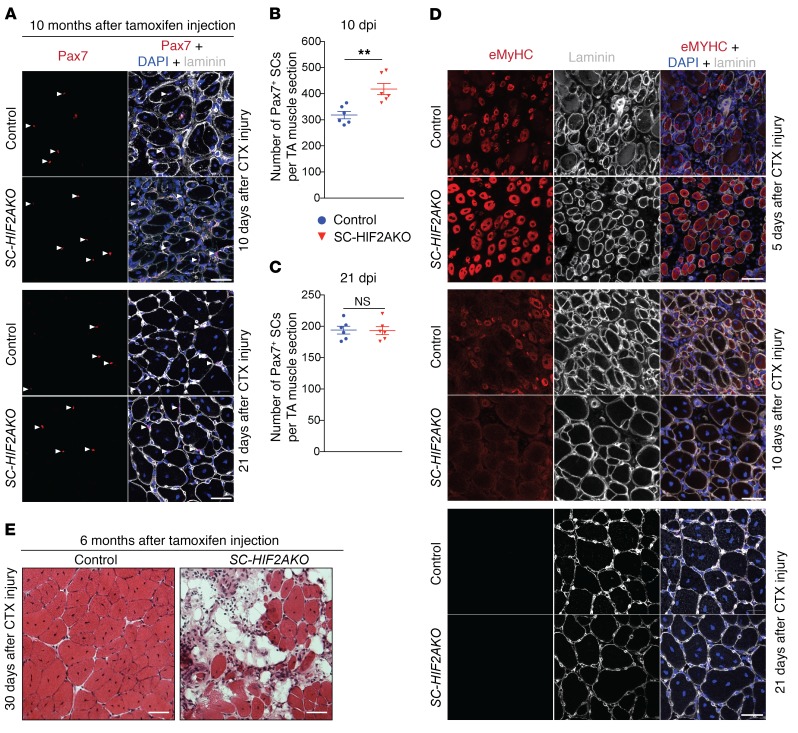
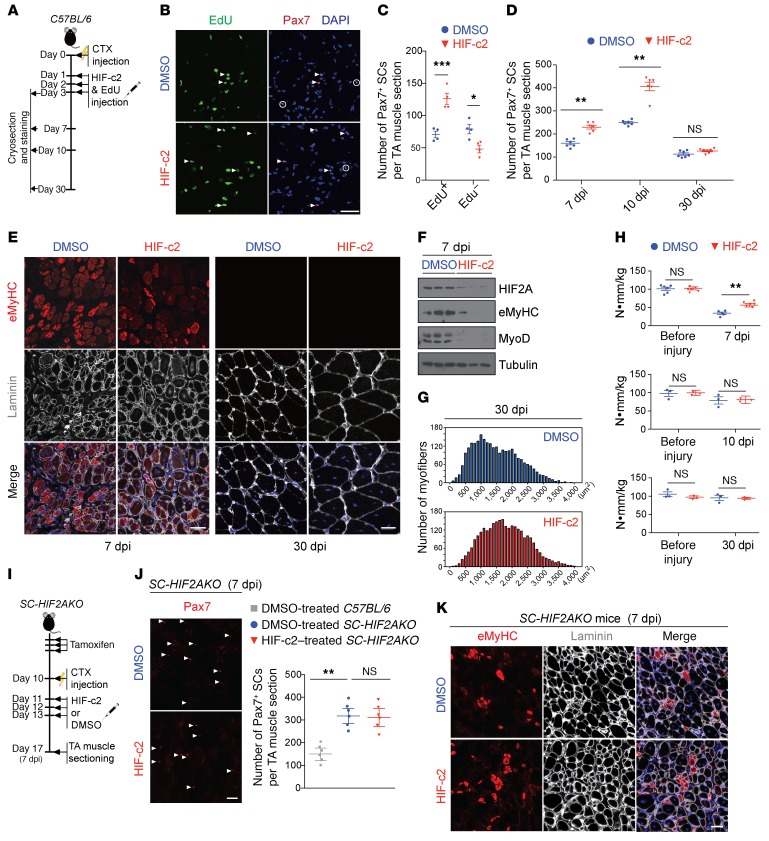
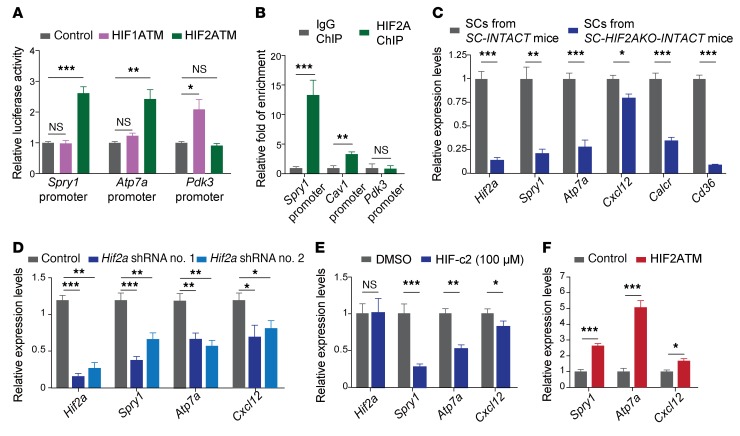
The remarkable regeneration capability of skeletal muscle depends on the coordinated proliferation and differentiation of satellite cells (SCs). The self-renewal of SCs is critical for long-term maintenance of muscle regeneration potential. Hypoxia profoundly affects the proliferation, differentiation, and self-renewal of cultured myoblasts. However, the physiological relevance of hypoxia and hypoxia signaling in SCs in vivo remains largely unknown. Here, we demonstrate that SCs are in an intrinsic hypoxic state in vivo and express hypoxia-inducible factor 2A (HIF2A). HIF2A promotes the stemness and long-term homeostatic maintenance of SCs by maintaining their quiescence, increasing their self-renewal, and blocking their myogenic differentiation. HIF2A stabilization in SCs cultured under normoxia augments their engraftment potential in regenerative muscle. Conversely, HIF2A ablation leads to the depletion of SCs and their consequent regenerative failure in the long-term. In contrast, transient pharmacological inhibition of HIF2A accelerates muscle regeneration by increasing SC proliferation and differentiation. Mechanistically, HIF2A induces the quiescence and self-renewal of SCs by binding the promoter of the Spry1 gene and activating Spry1 expression. These findings suggest that HIF2A is a pivotal mediator of hypoxia signaling in SCs and may be therapeutically targeted to improve muscle regeneration.

Keywords: Adult stem cells; Muscle Biology; Skeletal muscle; Stem cells.


Conflict of interest statement

Conflict of interest: The authors have declared that no conflict of interest exists.

Figures

Figure 1
Figure 1. QSCs are hypoxic in the niche and express HIF2A, but not HIF1A.
(A) Timeline of in vivo pimonidazole labeling in SC-INTACT mice and representative confocal images of uninjured/resting EDL myofibers (n >50 myofibers from n = 3 mice) showing that nmGFP+ QSCs were pimonidazole+. Scale bars: 50 μm and 10 μm (insets). Inset images show that pimonidazole signals were relatively enriched in the cytoplasm of QSCs. Arrowheads indicate a QSC; asterisks indicate a myonucleus. (B) Percentage of pimonidazole+ QSCs. (C) Timeline of in vivo CCI-103F labeling in C57BL/6 mice and representative images of uninjured/resting EDL myofibers (n >50 myofibers from 3 mice) showing that nmGFP+ QSCs were CCI-103F+. Arrowheads indicate a QSC; asterisks indicate a myonucleus. Scale bar: 20 μm. (D) Percentage of CCI-103F+ QSCs. (E and F) Representative images of uninjured/resting EDL myofibers from C57BL/6 mice (n >50 myofibers from 6 mice/group) showing that most QSCs were HIF2A+, but HIF1A. Scale bars: 10 μm. (G) Percentage of HIF1A+ and HIF2A+ QSCs. Data represent the mean ± SEM.
Figure 2
Figure 2. Muscle repair following eccentric contraction–induced injury is concomitant with dynamic alterations of HIF2A and HIF1A expression in SCs.
(AC) Representative images of EDL myofibers from injured muscles at various time points (n >50 myofibers from 3 mice/group/time point) and stained for Pax7, DAPI, and EdU (A), HIF2A (B), or HIF1A (C). Scale bars: 20 μm. Arrowheads indicate SCs. (D) Number of Pax7+ SCs per myofiber at various time points. (E) Percentage of EdU+ SCs at various time points. (F) Percentage of HIF2A+ SCs at various time points. (G) Percentage of HIF1A+ SCs at various time points. Data represent the mean ± SEM.
Figure 3
Figure 3. Genetic ablation of HIF2A in QSCs leads to transient activation, proliferation, and differentiation of SCs.
(A) Timeline of genetic ablation of HIF2A in QSCs. (B) Representative images of myofibers from SC-HIF2AKO mice and control littermates (n >50 myofibers from 5 mice/group; 10 dpr). Immunofluorescence of Pax7 (red), HIF2A (green), MyoD (purple), and DAPI (blue) staining revealed HIF2AMyoD+ and HIF2A+MyoD SCs (arrowheads) in SC-HIF2AKO and control mice, respectively. Scale bar: 10 μm. (C) Number of HIF2A+ and HIF2A SCs per myofiber (10 dpr). (D) Number of MyoD and MyoD+ SCs per myofiber (10 dpr). (E) Timeline characterizing SC proliferation after HIF2A ablation in QSCs. (F) Representative cross-sectional images of TA muscles from SC-HIF2AKO mice and control littermates (n = 6 mice/group; 16 dpr). Immunofluorescence of Pax7 (red), Ki67 (green), EdU (purple), and DAPI (blue) staining revealed an increase in Ki67+EdU+ SCs (arrowheads) in SC-HIF2AKO mice. Scale bar: 20 μm. (G) Number of Ki67 and Ki67+ SCs per TA section. (H) Number of EdU and EdU+ SCs per TA section. (I) Timeline for tracing SC fates after HIF2A ablation in QSCs. (J) Representative images of TA muscles from SC-HIF2AKO-INTACT and control SC-INTACT mice (n = 6 mice/group; 16 dpr). Immunofluorescence of nmGFP, Pax7, laminin B2, and DAPI revealed increased nmGFP+Pax7+ SCs (arrowheads) and nmGFP+Pax7 myonuclei (asterisks) in SC-HIF2AKO-INTACT mice. Scale bar: 20 μm and 5 μm (insets). Inset images show that both nmGFP+Pax7+ SCs and nmGFP+Pax7 myonuclei are adjacent to the basal lamina. (K) Number of nmGFP+Pax7+ SCs and nmGFP+Pax7 myonuclei per TA section. (L) Number of nmGFP+myogenin+ differentiating SCs per EDL myofiber (16 dpr). **P < 0.01 and ***P < 0.005, by 2-sided Student’s t test. Data represent the mean ± SEM.
Figure 4
Figure 4. Long-term ablation of HIF2A results in the loss of SC homeostatic self-renewal.
(A) Timeline characterizing SC homeostasis after HIF2A ablation in QSCs. (B) Number of Pax7+ SCs per TA section in SC-HIF2AKO mice and control littermates on the same day of tamoxifen induction (+ Tamoxifen), 16 days, 1 month, and 6 months after tamoxifen-induced HIF2A ablation (n = 3 mice/group/time point). *P < 0.05 and ***P < 0.005, by 2-sided Student’s t test. Data represent the mean ± SEM. (C) H&E staining of TA muscles from SC-HIF2AKO mice and control littermates (n = 3 mice/group; 6 mo after tamoxifen-induced HIF2A ablation). Scar bars: 20 μm. (D) Distribution of myofiber cross-sectional areas of TA muscles from SC-HIF2AKO mice and control littermates (n = 3 mice/group; 6 mo after tamoxifen-induced HIF2A ablation).
Figure 5
Figure 5. HIF2A stabilization under normoxia promotes quiescence, self-renewal, and stemness of SCs yet impedes myogenic differentiation.
(A) Diagram depicting the timeline and plasmids used for HIF2A stabilization in normoxic SC culture. Pound signs denote the number and locations of point mutations in HIF2ATM. (B) Representative images of transfected (GFP+) SC clusters on myofibers from C57BL/6 mice (n >50 myofibers from 7 mice/group). The SC clusters were transfected with either HIF2ATM or control plasmids and stained for Pax7, MyoD, and DAPI. Scale bar: 5 μm. (C) Number of SC clusters, Pax7+ SCs per SC cluster, and Pax7+MyoD, Pax7+MyoD+, and Pax7MyoD+ SCs per SC cluster (n >50 myofibers). (D) Diagram of the experimental scheme for transplantation of HIF2A-stabilized SCs and tracing of their cell fates in vivo. (E) Cross-sectional images of TA muscles that were transplanted with HIF2ATM- or control plasmid–transfected SCs (n = 5 mice/group; 21 days after the first injury). Immunofluorescence of Pax7 and nmGFP revealed 2 fates of transplanted SCs: engrafted SCs that retained stemness (nmGFP+Pax7+; circles, bottom) and engrafted SCs that differentiated into myonuclei (nmGFP+Pax7; arrowheads). Scale bars: 20 μm. (F and H) Percentage of engrafted and self-renewed nmGFP+Pax7+ SCs in the total SC pool after the first round (21 dpi; n = 5 mice/group in F) and second round (30 dpi; n = 6 mice/group in H) of regeneration. (G and I) Number of nmGFP+Pax7 differentiated myonuclei per TA muscle section after the first round (G) and second round (I) of regeneration. *P < 0.05, **P < 0.01, and ***P < 0.005, by 2-sided Student’s t test. Data represent the mean ± SEM.
Figure 6
Figure 6. Genetic ablation of HIF2A transiently improves muscle regeneration but impairs long-term muscle regeneration potential.
(A) Representative images of TA muscles from SC-HIF2AKO mice and control littermates (n = 6 mice/group/time point). The muscles were CTX injured 10 days after tamoxifen-induced HIF2A ablation (10 dpr). Immunofluorescence of Pax7 after CTX injury (10 and 21 dpi) revealed an increase in Pax7+ SCs (arrowheads) in SC-HIF2AKO mice. Scale bars: 20 μm. (B and C) Number of Pax7+ SCs per TA muscle section at 10 dpi (B) and 21 dpi (C). (D) Representative images of TA muscles from SC-HIF2AKO mice and control littermates (n = 6 mice/group/time point). The muscles were CTX injured 10 days after tamoxifen-induced HIF2A ablation (10 dpr). Immunofluorescence of eMyHC and laminin B2 days after CTX injury (5, 10, and 21 dpi) revealed accelerated muscle regeneration in SC-HIF2AKO mice. Scale bars: 20 μm. (E) Representative images of TA muscles from SC-HIF2AKO mice and control littermates (n = 3 mice/group). The muscles were CTX injured 6 months after tamoxifen-induced HIF2A ablation. H&E staining of TA muscles 30 days after CTX injury revealed impaired muscle regeneration in SC-HIF2AKO mice. Scale bars: 20 μm. **P < 0.01, by 2-sided Student’s t test. Data represent the mean ± SEM.
Figure 7
Figure 7. Transient pharmacological inhibition of HIF2A in CTX-injured muscle promotes SC proliferation and accelerates muscle regeneration.
(A) Timeline of pharmacological inhibition of HIF2A after CTX-induced muscle injury in C57BL/6 mice. (B) Representative images of HIF-c2– or 1% DMSO–treated TA muscles (3 dpi) from C57BL/6 mice (n = 6 mice/group). Immunofluorescence revealed increased Pax7+EdU+ proliferative SCs (arrowheads) and decreased Pax7+EdU QSCs (circles). Scale bar: 20 μm. (C) Number of EdU+ and EdU SCs per TA muscle section 3 dpi (n = 6). (D) Number of Pax7+ SCs per TA muscle section 7 dpi, 10 dpi, and 30 dpi (n = 6 or 7). (E) Representative eMyHC and laminin B2 immunofluorescence in HIF-c2– or DMSO-treated TA muscles 7 dpi and 30 dpi (n = 3). Scale bars: 20 μm. (F) Immunoblots showing the expression levels of HIF2A, eMyHC, MyoD, and tubulin in HIF-c2– or DMSO-treated TA muscles 7 dpi (n = 3). (G) Distributions of myofiber cross-sectional areas of HIF-c2– or DMSO-treated TA muscles 30 dpi (n = 3). (H) Maximal torques of uninjured TA muscles and HIF-c2– or DMSO-treated TA muscles 7 dpi (n = 6), 10 dpi (n = 3), and 30 dpi (n = 3). (I) Timeline of pharmacological inhibition of HIF2A after CTX-induced muscle injury in C57BL/6 mice and SC-HIF2AKO mice. (J)Representative Pax7 immunofluorescence images of HIF-c2– or DMSO-treated TA muscles from SC-HIF2AKO mice (n = 6 mice/group) 10 dpi and number of Pax7+ SCs per TA muscle section 7 dpi. Scale bar: 20 um. (K) Representative eMyHC and laminin B2 immunofluorescence images of HIF-c2– or DMSO-treated TA muscles from SC-HIF2AKO (n = 6 mice/group) 7 dpi. Scale bar: 20 μm. *P < 0.05, **P < 0.01, and ***P < 0.005, by 2-sided Student’s t test. Data represent the mean ± SEM.
Figure 8
Figure 8. Spry1 is a target of HIF2A in QSCs.
(A) Luciferase assays showed that stabilized expression of HIF2A (HIF2ATM), but not HIF1A (HIF1ATM), increased the promoter activities of Spry1 and Atp7a (a known HIF2A target). In contrast, HIF1A, but not HIF2A, transactivated the Pdk3 promoter. (B) ChIP-qPCR indicated that HIF2A bound the promoters of Spry1 and Cav1 (a known HIF2A target), but not the Pdk3 promoter, in QSCs in vivo. (C) RT-qPCR revealed that HIF2A ablation in QSCs in vivo reduced the mRNA levels of Hif2a, Spry1, Calcr, and Cd36. (D) RT-qPCR indicated that 2 HIF2A shRNAs reduced the mRNA levels of Hif2a and Spry1 as well as of 2 known HIF2A targets, Atp7a and Cxcl12, in C2C12 myoblasts. (E) RT-qPCR revealed that HIF-c2 treatment decreased mRNA levels of the HIF2A targets Spry1, Atp7a, and Cxcl12 in C2C12 myoblasts. (F) RT-qPCR indicated that HIF2ATM increased the mRNA levels of Spry1 as well as of 2 known HIF2A targets, Atp7a and Cxcl12, in C2C12 myoblasts. *P < 0.05, **P < 0.01, and ***P < 0.005, by 2-sided Student’s t test. Data represent the mean ± SEM.

References

    1. Goodell MA, Rando TA. Stem cells and healthy aging. Science. 2015;350(6265):1199–1204. doi: 10.1126/science.aab3388. - DOI - PubMed
    1. Yin H, Price F, Rudnicki MA. Satellite cells and the muscle stem cell niche. Physiol Rev. 2013;93(1):23–67. doi: 10.1152/physrev.00043.2011. - DOI - PMC - PubMed
    1. Murphy MM, Lawson JA, Mathew SJ, Hutcheson DA, Kardon G. Satellite cells, connective tissue fibroblasts and their interactions are crucial for muscle regeneration. Development. 2011;138(17):3625–3637. doi: 10.1242/dev.064162. - DOI - PMC - PubMed
    1. Seale P, Sabourin LA, Girgis-Gabardo A, Mansouri A, Gruss P, Rudnicki MA. Pax7 is required for the specification of myogenic satellite cells. Cell. 2000;102(6):777–786. doi: 10.1016/S0092-8674(00)00066-0. - DOI - PubMed
    1. Cheung TH, et al. Maintenance of muscle stem-cell quiescence by microRNA-489. Nature. 2012;482(7386):524–528. doi: 10.1038/nature10834. - DOI - PMC - PubMed

Publication types

Substances