. 2018 Mar 13;9(3):157.
doi: 10.3390/genes9030157.

Testing of Alignment Parameters for Ancient Samples: Evaluating and Optimizing Mapping Parameters for Ancient Samples Using the TAPAS Tool

Affiliations

Testing of Alignment Parameters for Ancient Samples: Evaluating and Optimizing Mapping Parameters for Ancient Samples Using the TAPAS Tool

Ulrike H Taron et al. Genes (Basel). .

Abstract

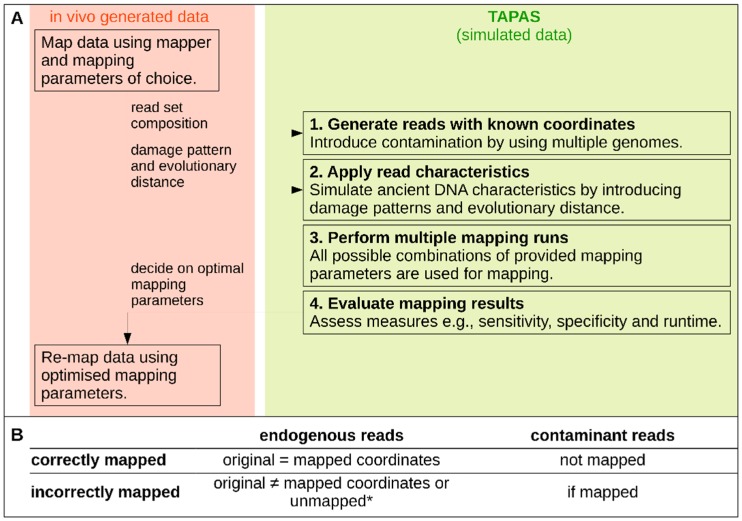
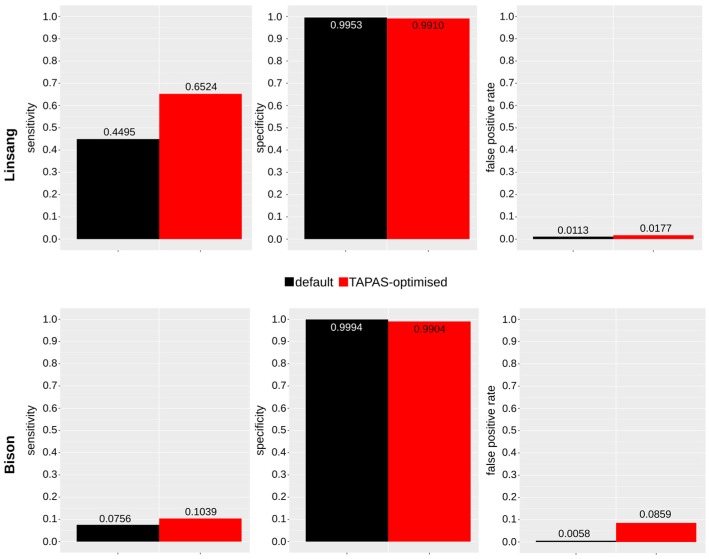
High-throughput sequence data retrieved from ancient or other degraded samples has led to unprecedented insights into the evolutionary history of many species, but the analysis of such sequences also poses specific computational challenges. The most commonly used approach involves mapping sequence reads to a reference genome. However, this process becomes increasingly challenging with an elevated genetic distance between target and reference or with the presence of contaminant sequences with high sequence similarity to the target species. The evaluation and testing of mapping efficiency and stringency are thus paramount for the reliable identification and analysis of ancient sequences. In this paper, we present 'TAPAS', (Testing of Alignment Parameters for Ancient Samples), a computational tool that enables the systematic testing of mapping tools for ancient data by simulating sequence data reflecting the properties of an ancient dataset and performing test runs using the mapping software and parameter settings of interest. We showcase TAPAS by using it to assess and improve mapping strategy for a degraded sample from a banded linsang (Prionodon linsang), for which no closely related reference is currently available. This enables a 1.8-fold increase of the number of mapped reads without sacrificing mapping specificity. The increase of mapped reads effectively reduces the need for additional sequencing, thus making more economical use of time, resources, and sample material.

Keywords: alignment sensitivity/specificity; ancient DNA; palaeogenomics; paleogenomics; short-read mapping.


Conflict of interest statement

The authors declare no conflict of interest.

Figures

Figure 1
Figure 1
(A) Schematic of the TAPAS (Testing of Alignment Parameters for Ancient Samples) tool indicating a typical workflow from in vivo data to mapping assessment. (B) Different classes of reads that TAPAS assigns* incorrect and unmapped reads are by default not independently considered but can be distinguished if needed.
Figure 2
Figure 2
False positive rates calculated from all mapped reads (faded colors) and from all mapped reads with high mapping quality (MapQ > 30; dark colors). A total of 30 combinations of the parameters mismatch value (n, x-axis) and seed length (l, coloured bars, see key top right) were tested by using one million simulated reads and the cat genome as reference. Even at the most relaxed mismatch value tested, less than 6%of contaminant reads mapped successfully to the reference genome after quality filtering. This figure was generated using R (v3.4.2 and v3.4.3 [37]).
Figure 3
Figure 3
Sensitivity using BWA aln before (faded colors) and after (darker colors) filtering reads with low mapping quality (MapQ < 30). A total of 30 combinations of the parameters mismatch value (n, x-axis) and seed length (l, coloured bars, see key top right) were tested using one million simulated reads and the cat genome as reference. Increased sensitivity is achieved by relaxing the mismatch value. Furthermore, mismatch value and seed length appear to have an interactive effect where the impact of the seed length parameter on sensitivity is more pronounced at lower mismatch values. This figure was generated using R (v3.4.2 and v3.4.3, [37]).
Figure 4
Figure 4
Sensitivity, specificity, and false positive rates of mapping using BWA aln with default parameters (black) and with the optimized parameters (red) based on the simulated data for the linsang (top) and bison (bottom). Using TAPAS, we can show an improvement of sensitivity (1.5-fold for the linsang and 1.4-fold for the bison) with only limited reduction in specificity while keeping the false positive rate low. This figure was generated using R (v3.4.2 and v3.4.3 [37]).

References

    1. Schubert M., Ginolhac A., Lindgreen S., Thompson J.F., AL-Rasheid K.A., Willerslev E., Krogh A., Orlando L. Improving ancient DNA read mapping against modern reference genomes. BMC Genom. 2012;13:178. doi: 10.1186/1471-2164-13-178. - DOI - PMC - PubMed
    1. Briggs A.W., Stenzel U., Johnson P.L.F., Green R.E., Kelso J., Prüfer K., Meyer M., Krause J., Ronan M.T., Lachmann M., et al. Patterns of damage in genomic DNA sequences from a Neandertal. Proc. Natl. Acad. Sci. USA. 2007;104:14616–14621. doi: 10.1073/pnas.0704665104. - DOI - PMC - PubMed
    1. Skoglund P., Northoff B.H., Shunkov M.V., Derevianko A.P., Pääbo S., Krause J., Jakobsson M. Separating endogenous ancient DNA from modern day contamination in a Siberian Neandertal. Proc. Natl. Acad. Sci. USA. 2014;111:2229–2234. doi: 10.1073/pnas.1318934111. - DOI - PMC - PubMed
    1. Schubert M., Ermini L., Sarkissian C.D., Jónsson H., Ginolhac A., Schaefer R., Martin M.D., Fernández R., Kircher M., McCue M., et al. Characterization of ancient and modern genomes by SNP detection and phylogenomic and metagenomic analysis using PALEOMIX. Nat. Protoc. 2014;9:1056–1082. doi: 10.1038/nprot.2014.063. - DOI - PubMed
    1. Green R.E., Malaspinas A.-S., Krause J., Briggs A.W., Johnson P.L.F., Uhler C., Meyer M., Good J.M., Maricic T., Stenzel U., et al. A complete Neandertal mitochondrial genome sequence determined by high-throughput sequencing. Cell. 2008;134:416–426. doi: 10.1016/j.cell.2008.06.021. - DOI - PMC - PubMed

LinkOut - more resources