

NF-κB signaling pathway-enhanced complement activation mediates renal injury in trichloroethylene-sensitized mice
- PMID: 29534626
- PMCID: PMC7179090
- DOI: 10.1080/1547691X.2017.1420712
NF-κB signaling pathway-enhanced complement activation mediates renal injury in trichloroethylene-sensitized mice
Abstract
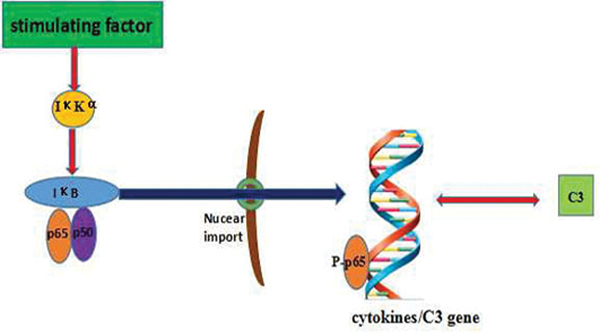
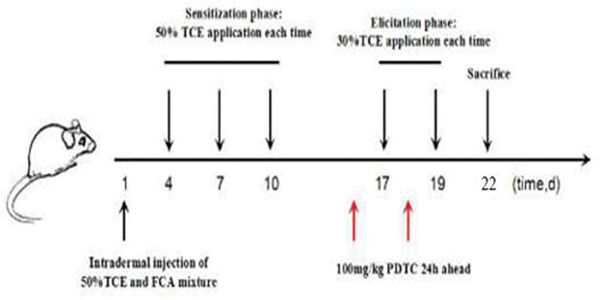
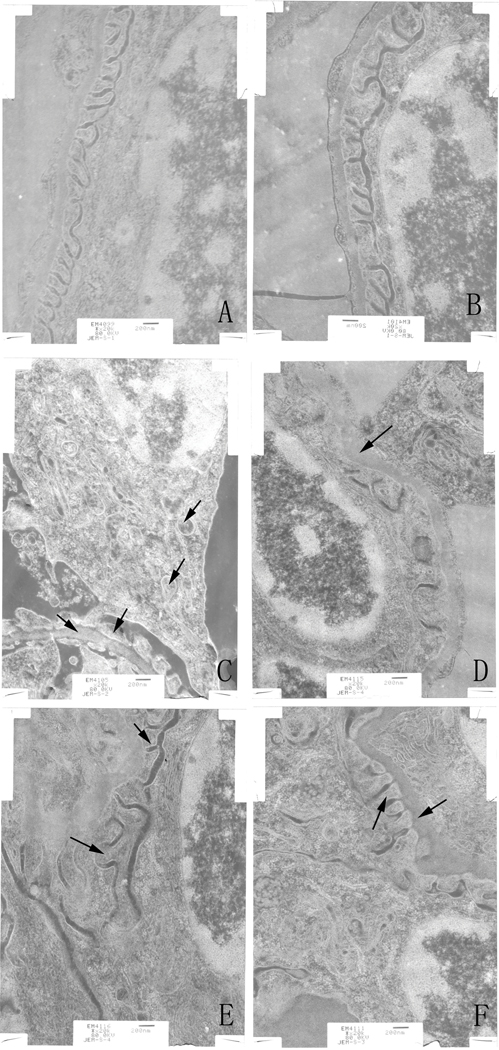
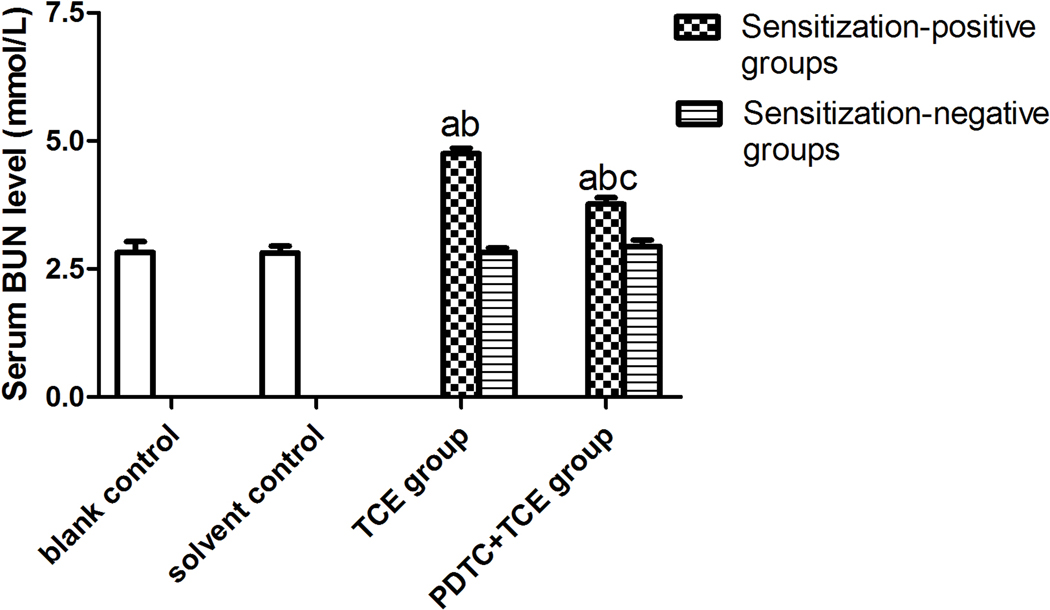
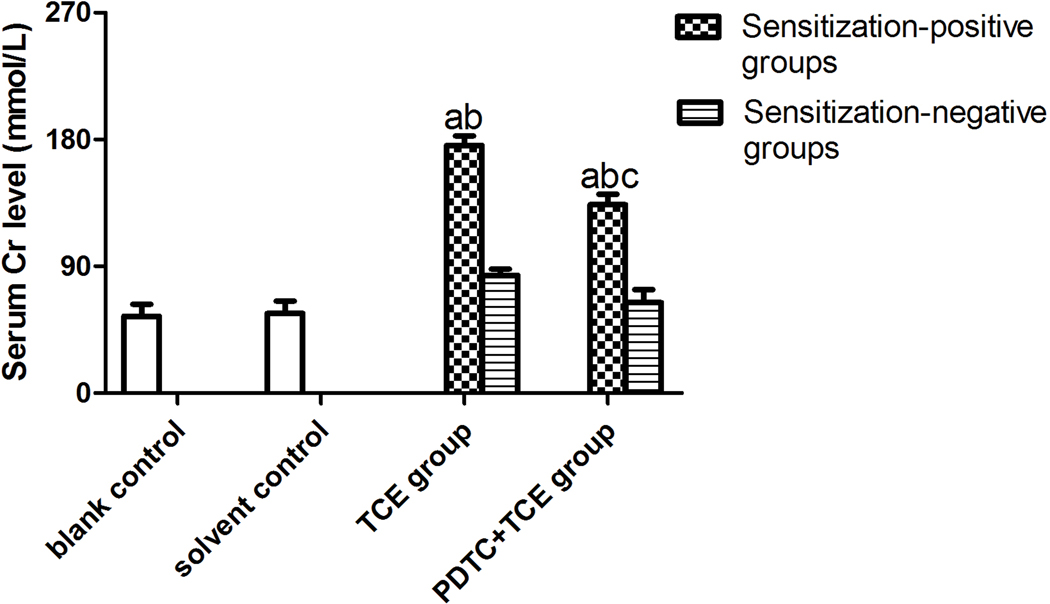
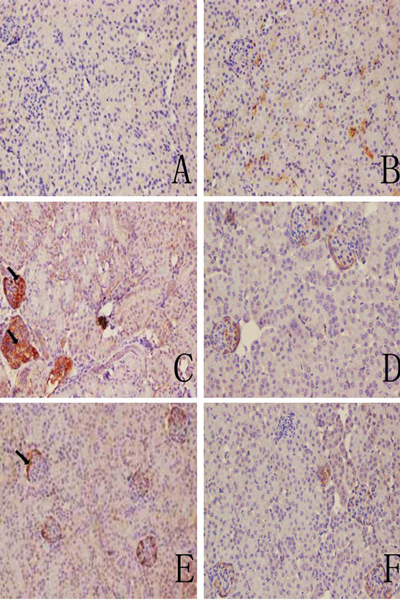
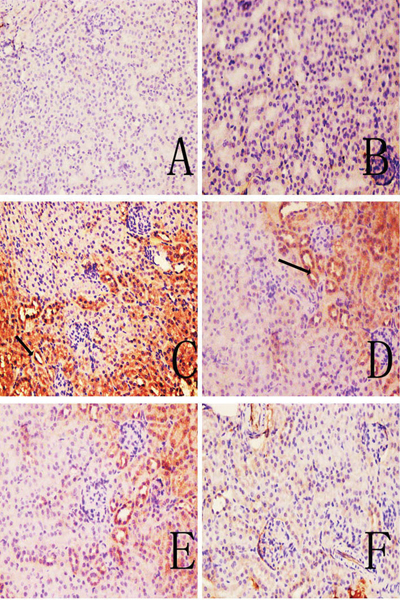
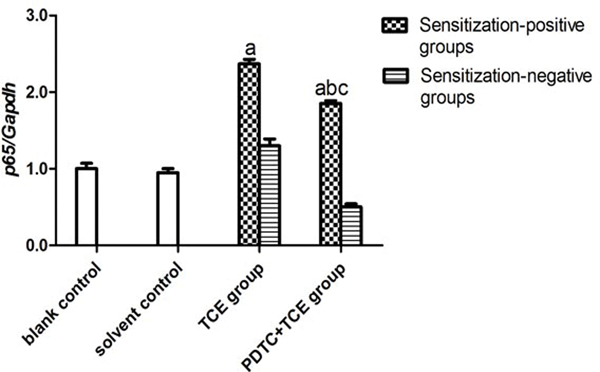
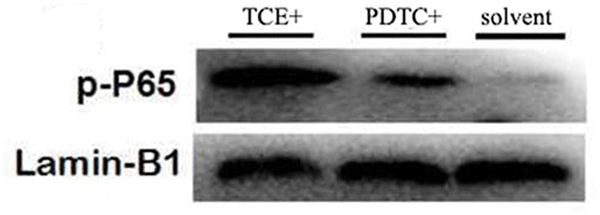
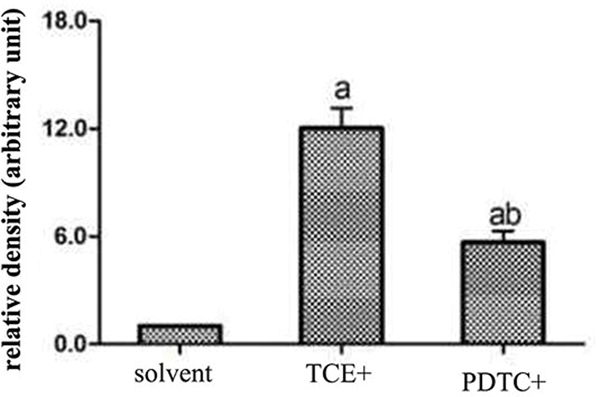
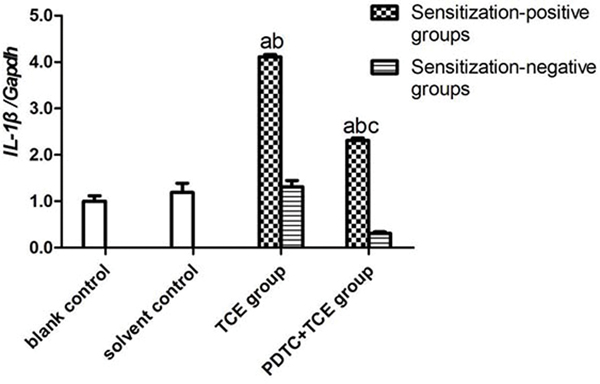
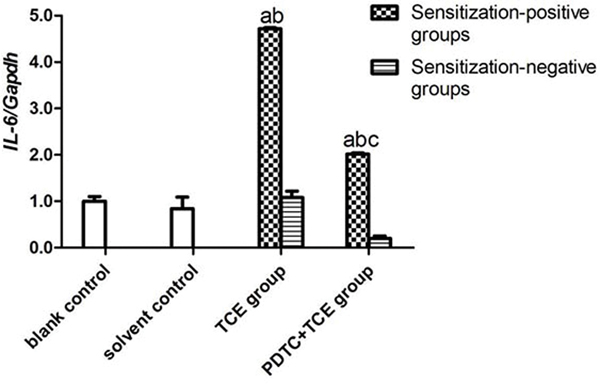
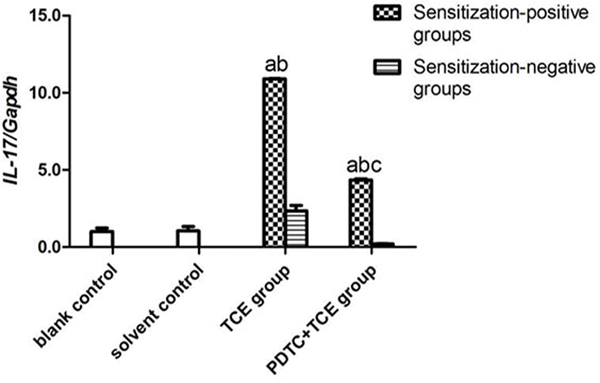
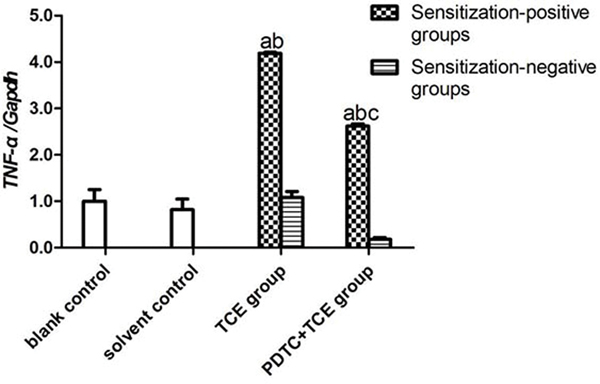
Both NF-κB pathway and complement activation appear to be involved in kidney damage induced by trichloroethylene (TCE). However, any relationship between these two systems has not yet been established. The present study aimed to clarify the role of NF-κB in complement activation and renal injury in TCE-sensitized BALB/c mice. Mice were sensitized by an initial subcutaneous injection and repeated focal applications of TCE to dorsal skin at specified timepoints. NF-κB inhibitor pyrrolidine dithiocarbamate (PDTC) was injected (intraperitoneal) before the final two focal TCE challenges. In the experiments, mice had their blood and kidneys collected. Kidney function was evaluated via blood urea nitrogen (BUN) and creatinine (Cr) content; renal histology was examined using transmission electron microscopy (TEM). Kidney levels of phospho-p65 were assessed by Western blot and kidney mRNA levels of interleukin (IL)-1β, IL-6, IL-17, tumor necrosis factor (TNF)-α, and p65 by real-time quantitative PCR. Presence of C3 and C5b-9 membrane attack complexes in the kidneys was evaluated via immunohistochemistry. The results showed there was significant swelling, vacuolar degeneration in mitochondria, shrinkage of microvilli, disappearance of brush borders, segmental foot process fusion, and glomerular basement membrane thickening (or disrobing) in kidneys from TCE-sensitized mice. In conjunction with these changes, serum BUN and Cr levels were increased and IL-1β, IL-6, IL-17, and TNFα mRNA levels were elevated. Levels of p65 and phospho-p65 protein were also up-regulated, and there was significant C3 and C5b-9 deposition. PDTC pretreatment attenuated TCE-induced up-regulation of p65 and its phosphorylation, complement deposition, cytokine release, and renal damage. These results provide the first evidence that NF-κB pathway has an important role in TCE-induced renal damage mediated by enhanced complement activation in situ.
Keywords: NF-κB; Trichloroethylene; p65; renal injury.
Figures
Similar articles
-
Bradykinin receptor in immune-mediated renal tubular injury in trichloroethylene-sensitized mice: Impact on NF-κB signaling pathway.J Immunotoxicol. 2018 Dec;15(1):126-136. doi: 10.1080/1547691X.2018.1532974. J Immunotoxicol. 2018. PMID: 30409067
-
Plasma Kallikrein-Kinin system mediates immune-mediated renal injury in trichloroethylene-sensitized mice.J Immunotoxicol. 2016 Jul;13(4):567-79. doi: 10.3109/1547691X.2016.1142019. Epub 2016 Mar 30. J Immunotoxicol. 2016. PMID: 27027470
-
Complement regulatory protein CD59a plays a protective role in immune liver injury of trichloroethylene-sensitized BALB/c mice.Ecotoxicol Environ Saf. 2019 May 15;172:105-113. doi: 10.1016/j.ecoenv.2019.01.049. Epub 2019 Jan 24. Ecotoxicol Environ Saf. 2019. PMID: 30685621
-
Complement C5a-C5aR interaction enhances MAPK signaling pathway activities to mediate renal injury in trichloroethylene sensitized BALB/c mice.J Appl Toxicol. 2016 Feb;36(2):271-84. doi: 10.1002/jat.3179. Epub 2015 Jun 10. J Appl Toxicol. 2016. PMID: 26095957
-
Renal tubular cell necroptosis: A novel mechanism of kidney damage in trichloroethylene hypersensitivity syndrome mice.J Immunotoxicol. 2021 Dec;18(1):173-182. doi: 10.1080/1547691X.2021.2003486. J Immunotoxicol. 2021. PMID: 34788186 Review.
Cited by
-
The Nephroprotective Effect of Lycopene on Renal Ischemic Reperfusion Injury: A Mouse Model.Indian J Clin Biochem. 2020 Oct;35(4):474-481. doi: 10.1007/s12291-019-00848-7. Epub 2019 Sep 13. Indian J Clin Biochem. 2020. PMID: 33013018 Free PMC article.
-
The Function of Transforming Growth Factor 2 in Facilitating Inflammasome Activation to Enhance the Development of Myopia via Complement System.Cells. 2025 Aug 20;14(16):1295. doi: 10.3390/cells14161295. Cells. 2025. PMID: 40862775 Free PMC article.
-
CFH Loss in Human RPE Cells Leads to Inflammation and Complement System Dysregulation via the NF-κB Pathway.Int J Mol Sci. 2021 Aug 13;22(16):8727. doi: 10.3390/ijms22168727. Int J Mol Sci. 2021. PMID: 34445430 Free PMC article.
-
NFκB and Kidney Injury.Front Immunol. 2019 Apr 16;10:815. doi: 10.3389/fimmu.2019.00815. eCollection 2019. Front Immunol. 2019. PMID: 31040851 Free PMC article. Review.
-
The role of NF-κB pathway and its regulation of inflammatory cytokines in scleral remodeling of form-deprivation mice model.Immunol Res. 2025 Feb 7;73(1):48. doi: 10.1007/s12026-025-09596-8. Immunol Res. 2025. PMID: 39920470
References
-
- Ali F, and Sultana S. 2012. Repeated short-term stress synergizes the ROS signaling through up-regulation of NF-κB and INOS expression induced due to combined exposure of trichloroethylene and UVB rays. Mol. Cell. Biochem 360:133–145. - PubMed
-
- An X, Zhang L, Yao Q, Li L, Wang B, Zhang J, He M, Zhang J 2017. The receptor for advanced glycation end-products mediates podocyte heparanase expression through NF-κB signaling pathway. Mol. Cell. Endocrinol May3. pii: S0303–7207(17)30252–6. - PubMed
-
- Bhat O, Uday K, Harishankar N, Harishankar N, Ravichandaran L, Bhatia A, Dhawan V. 2017. IL-18-induced cell adhesion molecule expression is associated with feedback regulation by PPARγ and NF-κB in Apo E−/− mice. Mol. Cell. Biochem 428:119–128. - PubMed
-
- Birbach A, Gold P, Binder B, Hofer E, Schmid J. 2002. Signaling molecules of the NF-κB pathway shuttle constitutively between cytoplasm and nucleus. J. Biol. Chem 277:10842–10851. - PubMed
Publication types
MeSH terms
Substances
Grants and funding
LinkOut - more resources
Full Text Sources
Other Literature Sources
Miscellaneous