

Integrated genomic analysis identifies clinically relevant subtypes of renal clear cell carcinoma
- PMID: 29534679
- PMCID: PMC5851245
- DOI: 10.1186/s12885-018-4176-1
Integrated genomic analysis identifies clinically relevant subtypes of renal clear cell carcinoma
Abstract
Background: Renal cell carcinoma (RCC) account for over 80% of renal malignancies. The most common type of RCC can be classified into three subtypes including clear cell, papillary and chromophobe. ccRCC (the Clear Cell Renal Cell Carcinoma) is the most frequent form and shows variations in genetics and behavior. To improve accuracy and personalized care and increase the cure rate of cancer, molecular typing for individuals is necessary.
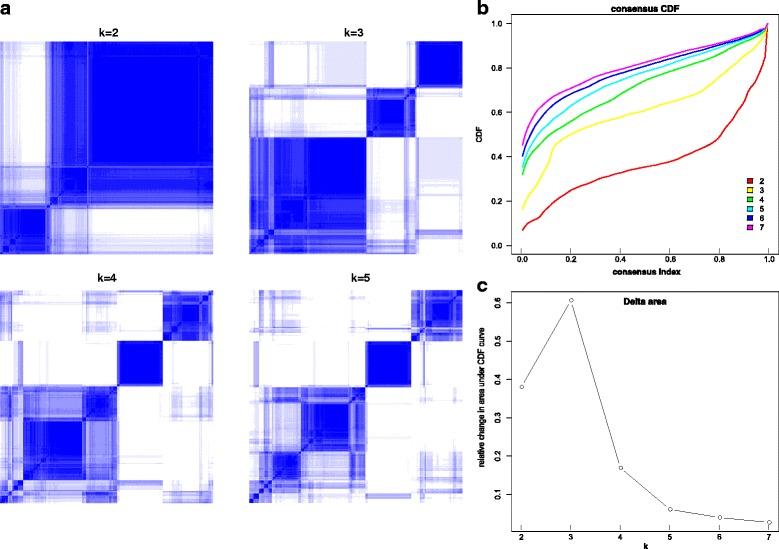
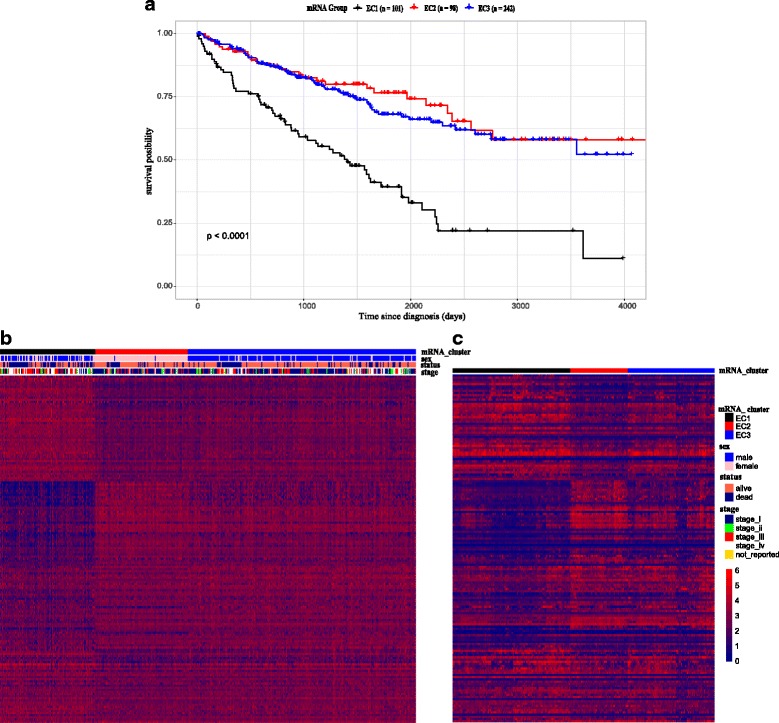
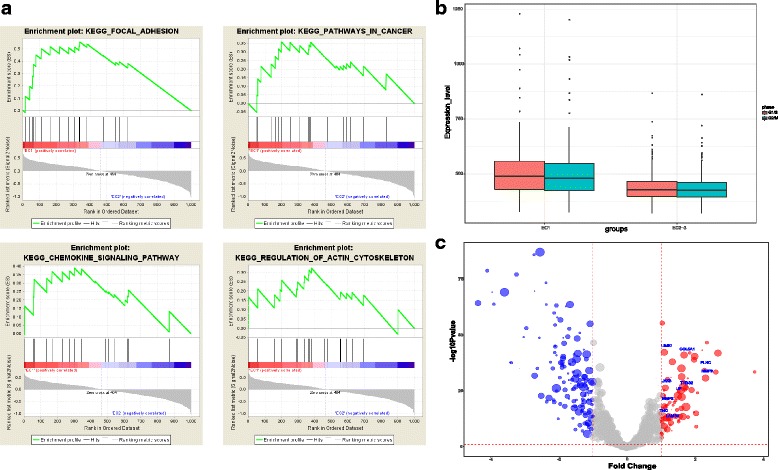
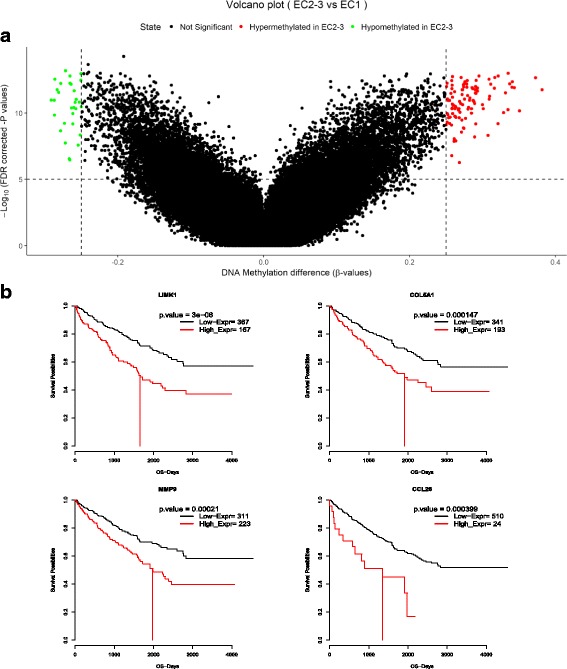
Methods: We adopted the genome, transcriptome and methylation HMK450 data of ccRCC in The Cancer Genome Atlas Network in this research. Consensus Clustering algorithm was used to cluster the expression data and three subtypes were found. To further validate our results, we analyzed an independent data set and arrived at a consistent conclusion. Next, we characterized the subtype by unifying genomic and clinical dimensions of ccRCC molecular stratification. We also implemented GSEA between the malignant subtype and the other subtypes to explore latent pathway varieties and WGCNA to discover intratumoral gene interaction network. Moreover, the epigenetic state changes between subgroups on methylation data are discovered and Kaplan-Meier survival analysis was performed to delve the relation between specific genes and prognosis.
Results: We found a subtype of poor prognosis in clear cell renal cell carcinoma, which is abnormally upregulated in focal adhesions and cytoskeleton related pathways, and the expression of core genes in the pathways are negatively correlated with patient outcomes.
Conclusions: Our work of classification schema could provide an applicable framework of molecular typing to ccRCC patients which has implications to influence treatment decisions, judge biological mechanisms involved in ccRCC tumor progression, and potential future drug discovery.
Keywords: Gene expression; Molecular classification; Pathway; ccRCC.
Conflict of interest statement
Ethics approval and consent to participate
Not applicable.
Consent for publication
Not applicable.
Competing interests
The authors declare that they have no competing interests.
Publisher’s Note
Springer Nature remains neutral with regard to jurisdictional claims in published maps and institutional affiliations.
Figures
References
-
- Journalist, Resource S: American Cancer Society . Cancer facts and figures. 2012.
-
- Shen C, Beroukhim R, Schumacher SE, Zhou J, Chang M, Signoretti S, Kaelin WG., Jr Genetic and functional studies implicate HIF1alpha as a 14q kidney cancer suppressor gene. Cancer Discov. 2011;1(3):222–235. doi: 10.1158/2159-8290.CD-11-0098. - DOI - PMC - PubMed
Publication types
MeSH terms
Substances
LinkOut - more resources
Full Text Sources
Other Literature Sources
Medical
