

Screening for Biologically Annotated Drugs That Trigger Triacylglycerol Accumulation in the Diatom Phaeodactylum
- PMID: 29535162
- PMCID: PMC6001342
- DOI: 10.1104/pp.17.01804
Screening for Biologically Annotated Drugs That Trigger Triacylglycerol Accumulation in the Diatom Phaeodactylum
Abstract
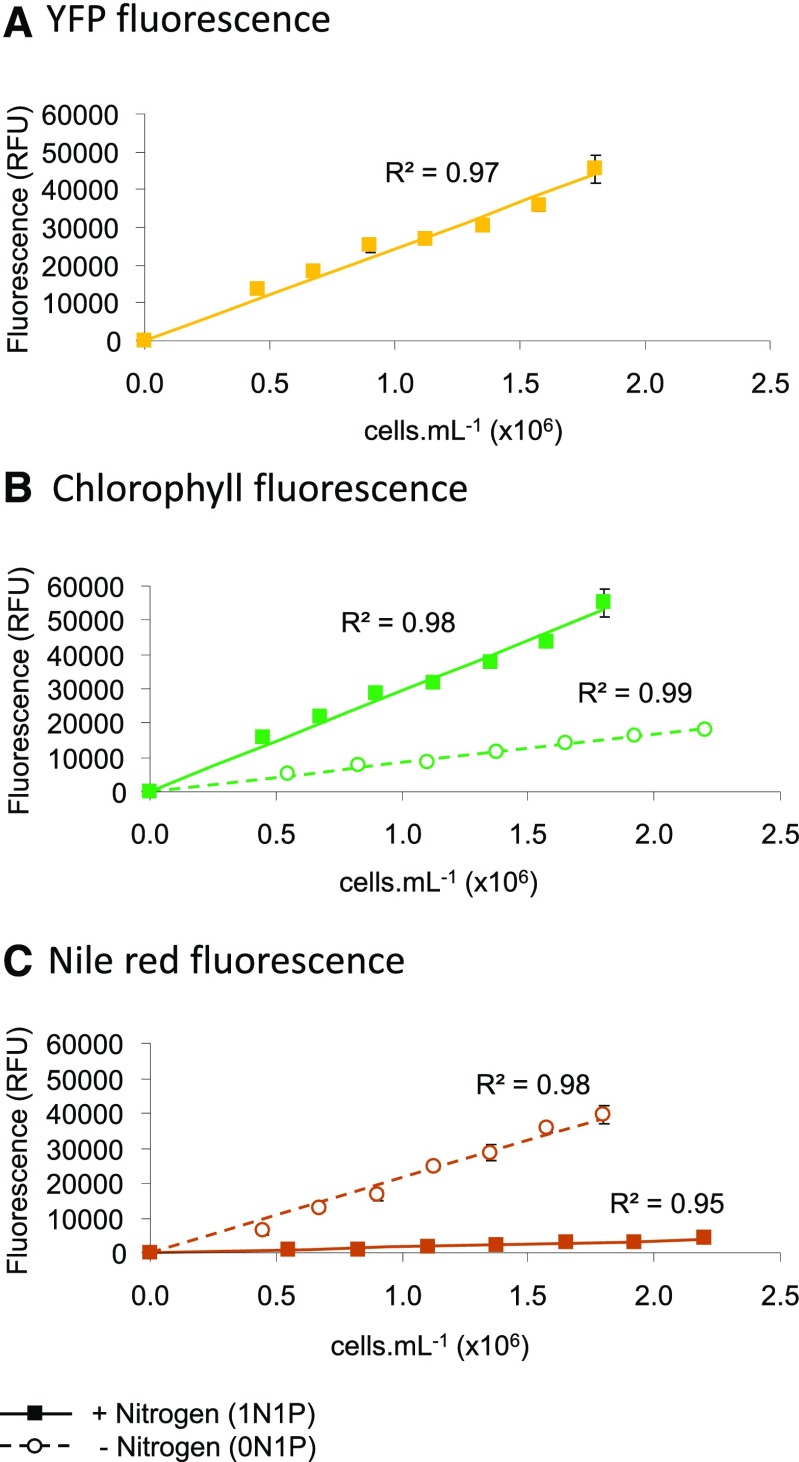
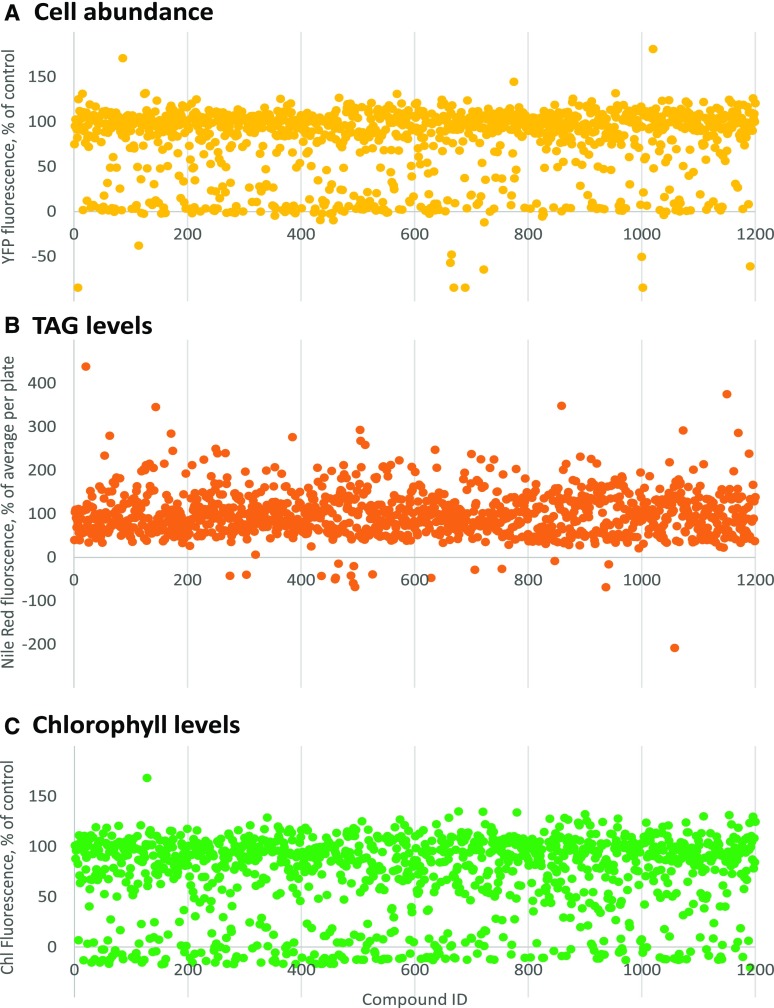
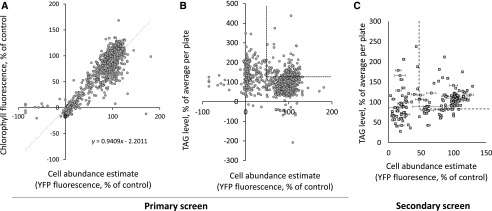
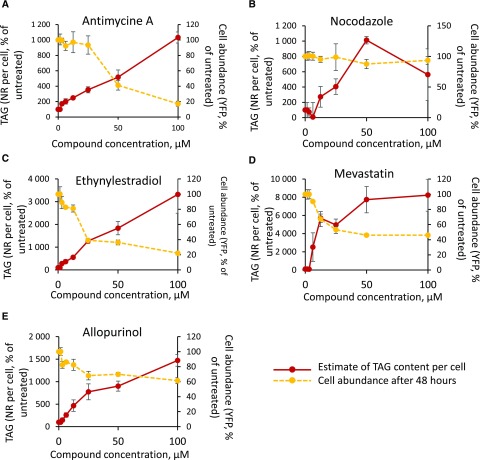
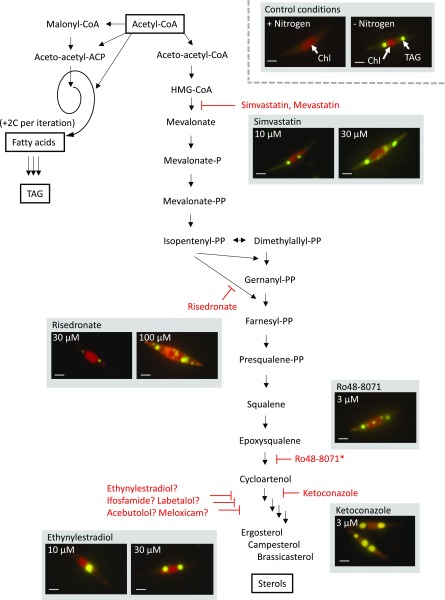
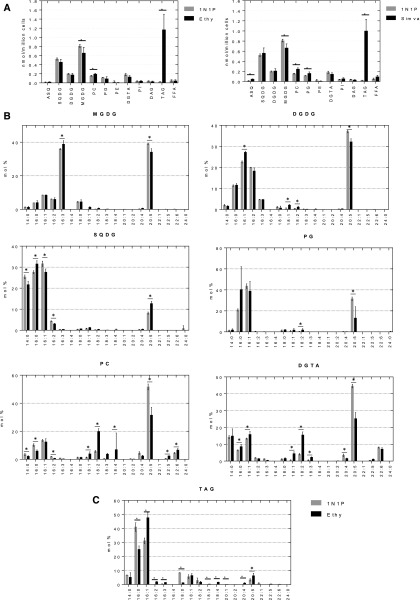
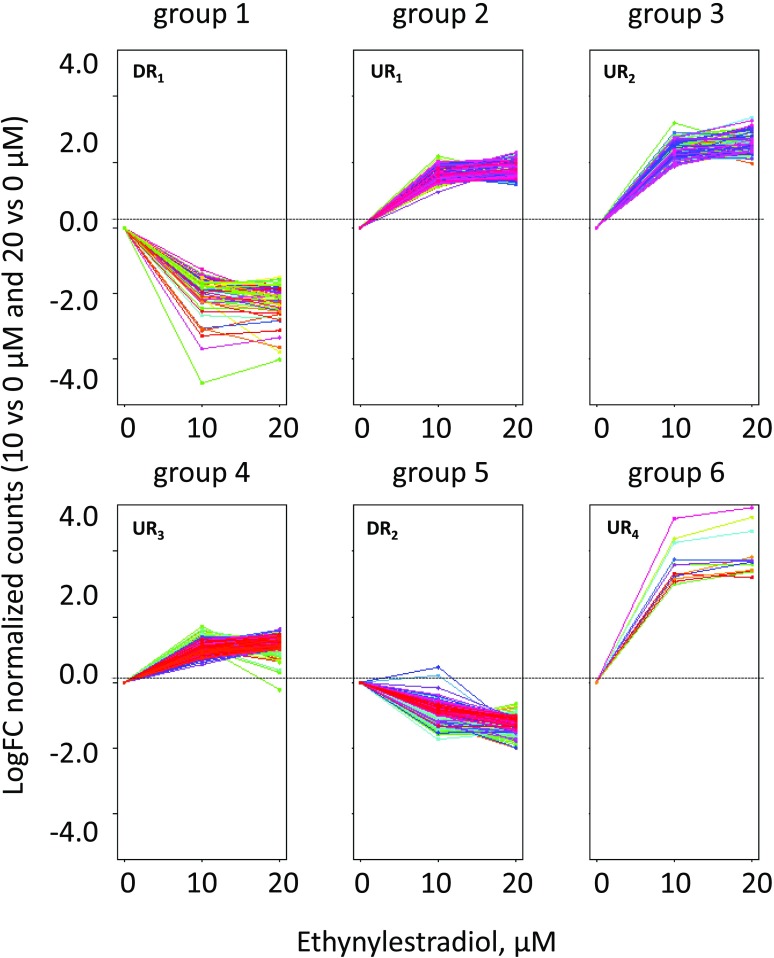
Microalgae are a promising feedstock for the production of triacylglycerol (TAG) for a variety of potential applications, ranging from food and human health to biofuels and green chemistry. However, obtaining high TAG yields is challenging. A phenotypic assay for the accumulation of oil droplets was developed to screen a library of 1,200 drugs, annotated with pharmacology information, to select compounds that trigger TAG accumulation in the diatom Phaeodactylum tricornutum Using this screen, we identified 34 molecules acting in a dose-dependent manner. Previously characterized targets of these compounds include cell division and cell signaling effectors, membrane receptors and transporters, and sterol metabolism. Among the five compounds possibly acting on sterol metabolism, we focused our study on ethynylestradiol, a synthetic form of estrogen that is used in contraceptive pills and known for its ecological impact as an endocrine disruptor. Ethynylestradiol impaired the production of very-long-chain polyunsaturated fatty acids, destabilized the galactolipid versus phospholipid balance, and triggered the recycling of fatty acids from membrane lipids to TAG. The P. tricornutum transcriptomic response to treatment with ethynylestradiol was consistent with the reallocation of carbon from sterols to acetyl-coenzyme A and TAG. The mode of action and catabolism of ethynylestradiol are unknown but might involve several up-regulated cytochrome P450 proteins. A fatty acid elongase, Δ6-ELO-B1, might be involved in the impairment of very-long-chain polyunsaturated fatty acids and fatty acid turnover. This phenotypic screen opens new perspectives for the exploration of novel bioactive molecules, potential target genes, and pathways controlling TAG biosynthesis. It also unraveled the sensitivity of diatoms to endocrine disruptors, highlighting an impact of anthropogenic pollution on phytoplankton.
© 2018 American Society of Plant Biologists. All Rights Reserved.
Figures
Similar articles
-
Plastidial acyl carrier protein Δ9-desaturase modulates eicosapentaenoic acid biosynthesis and triacylglycerol accumulation in Phaeodactylum tricornutum.Plant J. 2021 Jun;106(5):1247-1259. doi: 10.1111/tpj.15231. Epub 2021 May 5. Plant J. 2021. PMID: 33725374 Free PMC article.
-
Two marine natural products, penicillide and verrucarin J, are identified from a chemical genetic screen for neutral lipid accumulation effectors in Phaeodactylum tricornutum.Appl Microbiol Biotechnol. 2020 Mar;104(6):2731-2743. doi: 10.1007/s00253-020-10411-7. Epub 2020 Jan 31. Appl Microbiol Biotechnol. 2020. PMID: 32002603
-
Metabolic engineering of Phaeodactylum tricornutum for the enhanced accumulation of omega-3 long chain polyunsaturated fatty acids.Metab Eng. 2014 Mar;22(100):3-9. doi: 10.1016/j.ymben.2013.12.003. Epub 2013 Dec 10. Metab Eng. 2014. PMID: 24333273 Free PMC article.
-
Relationship between acyl-lipid and sterol metabolisms in diatoms.Biochimie. 2020 Feb;169:3-11. doi: 10.1016/j.biochi.2019.07.005. Epub 2019 Jul 7. Biochimie. 2020. PMID: 31291593 Review.
-
Current trends to comprehend lipid metabolism in diatoms.Prog Lipid Res. 2018 Apr;70:1-16. doi: 10.1016/j.plipres.2018.03.001. Epub 2018 Mar 7. Prog Lipid Res. 2018. PMID: 29524459 Review.
Cited by
-
Bioinformatics-Based Screening Approach for the Identification and Characterization of Lipolytic Enzymes from the Marine Diatom Phaeodactylum tricornutum.Mar Drugs. 2023 Feb 14;21(2):125. doi: 10.3390/md21020125. Mar Drugs. 2023. PMID: 36827166 Free PMC article.
-
Suboptimal Temperature Acclimation Affects Kennedy Pathway Gene Expression, Lipidome and Metabolite Profile of Nannochloropsis salina during PUFA Enriched TAG Synthesis.Mar Drugs. 2018 Nov 1;16(11):425. doi: 10.3390/md16110425. Mar Drugs. 2018. PMID: 30388843 Free PMC article.
-
Non-Enzymatic Synthesis of Bioactive Isoprostanoids in the Diatom Phaeodactylum following Oxidative Stress.Plant Physiol. 2018 Nov;178(3):1344-1357. doi: 10.1104/pp.18.00925. Epub 2018 Sep 20. Plant Physiol. 2018. PMID: 30237205 Free PMC article.
-
Physiochemical and molecular responses of the diatom Phaeodactylum tricornutum to illumination transitions.Biotechnol Biofuels Bioprod. 2023 Jun 16;16(1):103. doi: 10.1186/s13068-023-02352-w. Biotechnol Biofuels Bioprod. 2023. PMID: 37328885 Free PMC article.
-
Nutrient Deficiency and an Algicidal Bacterium Improved the Lipid Profiles of a Novel Promising Oleaginous Dinoflagellate, Prorocentrum donghaiense, for Biodiesel Production.Appl Environ Microbiol. 2021 Sep 10;87(19):e0115921. doi: 10.1128/AEM.01159-21. Epub 2021 Sep 10. Appl Environ Microbiol. 2021. PMID: 34319787 Free PMC article.
References
-
- Adeel M, Song X, Wang Y, Francis D, Yang Y (2017) Environmental impact of estrogens on human, animal and plant life: a critical review. Environ Int 99: 107–119 - PubMed
-
- Ajjawi I, Verruto J, Aqui M, Soriaga LB, Coppersmith J, Kwok K, Peach L, Orchard E, Kalb R, Xu W, et al. (2017) Lipid production in Nannochloropsis gaditana is doubled by decreasing expression of a single transcriptional regulator. Nat Biotechnol 35: 647–652 - PubMed
-
- Allorent G, Courtois F, Chevalier F, Lerbs-Mache S (2013) Plastid gene expression during chloroplast differentiation and dedifferentiation into non-photosynthetic plastids during seed formation. Plant Mol Biol 82: 59–70 - PubMed
Publication types
MeSH terms
Substances
LinkOut - more resources
Full Text Sources
Other Literature Sources
