Insulin-stimulated glucose uptake in skeletal muscle, adipose tissue and liver: a positron emission tomography study
- PMID: 29535167
- PMCID: PMC5920018
- DOI: 10.1530/EJE-17-0882
Insulin-stimulated glucose uptake in skeletal muscle, adipose tissue and liver: a positron emission tomography study
Abstract
Objective: Insulin resistance is reflected by the rates of reduced glucose uptake (GU) into the key insulin-sensitive tissues, skeletal muscle, liver and adipose tissue. It is unclear whether insulin resistance occurs simultaneously in all these tissues or whether insulin resistance is tissue specific.
Design and methods: We measured GU in skeletal muscle, adipose tissue and liver and endogenous glucose production (EGP), in a single session using 18F-fluorodeoxyglucose with positron emission tomography (PET) and euglycemic-hyperinsulinemic clamp. The study population consisted of 326 subjects without diabetes from the CMgene study cohort.
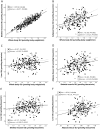
Results: Skeletal muscle GU less than 33 µmol/kg tissue/min and subcutaneous adipose tissue GU less than 11.5 µmol/kg tissue/min characterized insulin-resistant individuals. Men had considerably worse insulin suppression of EGP compared to women. By using principal component analysis (PCA), BMI inversely and skeletal muscle, adipose tissue and liver GU positively loaded on same principal component explaining one-third of the variation in these measures. The results were largely similar when liver GU was replaced by EGP in PCA. Liver GU and EGP were positively associated with aging.
Conclusions: We have provided threshold values, which can be used to identify tissue-specific insulin resistance. In addition, we found that insulin resistance measured by GU was only partially similar across all insulin-sensitive tissues studied, skeletal muscle, adipose tissue and liver and was affected by obesity, aging and gender.
© 2018 The authors.
Figures


References
-
- Iozzo P, Geisler F, Oikonen V, Mäki M, Takala T, Solin O, Ferrannini E, Knuuti J, Nuutila P. Insulin stimulates liver glucose uptake in humans: an 18F-FDG PET Study. Journal of Nuclear Medicine 2003. 44 682–689. - PubMed
-
- Virtanen KA, Lönnroth P, Parkkola R, Peltoniemi P, Asola M, Viljanen T, Tolvanen T, Knuuti J, Rönnemaa T, Huupponen R. et al Glucose uptake and perfusion in subcutaneous and visceral adipose tissue during insulin stimulation in nonobese and obese humans. Journal of Clinical Endocrinology and Metabolism 2002. 87 3902–3910. (10.1210/jcem.87.8.8761) - DOI - PubMed
-
- Virtanen KA, Iozzo P, Hällsten K, Huupponen R, Parkkola R, Janatuinen T, Lönnqvist F, Viljanen T, Rönnemaa T, Lönnroth P. et al Increased fat mass compensates for insulin resistance in abdominal obesity and type 2 diabetes: a positron-emitting tomography study. Diabetes 2005. 54 2720–2726. (10.2337/diabetes.54.9.2720) - DOI - PubMed
MeSH terms
Substances
LinkOut - more resources
Full Text Sources
Other Literature Sources
Medical

