. 2018 Mar 13;9(2):e00013-18.
doi: 10.1128/mBio.00013-18.

Defining the Transcriptional Landscape during Cytomegalovirus Latency with Single-Cell RNA Sequencing

Affiliations

Defining the Transcriptional Landscape during Cytomegalovirus Latency with Single-Cell RNA Sequencing

Miri Shnayder et al. mBio. .

Abstract

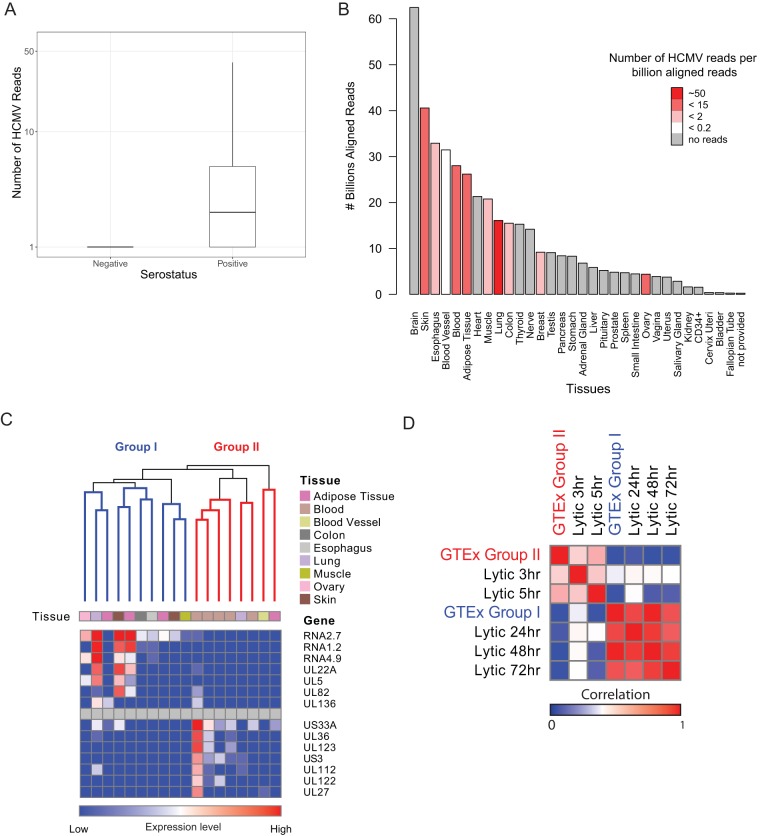
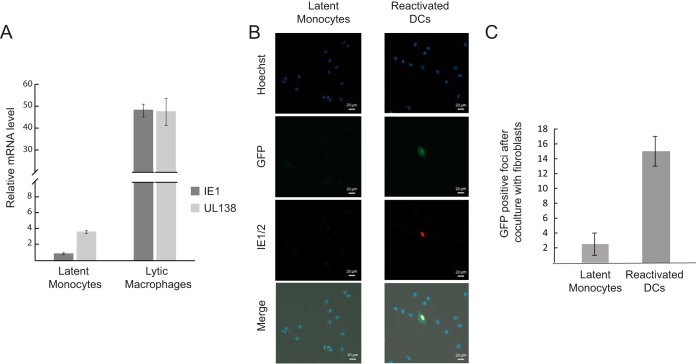
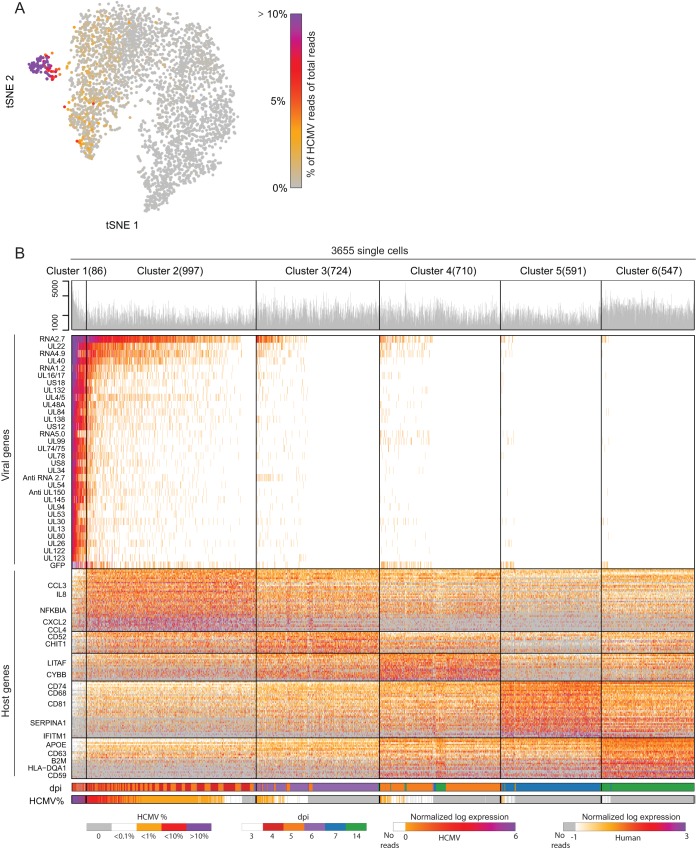
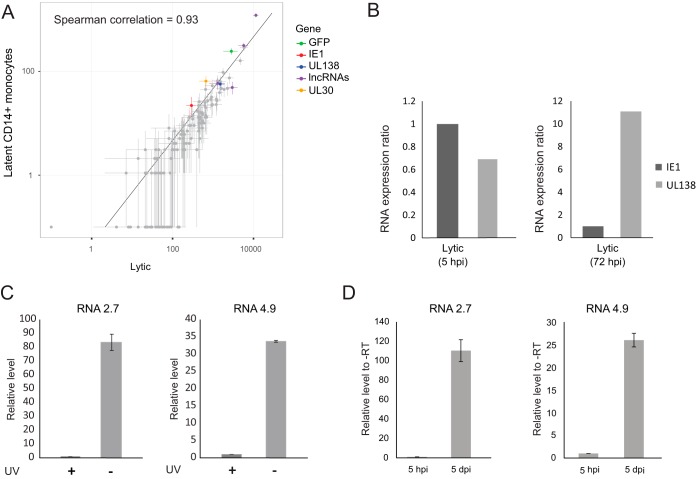
Primary infection with human cytomegalovirus (HCMV) results in a lifelong infection due to its ability to establish latent infection, with one characterized viral reservoir being hematopoietic cells. Although reactivation from latency causes serious disease in immunocompromised individuals, our molecular understanding of latency is limited. Here, we delineate viral gene expression during natural HCMV persistent infection by analyzing the massive transcriptome RNA sequencing (RNA-seq) atlas generated by the Genotype-Tissue Expression (GTEx) project. This systematic analysis reveals that HCMV persistence in vivo is prevalent in diverse tissues. Notably, we find only viral transcripts that resemble gene expression during various stages of lytic infection with no evidence of any highly restricted latency-associated viral gene expression program. To further define the transcriptional landscape during HCMV latent infection, we also used single-cell RNA-seq and a tractable experimental latency model. In contrast to some current views on latency, we also find no evidence for any highly restricted latency-associated viral gene expression program. Instead, we reveal that latency-associated gene expression largely mirrors a late lytic viral program, albeit at much lower levels of expression. Overall, our work has the potential to revolutionize our understanding of HCMV persistence and suggests that latency is governed mainly by quantitative changes, with a limited number of qualitative changes, in viral gene expression.IMPORTANCE Human cytomegalovirus is a prevalent pathogen, infecting most of the population worldwide and establishing lifelong latency in its hosts. Although reactivation from latency causes significant morbidity and mortality in immunocompromised hosts, our molecular understanding of the latent state remains limited. Here, we examine the viral gene expression during natural and experimental latent HCMV infection on a transcriptome-wide level. In contrast to the classical views on herpesvirus latency, we find no evidence for a restricted latency-associated viral gene expression program. Instead, we reveal that latency gene expression largely resembles a late lytic viral profile, albeit at much lower levels of expression. Taken together, our data transform the current view of HCMV persistence and suggest that latency is mainly governed by quantitative rather than qualitative changes in viral gene expression.

Keywords: cytomegalovirus; gene expression; latency; single-cell RNA-seq; transcriptome.


Figures

FIG 1
FIG 1
Viral gene expression during natural persistent infection. (A) Box plot showing number of HCMV reads per sample in HCMV-seronegative and HCMV-seropositive samples. (B) Bar plot showing distribution of total sequenced reads in different tissues; color coding reflects the number of viral reads normalized to total number of sequenced reads in each tissue (number of HCMV reads/109 total aligned reads). Viral reads from samples containing fewer than 2 viral reads were filtered out. Data for all samples were obtained from GTEx (40, 74), except for CD34+ data, which were collected from 25 different NCBI GEO data sets (Table S1D). (C) Hierarchical clustering of natural samples with more than 4 HCMV reads, according to viral gene expression. The samples are portioned into 2 groups: group I and group II. The upper panel color coding indicates the tissue origin of each sample. The heat map in the lower panel shows the expression level of representative differentially expressed genes in each sample. (D) Heat map showing correlations between viral gene expression program from natural samples from both groups (I and II) and experimental lytically infected fibroblasts at different time points postinfection.
FIG 2
FIG 2
Establishment of HCMV latency in CD14+ monocytes. (A) Monocytes and monocyte-derived macrophages were infected with HCMV strain TB40E-GFP at an MOI of 5. RNA was collected at 4 days postinfection (dpi) from the latent monocytes and 5 h postinfection (hpi) from lytic monocyte-derived macrophages and was analyzed by qRT-PCR for the transcript levels of UL138 and IE1. Expression was normalized to the human Anxa5 transcript. Means and error bars (showing standard deviations) represent three measurements. (B) Monocytes were latently infected with TB40E-GFP at an MOI of 5. At 3 dpi, cells were either differentiated into dendritic cells (reactivated DCs) or left undifferentiated (latent monocytes), and 2 days after terminal differentiation, reactivation was visualized by GFP and IE1/2 staining. Representative fields are presented. (C) Monocytes were latently infected with TB40E-GFP at an MOI of 5. At 3 dpi, cells were either differentiated to dendritic cells (reactivated DCs) or left undifferentiated (latent monocytes). Two days after terminal differentiation, cells were cocultured with primary fibroblasts and GFP-positive plaques were counted. The number of positive plaques per 100,000 monocytes or monocyte-derived dendritic cells is presented. Cell number and viability were measured by trypan blue staining prior to plating. Means and error bars (showing standard deviations) represent two experiments.
FIG 3
FIG 3
scRNA-seq analysis of latently infected CD14+ monocytes. Single-cell RNA sequencing analysis of 3,655 cells from a cell population of latently infected monocytes. CD14+ monocytes were infected with HCMV (TB40E-GFP) and analyzed at 3, 4, 5, 6, 7, and 14 dpi. (A) t-SNE plot of all 3,655 single cells based on host and viral gene expression. The color bar shows the percentage of viral reads from total reads per cell. (B) Heat map showing clustering analysis of 3,655 single cells. Rows show expression of the 176 most differential genes (32 out of 171 detected viral transcripts shown in the upper panel, 144 out of 15,812 detected cellular transcripts shown in the lower panel). The bar over the upper panel shows the number of reads obtained for each cell (log scale). Bars under the heat map indicate the percentage of viral reads from total reads and days postinfection for each cell. Cells are partitioned into 6 distinct clusters (1 to 6) based on gene expression profiles and ordered by the relative abundance of viral reads, from high to low. The number of cells in each cluster is shown in parentheses next to the cluster number.
FIG 4
FIG 4
Transcriptional program in latently infected CD14+ monocytes. (A) Scatter plot showing read number of viral genes in latent monocytes (defined as cells in which the proportion of viral reads was below 0.5% of total reads) versus lytic cells (cells from cluster 1). Horizontal and vertical error bars indicate 95% nonparametric bootstrap confidence interval across cells. (B) Relative expression of IE1 and UL138 transcripts in RNA-seq data from lytic fibroblasts at 5 and 72 hpi. (C) Relative RNA expression level of viral RNA2.7 (left panel) and RNA4.9 (right panel) in monocytes infected with untreated or UV-inactivated virus, measured by qRT-PCR at 5 dpi. A representative analysis of two independent experiments is shown. (D) RNA expression level of viral RNA2.7 (left panel) and RNA4.9 (right panel), relative to no-RT (-RT) samples, in infected monocytes, measured by qRT-PCR at 5 h and 5 days postinfection. Means and error bars (showing standard deviations) represent three measurements. A representative analysis of two independent experiments is shown.
FIG 5
FIG 5
scRNA-seq analysis of latently infected CD34+ progenitor cells. Single-cell RNA sequencing analysis of 7,634 cells randomly sampled from a cell population of latently infected HPCs. CD34+ HPCs were infected with HCMV (TB40E-GFP) and analyzed at 4 dpi (A) t-SNE projection of all 7,634 single cells based on host and viral gene expression. The color bar shows the level of viral gene expression as a percentage of total reads per cell. (B) Scatter plot showing read number of all viral genes in the latently infected CD34+ progenitors versus lytic cells. Horizontal and vertical error bars indicate 95% nonparametric bootstrap confidence intervals across cells.

Comment in

References

    1. Pass RF, Stagno S, Britt WJ, Alford CA. 1983. Specific cell-mediated immunity and the natural history of congenital infection with cytomegalovirus. J Infect Dis 148:953–961. doi: 10.1093/infdis/148.6.953. - DOI - PubMed
    1. Zanghellini F, Boppana SB, Emery VC, Griffiths PD, Pass RF. 1999. Asymptomatic primary cytomegalovirus infection: virologic and immunologic features. J Infect Dis 180:702–707. doi: 10.1086/314939. - DOI - PubMed
    1. Griffiths PD. 2010. Cytomegalovirus in intensive care. Rev Med Virol 20:1–3. doi: 10.1002/rmv.646. - DOI - PubMed
    1. Limaye AP, Kirby KA, Rubenfeld GD, Leisenring WM, Bulger EM, Neff MJ, Gibran NS, Huang M-L, Hayes TKS, Corey L, Boeckh M. 2008. Cytomegalovirus reactivation in critically ill immunocompetent patients. JAMA 300:413–422. doi: 10.1001/jama.300.4.413. - DOI - PMC - PubMed
    1. Crough T, Khanna R. 2009. Immunobiology of human cytomegalovirus: from bench to bedside. Clin Microbiol Rev 22:76–98. doi: 10.1128/CMR.00034-08. - DOI - PMC - PubMed

Publication types