. 2018 Apr 9;131(7):jcs213306.
doi: 10.1242/jcs.213306.

Identification and characterisation of a cryptic Golgi complex in Naegleria gruberi

Affiliations

Identification and characterisation of a cryptic Golgi complex in Naegleria gruberi

Emily K Herman et al. J Cell Sci. .

Abstract

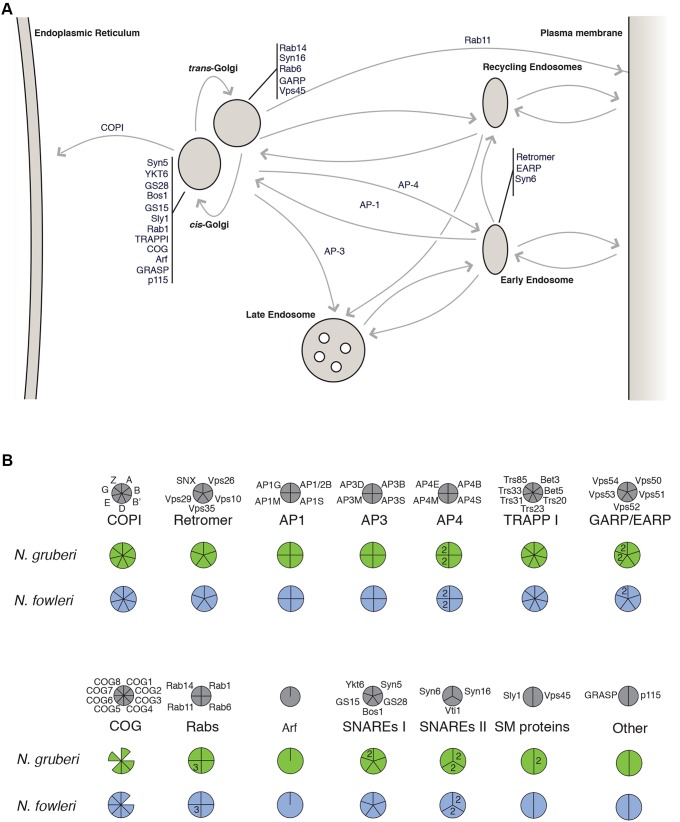
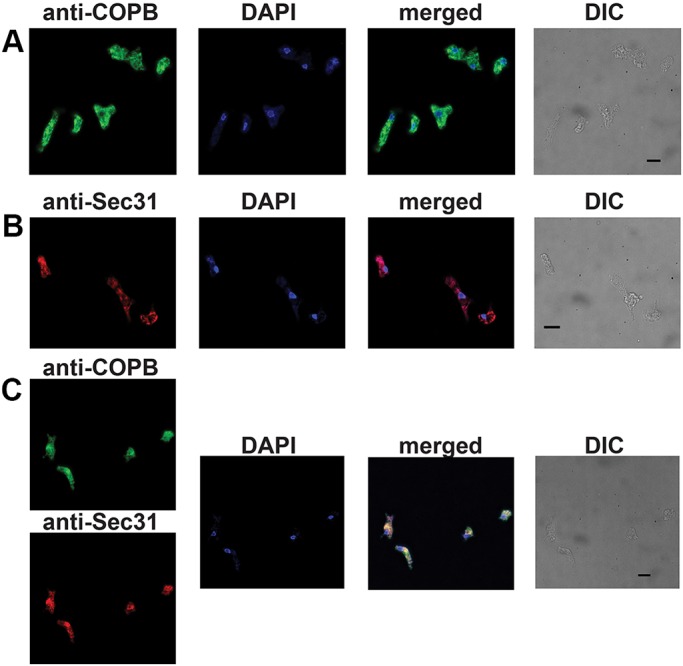
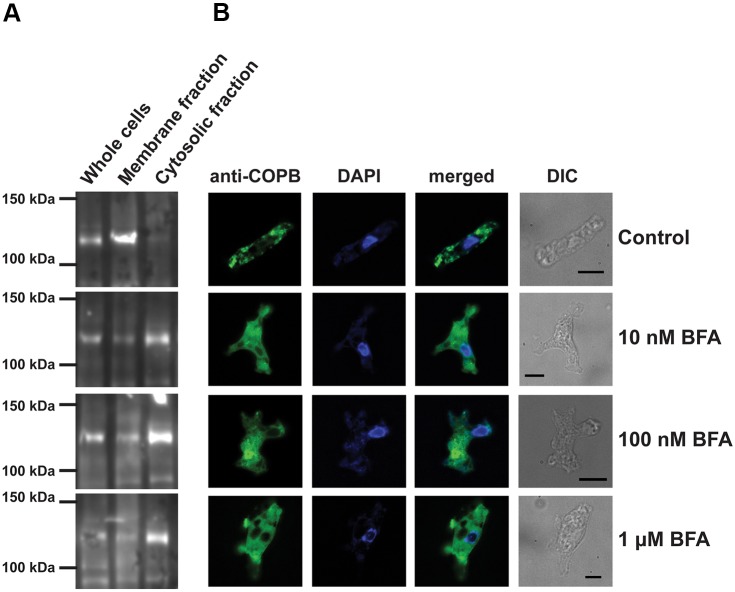
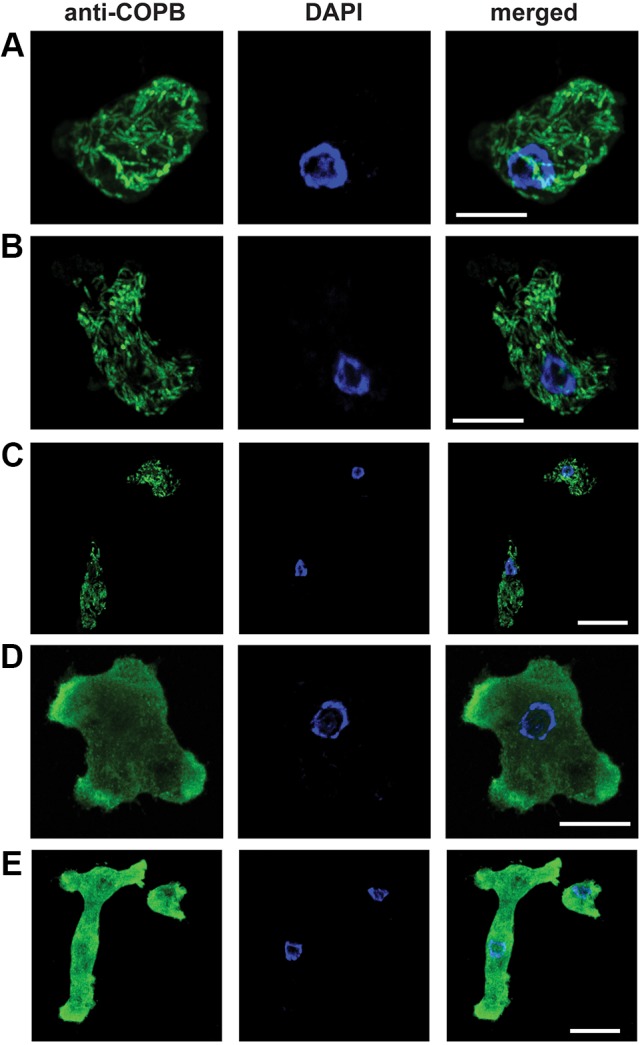
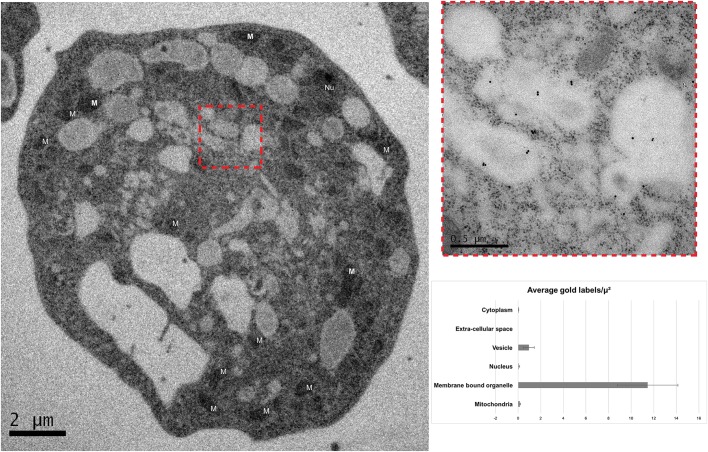
Although the Golgi complex has a conserved morphology of flattened stacked cisternae in most eukaryotes, it has lost the stacked organisation in several lineages, raising the question of what range of morphologies is possible for the Golgi. In order to understand this diversity, it is necessary to characterise the Golgi in many different lineages. Here, we identify the Golgi complex in Naegleria, one of the first descriptions of an unstacked Golgi organelle in a non-parasitic eukaryote, other than fungi. We provide a comprehensive list of Golgi-associated membrane trafficking genes encoded in two species of Naegleria and show that nearly all are expressed in mouse-passaged N. fowleri cells. We then study distribution of the Golgi marker (Ng)CopB by fluorescence in Naegleria gruberi, identifying membranous structures that are disrupted by Brefeldin A treatment, consistent with Golgi localisation. Confocal and immunoelectron microscopy reveals that NgCOPB localises to tubular membranous structures. Our data identify the Golgi organelle for the first time in this major eukaryotic lineage, and provide the rare example of a tubular morphology, representing an important sampling point for the comparative understanding of Golgi organellar diversity.This article has an associated First Person interview with the first author of the paper.

Keywords: Brefeldin A; COPI; Dictyosome; Evolutionary cell biology; Membrane trafficking; Protist.


Conflict of interest statement

Competing interestsThe authors declare no competing or financial interests.

Figures

Fig. 1.
Fig. 1.
In silico prediction of Golgi-associated proteins in Naegleria. (A) Cartoon illustrating the membrane trafficking pathways in which Golgi-associated proteins identified in Naegleria are known to function in canonical systems. (B) Coulson plot showing the presence of Golgi-associated proteins shown in A in N. gruberi and N. fowleri. Grey circles represent the complement of Golgi-associated proteins that are generally conserved in eukaryotes. Below, filled segments represent identified homologues, while missing segments indicate that no homologue could be found. Paralogue numbers are shown within the segments.
Fig. 2.
Fig. 2.
Indirect fluorescence assay of N. gruberi cells. (A) Cellular localisation of COPI in N. gruberi cells. Chicken anti-N.gruberi COPB antiserum (1:250; green) shows a discrete localisation in the cells, while DAPI stains the Naegleria nucleus and mitochondrial DNA. Differential interference contrast (DIC) images show the cells used for immunofluorescence. (B) Cellular localisation of Sec31 in N. gruberi cells. Rat anti-N.gruberi Sec31 antiserum (1:250; red) shows a discrete localisation in the cells, while DAPI stains the Naegleria nucleus and mitochondrial DNA. DIC images show the cells used for immunofluorescence. (C) Cellular localisation of COPI and Sec31 in N. gruberi cells. Chicken anti-N.gruberi COPB antiserum (green) shows a discrete localisation in the cells that is not co-localised with the rat anti-N.gruberi Sec31 antiserum (red), while DAPI stains the Naegleria nucleus and mitochondrial DNA. DIC images show the the cells used for immunofluorescence. The experiment was performed three times in six replicates. Scale bars: 10 μm.
Fig. 3.
Fig. 3.
BFA changes the localisation of COPB in N. gruberi. (A) Western blot of whole-cell, membrane and cytosolic fractions using the anti-COPB antisera, in the presence of various concentrations or absence of BFA. Upon treatment with increased concentrations of BFA from 10 nM to 1 μM after 3 h of incubation, COPB intensity increases in the cytosolic fraction, while it decreases in the membrane fractions. For each experiment, we used the same initial number of Naegleria cells, and after a Bradford assay, the same amount of protein was loaded in the gel. (B) Indirect fluorescence assay of Naegleria cells after BFA treatment. Chicken anti-N.gruberi COPB antiserum (1:200; green) shows localisation of COPI in the cells, while DAPI stains the Naegleria nuclei and mitochondrial DNA. As with the western blot experiments, with an increased concentration of BFA from 10 nM to 1 μM after 3 h of incubation, COPB intensity increases in the cytosol, while the membranous localisation disappears. Differential interference contrast (DIC) images show the cells used for immunofluorescence. The experiment was performed five times in three replicates. Scale bars: 10 μm.
Fig. 4.
Fig. 4.
Confocal microscopy of COPI localisation in individual N. gruberi cells. (A) Cellular localisation of COPI in a N. gruberi cell. Chicken anti-N.gruberi COPB antiserum (1:250; green) shows a tubular localisation in the cell, while DAPI stains the Naegleria nucleus and mitochondrial DNA. The image is a result of a 3D rendering of 28 overlapping individual 0.284 μm thick sections, with a final representative thickness of 7.95 μm. Different angles of the same image can been found in Fig. S3A. (B) Cellular localisation of COPI in a N. gruberi cell. Chicken anti-N.gruberi COPB antiserum (1:250; green) shows a tubular localisation in the cell, while DAPI stains the Naegleria nucleus and mitochondrial DNA. The image is a result of a 3D rendering of 16 overlapping individual 0.295 μm thick sections, with a final representative thickness of 4.624 μm. Different angles of the same image can been found in Fig. S3B. (C) Cellular localisation of COPI in two N. gruberi cells. Chicken anti-N.gruberi COPB antiserum (1:250; green) shows a tubular localisation in the cell, while DAPI stains the Naegleria nuclei and mitochondrial DNA. The image is a result of a 3D rendering of 21 overlapping individual 0.284 μm thick sections, with a final representative thickness of 5.96 μm. Different angles of the same image can been found in Fig. S3C. (D) Cellular localisation of COPI in a N. gruberi cell. Chicken anti-N.gruberi COPB antiserum (1:250; green) shows a cytosolic localisation in the cell after treatment with 10 nM of BFA for 3 h, while DAPI stains the Naegleria nucleus and mitochondrial DNA. The image is a result of a 3D rendering of 32 overlapping individual 0.29 μm thick sections, with a final representative thickness of 9.27 μm. Different angles of the same image can been found in Fig. S3D. (E) Cellular localisation of COPI in two N. gruberi cells. Chicken anti-N.gruberi COPB antiserum (1:250; green) shows a tubular localisation in the cells after treatment with 1 μM of BFA for 3 h, while DAPI stains the Naegleria nuclei and mitochondrial DNA. The image is a result of a 3D rendering of 26 overlapping individual 0.29 μm thick sections, with a final representative thickness of 7.53 μm. Different angles of the same image can been found in Fig. S3E. The experiment was replicated five times. Scale bars: 10 μm.
Fig. 5.
Fig. 5.
Immuno-gold localisation of COPI in N. gruberi cells. Immuno-gold localisation of COPI in an N. gruberi cell (TEM) shows localisation associated with membrane-bound organelles. The inset shows a higher magnification image of the organelles. Four additional images can be found in Fig. S5. The graph demonstrates the densities of labelling in the different compartments of N. gruberi cells, suggesting that COPI is mainly localised in the membrane bound organelles of the cell. Both mitochondria (M) and Nucleus (Nu) are indicated in the figure. The experiment was replicated three times (mean±s.d. of 60 replicates).

Similar articles

Cited by

References

    1. Adl S. M., Simpson A. G. B., Lane C. E., Lukeš J., Bass D., Bowser S. S., Brown M. W., Burki F., Dunthorn M., Hampl V. et al. (2012). The revised classification of eukaryotes. 59, 429-493. 10.1111/j.1550-7408.2012.00644.x - DOI - PMC - PubMed
    1. Altschul S. F., Madden T. L., Schäffer A. A., Zhang J., Zhang Z., Miller W. and Lipman D. J. (1997). Gapped BLAST and PSI-BLAST: a new generation of protein database search programs. 25, 3389-3402. 10.1093/nar/25.17.3389 - DOI - PMC - PubMed
    1. Barlow L. D., Nyvltova E., Aguilar M., Tachezy J. and Dacks J. B. (2018). A sophisticated, differentiated Golgi in the ancestor of eukaryotes. 16, 27 10.1186/s12915-018-0492-9 - DOI - PMC - PubMed
    1. Beznoussenko G. V., Dolgikh V. V., Seliverstova E. V., Semenov P. B., Tokarev Y. S., Trucco A., Micaroni M., Di Giandomenico D., Auinger P., Senderskiy I. V. et al. (2007). Analogs of the Golgi complex in microsporidia: structure and avesicular mechanisms of function. 120, 1288-1298. 10.1242/jcs.03402 - DOI - PubMed
    1. Bolger A. M., Lohse M. and Usadel B. (2014). Trimmomatic: A flexible trimmer for Illumina sequence data. 30, 2114-2120. 10.1093/bioinformatics/btu170 - DOI - PMC - PubMed

Publication types

LinkOut - more resources