. 2018 Mar 13;9(1):869.
doi: 10.1038/s41467-018-02992-9.

Warm Arctic episodes linked with increased frequency of extreme winter weather in the United States

Affiliations

Warm Arctic episodes linked with increased frequency of extreme winter weather in the United States

Judah Cohen et al. Nat Commun. .

Abstract

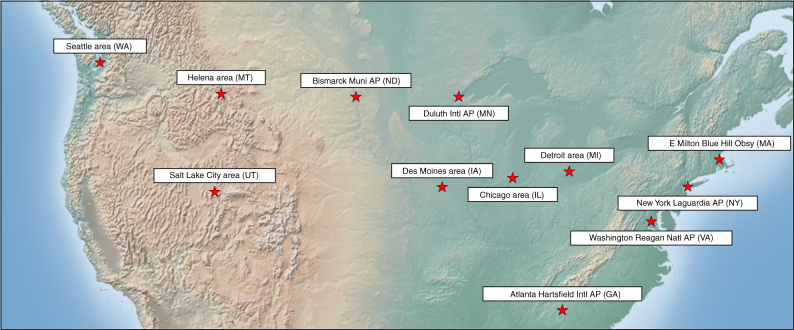
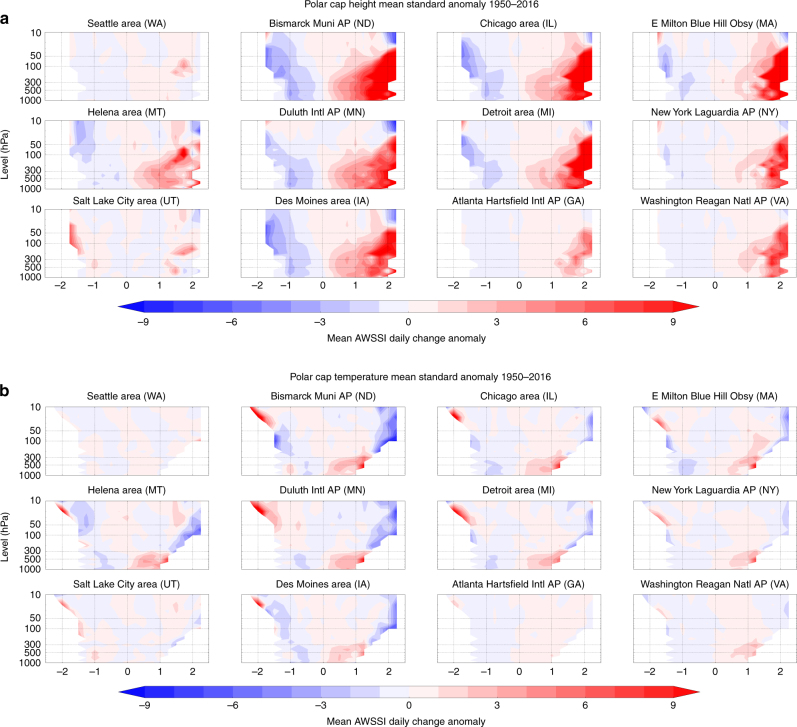
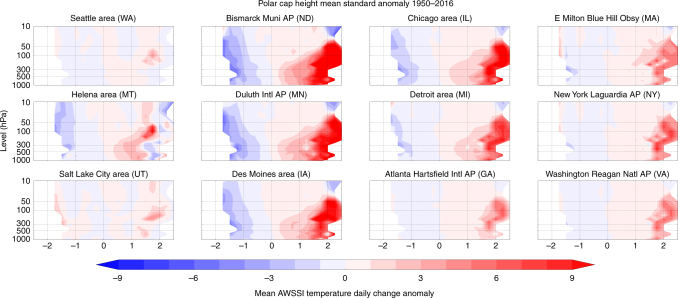
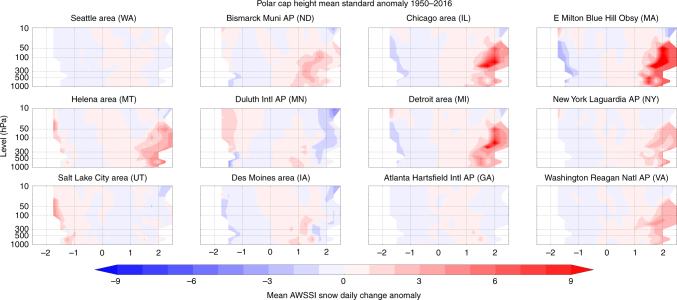
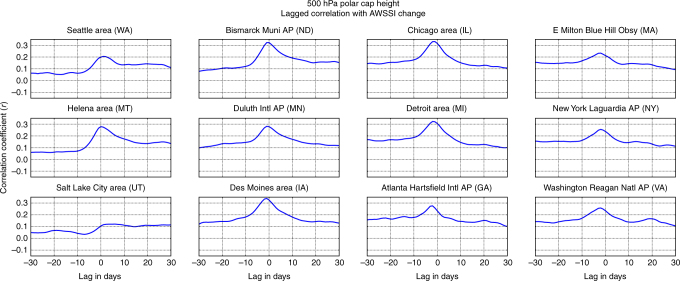
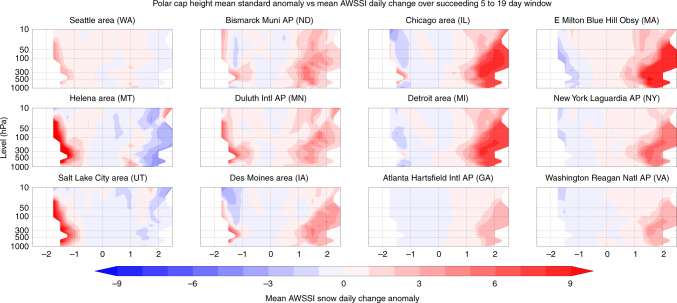
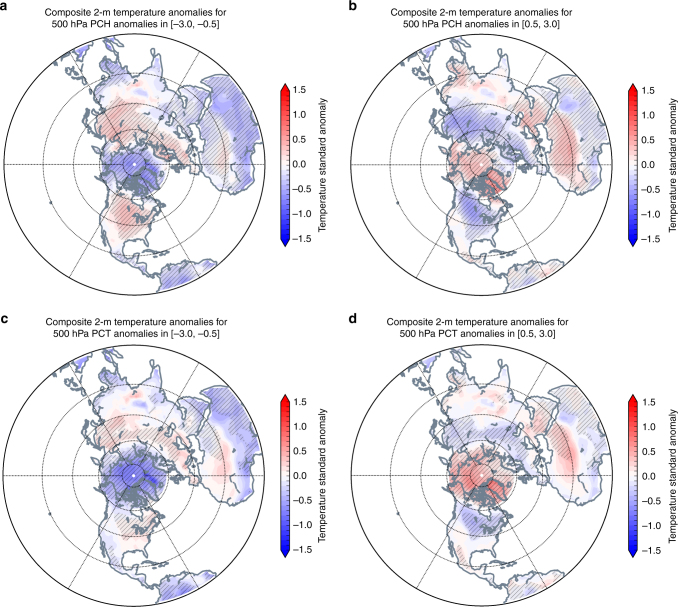
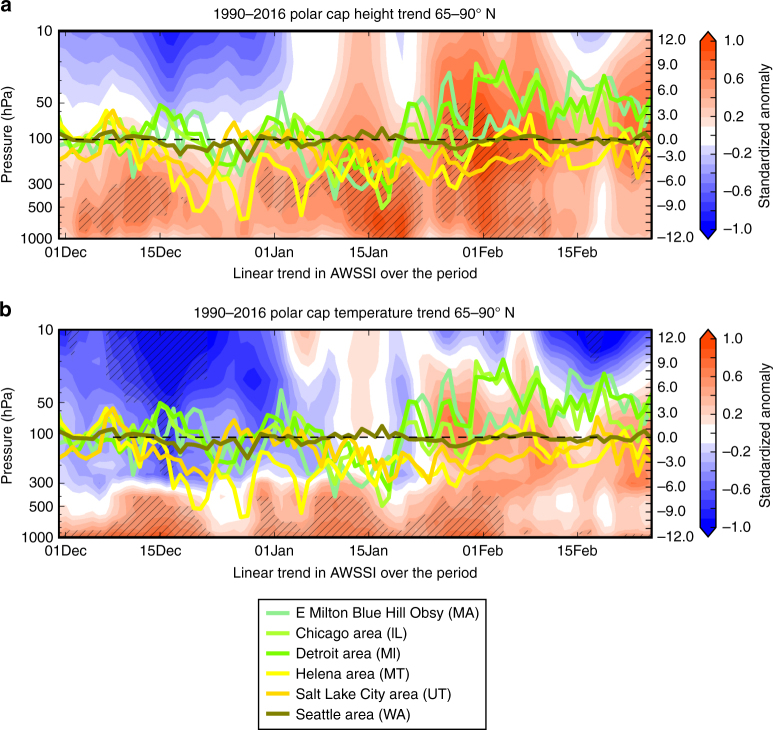
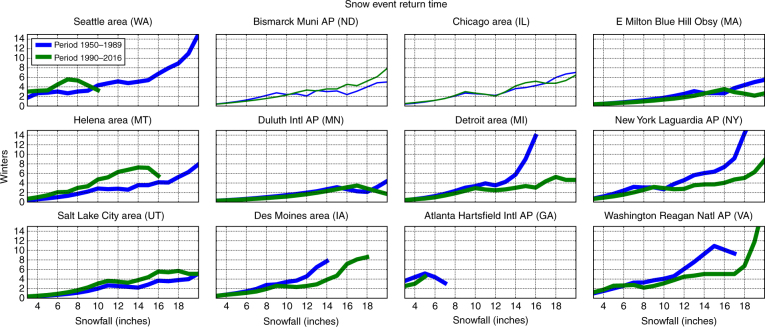
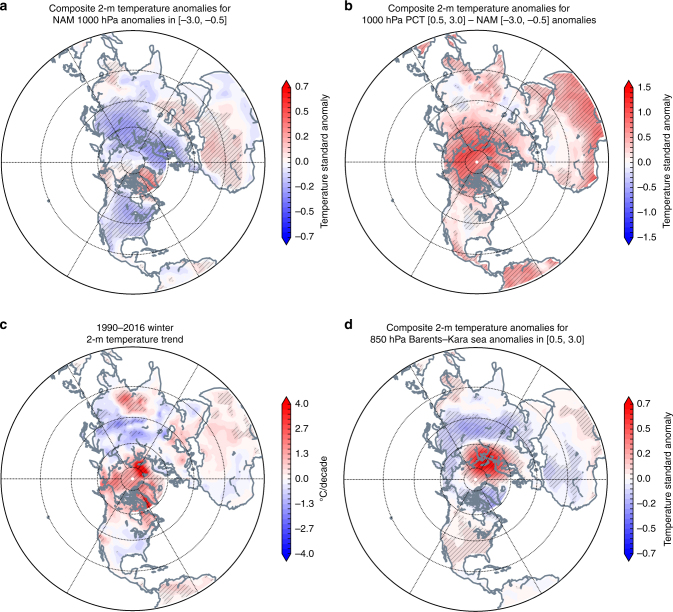
Recent boreal winters have exhibited a large-scale seesaw temperature pattern characterized by an unusually warm Arctic and cold continents. Whether there is any physical link between Arctic variability and Northern Hemisphere (NH) extreme weather is an active area of research. Using a recently developed index of severe winter weather, we show that the occurrence of severe winter weather in the United States is significantly related to anomalies in pan-Arctic geopotential heights and temperatures. As the Arctic transitions from a relatively cold state to a warmer one, the frequency of severe winter weather in mid-latitudes increases through the transition. However, this relationship is strongest in the eastern US and mixed to even opposite along the western US. We also show that during mid-winter to late-winter of recent decades, when the Arctic warming trend is greatest and extends into the upper troposphere and lower stratosphere, severe winter weather-including both cold spells and heavy snows-became more frequent in the eastern United States.


Conflict of interest statement

The authors declare no competing financial interests.

Figures

Fig. 1
Fig. 1
Geographic locations of cites analyzed. We chose a geographically diverse set of 12 cities to analyze Arctic variability and severe winter weather, though we chose more cities in the northeastern and mid-western US where severe winter weather is more common than in other regions of the US
Fig. 2
Fig. 2
Warm Arctic related to increased severe winter weather. The departure from the winter average in daily change in the AWSSI (Accumulated Winter Season Severity Index) at several weather stations across the US during December–February shown at all levels between 1000 and 10 hPa. AWSSI is plotted with composited values of the polar cap geopotential height (PCH, a) and air temperature (PCT, b) standardized anomalies from the surface to the mid-stratosphere (10 hPa), north of 65° N, from 1950 to 2016. Anomalies computed relative to climatology from 1981–2010. Results for all stations are consistently statistically significant at p < 0.01. Statistical significance for both PCH and PCT at selected levels for all cities shown in Supplementary Table 1
Fig. 3
Fig. 3
Warm Arctic related to colder winter temperatures. Temperature contribution to the average daily change in the AWSSI (Accumulated Winter Season Severity Index) at selected weather stations across the US associated with polar cap geopotential height anomalies (PCH) from the surface to the mid-stratosphere (10 hPa) 1950–2016. Anomalies computed relative to climatology from 1981 to 2010
Fig. 4
Fig. 4
Warm Arctic related to increased snowfall. Snowfall contribution to the average daily change in the AWSSI at selected weather stations across the US associated with polar cap geopotential height anomalies (PCH) from the surface to the mid-stratosphere (10 hPa) 1950–2016. Anomalies computed relative to climatology from 1981 to 2010
Fig. 5
Fig. 5
Arctic variability leads occurrence of severe winter weather. The correlation between average daily change in the AWSSI at selected weather stations across the US associated with polar cap geopotential height anomalies (PCH) for all days between ±30 days. The peak value is reached when the PCH leads the AWSSI by 5 days
Fig. 6
Fig. 6
Polar cap variability leads increased severe weather up to 19 days. The average daily change in the AWSSI at selected weather stations across the US associated with polar cap geopotential height anomalies (PCH) from the surface to the mid-stratosphere (10 hPa) during 5–19 days preceding the AWSSI values, 1950–2016
Fig. 7
Fig. 7
As the Arctic warms the continents become colder. Northern Hemisphere surface temperature anomalies plotted for 500 hPa PCH anomalies binned on the intervals a [−3.0, −0.5], b [0.5, 3.0] and 500 hPa PCT c [−3.0, −0.5], and d [0.5, 3.0] for all winters 1950–2016. Climatological averages computed over the period 1981–2010. Where difference was found to be statistically significant above 95% is hatched in light gray (e.g., [−3.0, −0.5] to [0.5, 3.0]). We also tested for field significance in all plots and the differences were found to be highly significant. Ocean mask was applied south of 60° N
Fig. 8
Fig. 8
Warming trend in Arctic coincides with increased severe winter weather. The annual daily trend in the a PCH (shading) and b PCT (shading) from the surface to the mid-stratosphere (10 hPa) and the annual trend in the daily change in the AWSSI for three eastern US cities (near Boston, Chicago, Detroit) and three western US cities (Helena, Salt Lake City, Seattle) for the winters 1990/91–2015/16 multiplied by the total number of winters. Statistical significance above 90% for PCH and PCT trends are hatched in dark gray. In Supplementary Figure 8 we have included the variability in the AWSSI with the daily trend
Fig. 9
Fig. 9
Major snowfalls in eastern US are becoming more frequent. The return period (y axis; 0 to 15 years) of varying snowfall events (x axis; 0 to 18 inches) for weather stations during two periods: cold Arctic (1950–1989; blue) and warm Arctic (1990–2016; green). Lower values indicate more frequent snowfalls (shorter return period). The time series that were found to be significantly different at the 95% confidence level are shown in bold lines and include Atlanta, Boston (Blue Hill), Des Moines, Detroit, Helena, New York, Salt Lake City, Seattle, and Washington
Fig. 10
Fig. 10
Arctic amplification is more closely associated with polar cap temperature than annular mode or warming in the Barents–Kara seas. a Surface temperature anomalies associated with the negative phase of the NAM, b difference in surface temperature anomalies associated with positive PCT at 1000 hPa and the negative NAM, c Northern Hemisphere surface temperatures trends in era of AA (1990–2016), d association between surface temperature anomalies across the NH and in the Barents–Kara seas. Climatological averages computed over the period 1981–2010. Note differences in scales. Hatching in all figures represents those values found to be statistically significant above 95%. We also tested for field significance in plots a, b, and d and the differences were found to be highly significant. Ocean mask was applied south of 60° N

References

    1. Madden RA. Estimates of the natural variability of time-averaged sea-level pressure. Mon. Weather Rev. 1976;104:942–952. doi: 10.1175/1520-0493(1976)104<0942:EOTNVO>2.0.CO;2. - DOI
    1. Shukla J, Guzzler DS. Internal variability and predictability of 500 mob geopotential heights over the Northern Hemisphere. Mon. Weather Rev. 1983;111:1273–1279. doi: 10.1175/1520-0493(1983)111<1273:IVAPOM>2.0.CO;2. - DOI
    1. Phelps MW, Kumar A, O’Brien JJ. Potential predictability in the NCEP CPC dynamical seasonal forecast system. J. Clim. 2004;17:3775–3785. doi: 10.1175/1520-0442(2004)017<3775:PPITNC>2.0.CO;2. - DOI
    1. Cohen J. An observational analysis: Tropical relative to Arctic influence on mid-latitude weather in the era of Arctic amplification. Geophys. Res. Lett. 2016;43:5287–5294. doi: 10.1002/2016GL069102. - DOI
    1. Vihma T. Effects of Arctic sea ice decline on weather and climate: a review. Surv. Geophys. 2014;35:1175–1214. doi: 10.1007/s10712-014-9284-0. - DOI

Publication types