. 2018 Mar 13;9(1):1045.
doi: 10.1038/s41467-018-03309-6.

Benchmarking common quantification strategies for large-scale phosphoproteomics

Affiliations

Benchmarking common quantification strategies for large-scale phosphoproteomics

Alexander Hogrebe et al. Nat Commun. .

Abstract

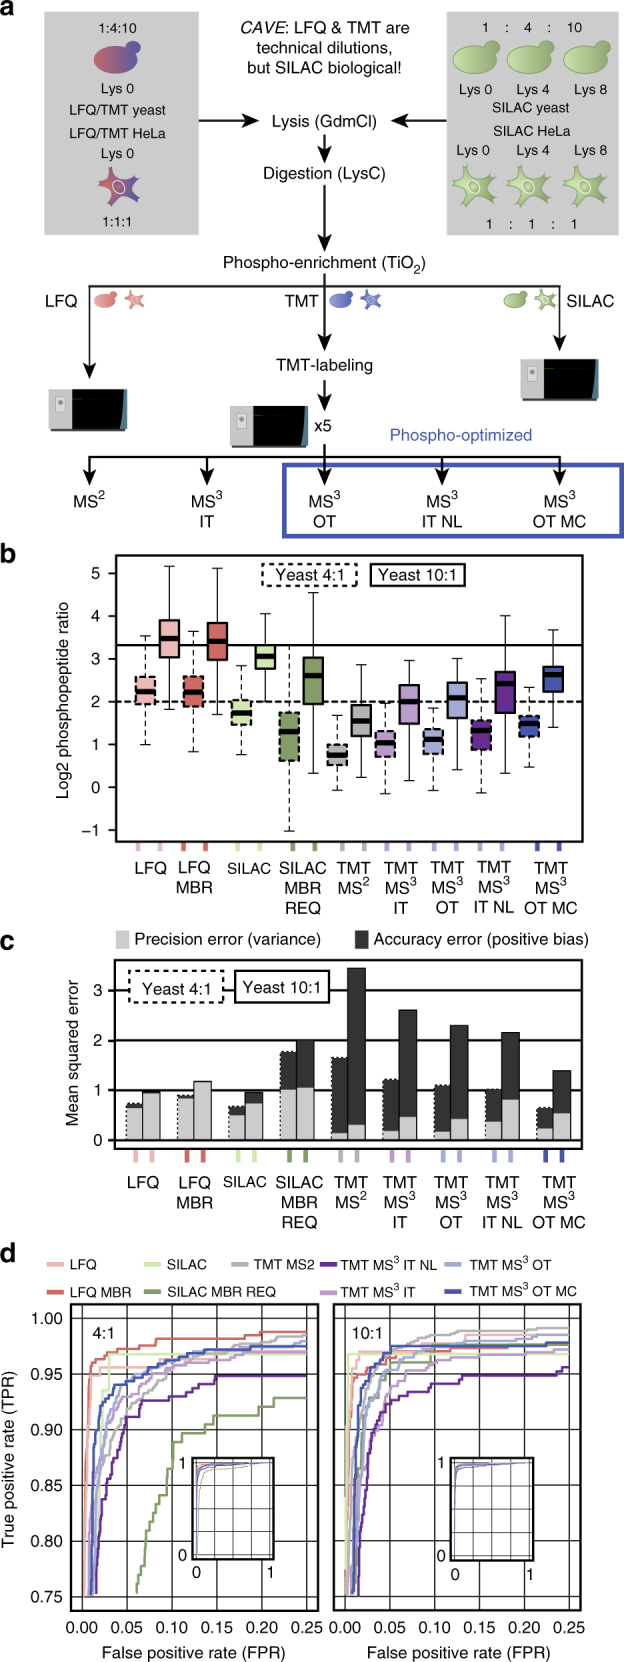
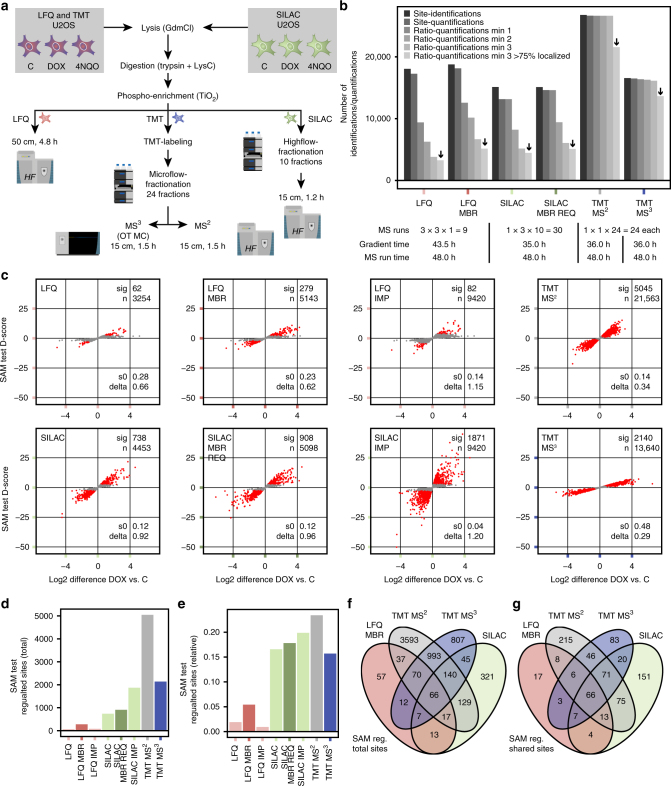
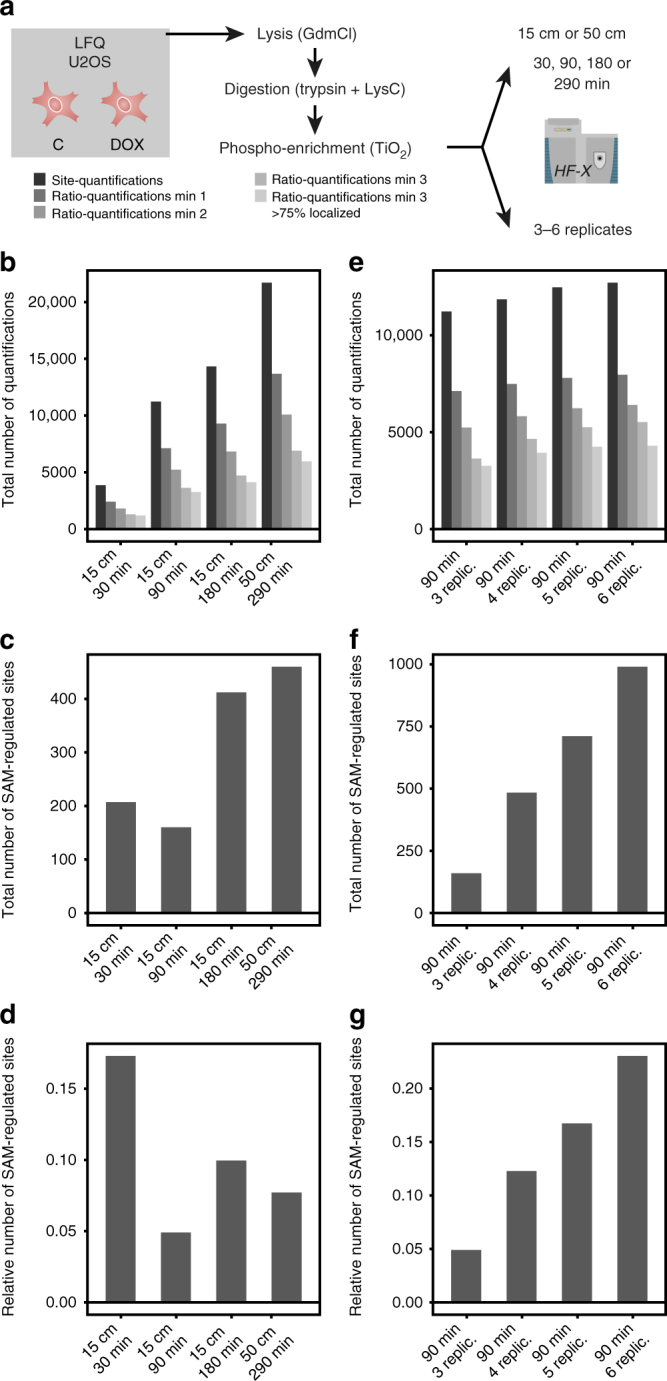
Comprehensive mass spectrometry (MS)-based proteomics is now feasible, but reproducible quantification remains challenging, especially for post-translational modifications such as phosphorylation. Here, we compare the most popular quantification techniques for global phosphoproteomics: label-free quantification (LFQ), stable isotope labeling by amino acids in cell culture (SILAC) and MS2- and MS3-measured tandem mass tags (TMT). In a mixed species comparison with fixed phosphopeptide ratios, we find LFQ and SILAC to be the most accurate techniques. MS2-based TMT yields the highest precision but lowest accuracy due to ratio compression, which MS3-based TMT can partly rescue. However, MS2-based TMT outperforms MS3-based TMT when analyzing phosphoproteome changes in the DNA damage response, since its higher precision and larger identification numbers allow detection of a greater number of significantly regulated phosphopeptides. Finally, we utilize the TMT multiplexing capabilities to develop an algorithm for determining phosphorylation site stoichiometry, showing that such applications benefit from the high accuracy of MS3-based TMT.


Conflict of interest statement

The authors declare no competing interests.

Figures

Fig. 1
Fig. 1
Evaluation of phosphorylation-optimized MS2- and MS3-based TMT methods. a Colored peaks illustrate MSn peak selection. MS2 analysis either took place in the orbitrap (OT) or ion trap (IT). Ion selection for MS3 analysis was based on synchronous precursor selection (SPS) or neutral loss (NL)-triggered peak isolation. In the multiple charge state (MC) method, the MS3 isolation width was decreased for higher charge states. IT, OT and OT MC used multi-stage activation (MSA) with neutral loss mass 97.9673 Da. b Heatmap of correlation slopes of the 5% highest and lowest log2 ratios for all replicates. U2OS cells were treated 2 h with 5 µM doxorubicin (DOX) or DMSO (C). The resulting TMT sample was measured on an Orbitrap Fusion Lumos three times as technical replicates with each quantification method. c Bar plot showing the total number of quantified phosphopeptide DOX vs. C ratios per method for all replicates. d Violin plot showing log 10 signal-to-noise ratio distributions of the TMT reporter ions with the median marked as a dash
Fig. 2
Fig. 2
Evaluation of quantification methods with focus on accuracy and precision. a Yeast phosphopeptides were diluted in fixed ratios 1:4:10 and added to a background of 1:1:1 HeLa phosphopeptides. Same total protein starting amounts were used for each method and SILAC ratios were mixed before digestion. All samples were measured on an Orbitrap Fusion Lumos three times as technical replicates with each quantification method. For SILAC and TMT, MS samples were diluted to contain a total peptide amount equal to one LFQ injection based on protein starting amount. For TMT, all mixing replicates were measured within the same TMT10-plex run. b Box plot showing yeast 4:1 and 10:1 phosphopeptide ratios for the different quantification methods and all replicates. Boxes mark the first and third quartile, with the median highlighted as dash, and whiskers marking the minimum/maximum value within 1.5 interquartile range. Outliers are not shown. Both LFQ and SILAC were tested with and without the MaxQuant feature match-between-runs (MBR), and SILAC additionally with both MBR and requantify (REQ) activated. As SILAC-MBR only results were essentially identical to SILAC only, they are not shown here. c Mean squared errors were calculated as a sum of positive bias and variance for each method and all replicates. d Receiver operating characteristic (ROC) curves were calculated by using the d-score from SAM testing as an indicator for significant regulation at 4:1 and 10:1 dilution. SAM testing for significantly regulated phosphopeptides was performed at default settings (s0 estimation automatic). ROC plots are presented as zoomed-in excerpts from the total plots, shown on the lower right each
Fig. 3
Fig. 3
Evaluation of quantification methods in a biological setting. a Non- or SILAC-labeled U2OS cells were treated with 5 µM doxorubicin (DOX), 2.5 µM 4-nitroquinoline 1-oxide (4NQO) or DMSO (C) for 2 h before lysis. Three biological replicates were measured for all quantification methods. For MS measurement, each quantification method was given a total of 2 days instrument time (including LC overhead). SILAC samples were fractionated into ten fractions per sample on an Ultimate 3000 high-flow system, and TMT into 24 fractions total on an Ultimate 3000 micro-flow system. Samples were then measured using a 15- or 50-cm (only LFQ) column on a Q Exactive HF or Orbitrap Fusion Lumos (only TMT MS3 OT MC). For SILAC and TMT, MS samples were injected without dilution, so that each labeling channel resembles one LFQ injection. b Bar plot showing total numbers of identified and quantified phosphopeptides for all replicates of each quantification method, respectively. Calculations of ratios were performed within biological replicates and filtered for measurement in a minimum of one, two or three replicates, and >75% confident phosphorylation site localization. For further analysis, ratios quantified in all three replicates only and with a localization probability of at least 75% (black arrows) were used. c SAM-based identification of significantly regulated phosphorylation sites was performed with two sample paired t-test and standard settings (s0 estimation automatic, delta estimation based on FDR = 0.20). Significantly regulated phosphorylation sites (sig) are highlighted in red, non-significant sites in gray. Applied s0 and delta values, as well as the total number of tested phosphorylation sites (n) are shown. For LFQ and SILAC nearest neighbor imputation (IMP), phosphorylation sites quantified in at least one replicate and with a localization probability of at least 75% were used. d, e The bar plots show the number of significantly regulated phosphorylation sites for each quantification method d in total, and e as a fraction relative to the total number of tested sites. f, g The Venn diagrams show the overlap of SAM-regulated phosphorylation sites identified f in total, and g for commonly identified sites
Fig. 4
Fig. 4
Identification of significantly regulated phosphorylation sites using LFQ. a U2OS cells were treated with 5 µM doxorubicin (DOX) or DMSO (C) for 2 h before lysis. For the gradient experiment (bd), samples were measured in three biological replicates using a 15-cm column with a 30, 90 or 180-min gradient, or a 50-cm column with a 290-min gradient on a Q Exactive HF-X. The shorter gradients are all time-compressed versions of the 290-min gradient, and all other LC-MS instrument settings were kept identical between conditions. For the number of replicates experiment (eg), samples were measured in six replicates using the 90-min gradient setup on a Q Exactive HF-X, and 3−6 biological replicates (replic.) were used for statistical analysis. b, e Bar plots showing total numbers of identified and quantified phosphopeptides for the depicted gradients and number of replicates. Calculations of ratios were performed within biological replicates and filtered for measurement in a minimum of one, two or three replicates, and >75% confident phosphorylation site localization. For further analysis, ratios quantified in all three replicates only and with a localization probability of at least 75% were used. c, f The bar plots show the total number os significantly regulated phosphorylation sites. d, g The bar plots show the number of significantly regulated phosphorylation sites as a fraction relative to the total number of tested sites. SAM-based identification of significantly regulated phosphorylation sites was performed with two sample paired t-test and standard settings (s0 estimation automatic, delta estimation based on FDR = 0.20)
Fig. 5
Fig. 5
Functional characterization of significantly regulated phosphorylation sites. a iceLogos of the SAM-upregulated phosphorylation sites from Fig. 3c vs. the respective non-regulated sites as background. The iceLogos show the ATM/ATR kinase substrate [s/t]Q motif significantly enriched for all tested quantification approaches. b, c Heat maps showing b a kinase motif and c GO-term enrichment of significantly SAM-up/downregulated phosphorylation sites from Fig. 3c vs. the respective non-regulated sites as background. Enrichment was performed using Fisher exact tests within Perseus with relative enrichment on gene level and an FDR of 0.02. The numbers above the heatmap show the total number of enriched motifs/GO-terms, while the heat maps below show b the most significantly regulated motifs or c all GO-terms with “damage”, “repair”, “checkpoint”, “cell cycle”, or “chromosome”, indicative of an activated DDR, respectively
Fig. 6
Fig. 6
3D multiple regression model-based calculation of phosphorylation stoichiometry. a Phosphorylation stoichiometry can be extracted by feeding phospho-, non-phospho- and protein-intensity data into a 3D multiple regression model (3DMM). More detailed explanations are given in Supplementary Note 1. b For benchmarking stoichiometry calculation via MS2- and MS3-based TMT, yeast and HeLa phosphopeptides were each half dephosphorylated with Rapid alkaline phosphatase. Yeast phospho- and non-phospho-peptides were then diluted in fixed ratios to create samples with set phosphopeptide stoichiometry, and added to equal amounts of HeLa phospho- and non-phospho-peptides serving as a contaminating background. The sample was measured three times as technical replicates each with MS2- and OT MC MS3-based TMT quantification. In this setup, protein intensities were set to 1 in the 3DMM. c 3DMM-extracted p-values describing the significance of the slope being non-zero were correlated against the difference of MS2- and MS3-estimated stoichiometry vs. the true value of 10%. d Scatter plots showing estimated stoichiometry determined in TMT MS2 and MS3 mode, with three different levels of 3DMM p-value cutoffs. e Mean squared errors were calculated as a sum of positive bias and variance for all replicates of both MS2- and MS3-based TMT at different 3DMM p-value cutoffs

References

    1. Olsen JV, et al. Global, in vivo, and site-specific phosphorylation dynamics in signaling networks. Cell. 2006;127:635–648. doi: 10.1016/j.cell.2006.09.026. - DOI - PubMed
    1. Huttlin EL, et al. A tissue-specific atlas of mouse protein phosphorylation and expression. Cell. 2010;143:1174–1189. doi: 10.1016/j.cell.2010.12.001. - DOI - PMC - PubMed
    1. Mertins P, et al. Proteogenomics connects somatic mutations to signalling in breast cancer. Nature. 2016;534:55–62. doi: 10.1038/nature18003. - DOI - PMC - PubMed
    1. Kelstrup CD, Young C, Lavallee R, Nielsen ML, Olsen JV. Optimized fast and sensitive acquisition methods for shotgun proteomics on a quadrupole orbitrap mass spectrometer. J. Proteome Res. 2012;11:3487–3497. doi: 10.1021/pr3000249. - DOI - PubMed
    1. Kelstrup CD, et al. Rapid and deep proteomes by faster sequencing on a benchtop quadrupole ultra-high-field Orbitrap mass spectrometer. J. Proteome Res. 2014;13:6187–6195. doi: 10.1021/pr500985w. - DOI - PubMed

Publication types

Substances