. 2018 Mar 13;8(1):4405.
doi: 10.1038/s41598-018-22689-9.

Organ-specific responses during brain death: increased aerobic metabolism in the liver and anaerobic metabolism with decreased perfusion in the kidneys

Affiliations

Organ-specific responses during brain death: increased aerobic metabolism in the liver and anaerobic metabolism with decreased perfusion in the kidneys

A C Van Erp et al. Sci Rep. .

Abstract

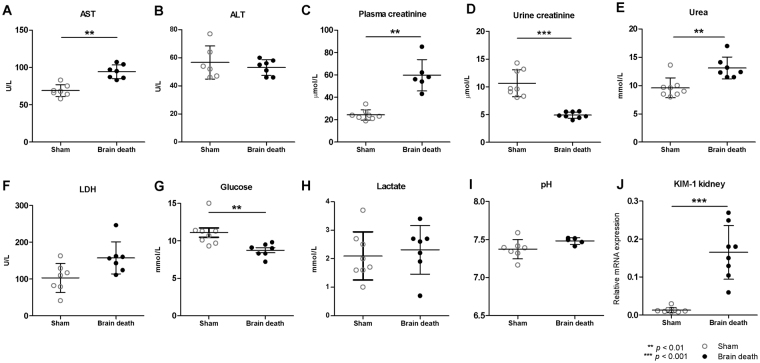
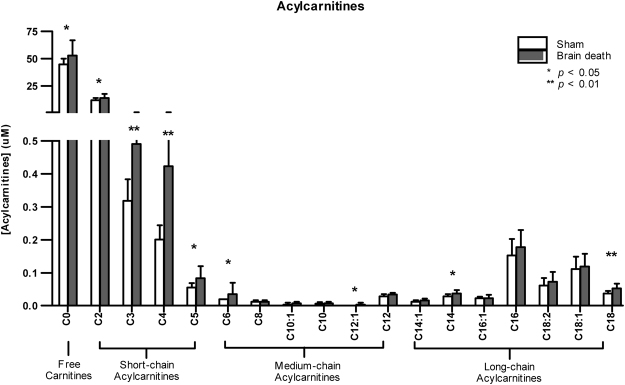
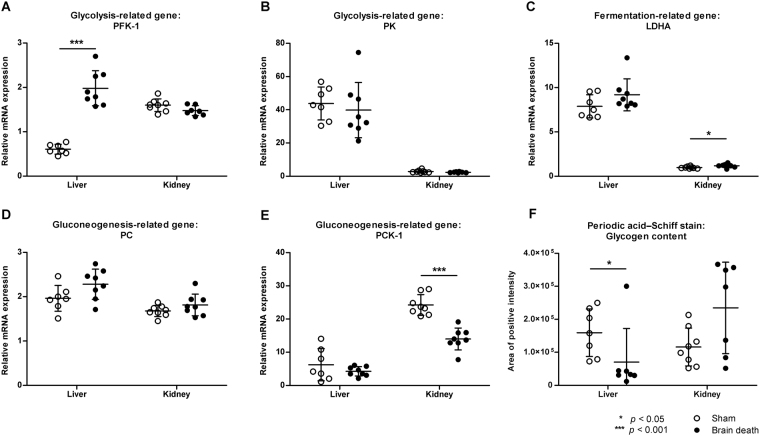
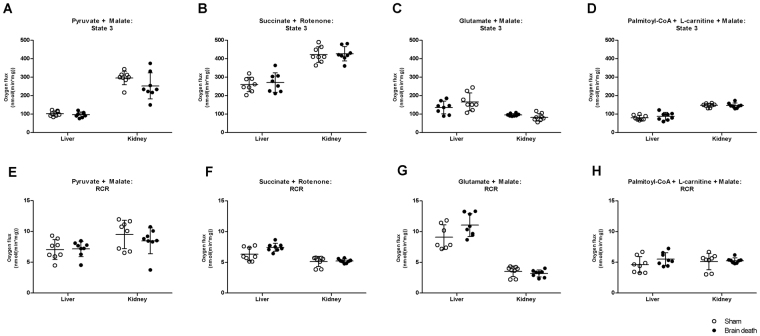
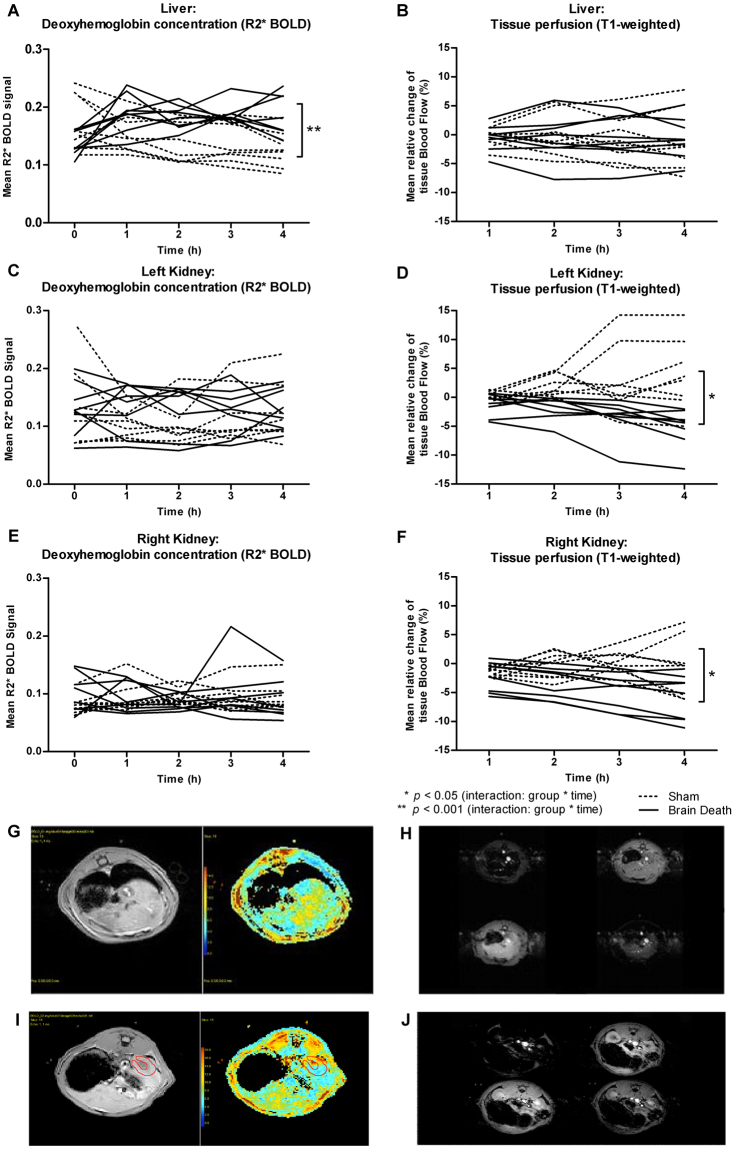
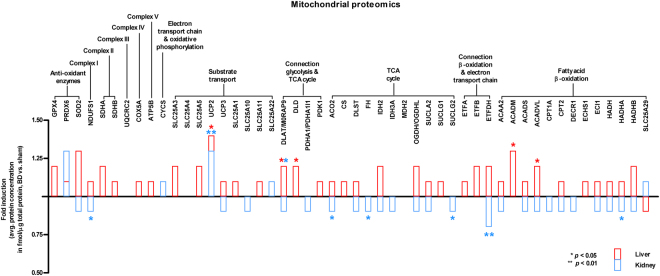
Hepatic and renal energy status prior to transplantation correlates with graft survival. However, effects of brain death (BD) on organ-specific energy status are largely unknown. We studied metabolism, perfusion, oxygen consumption, and mitochondrial function in the liver and kidneys following BD. BD was induced in mechanically-ventilated rats, inflating an epidurally-placed Fogarty-catheter, with sham-operated rats as controls. A 9.4T-preclinical MRI system measured hourly oxygen availability (BOLD-related R2*) and perfusion (T1-weighted). After 4 hrs, tissue was collected, mitochondria isolated and assessed with high-resolution respirometry. Quantitative proteomics, qPCR, and biochemistry was performed on stored tissue/plasma. Following BD, the liver increased glycolytic gene expression (Pfk-1) with decreased glycogen stores, while the kidneys increased anaerobic- (Ldha) and decreased gluconeogenic-related gene expression (Pck-1). Hepatic oxygen consumption increased, while renal perfusion decreased. ATP levels dropped in both organs while mitochondrial respiration and complex I/ATP synthase activity were unaffected. In conclusion, the liver responds to increased metabolic demands during BD, enhancing aerobic metabolism with functional mitochondria. The kidneys shift towards anaerobic energy production while renal perfusion decreases. Our findings highlight the need for an organ-specific approach to assess and optimise graft quality prior to transplantation, to optimise hepatic metabolic conditions and improve renal perfusion while supporting cellular detoxification.


Conflict of interest statement

The authors declare no competing interests.

Figures

Figure 1
Figure 1
Brain death induced renal failure and caused increased AST and lactate levels, yet decreased glucose levels in plasma. (A) Aspartate transaminase, (B) alanine transaminase, (C) plasma creatinine, (D) urine creatinine (E) urea, (F) lactate dehydrogenase, (G) glucose, and (H) lactate levels in plasma; (I) pH determined with blood gas analyses; and (J) relative gene expression of Kidney Injury Molecule-1 (Kim-1) after 4 hrs of experimental time. Results are presented as mean ± SD, n = 7 per group (**p < 0.01).
Figure 2
Figure 2
Brain death increased fatty acid β oxidation. After 4 hrs of experimental time, plasma concentrations of saturated and unsaturated acylcarnitines were measured in sham and brain-dead rats with different carbon (C) chain lengths: short (C0–C5), medium (C6–C12), and long (C14–C18) chain acylcarnitines. Data are represented as mean ± SD, n = 8 per group (*p < 0.05, **p < 0.01, compared to sham).
Figure 3
Figure 3
Carbohydrate metabolism-related gene expression profiles and glycogen content in the liver and kidney after 4 hrs of brain death. Relative gene expression of glycolysis related genes (A) Phosphofructokinase-1 (Pfk-1) and (B) Pyruvate kinase (Pk), (C) anaerobic glycolysis-related gene Lactate dehydrogenase A (Ldha), and gluconeogenesis related genes (D) Pyruvate carboxylase (Pc) and (E) PEP carboxykinase 1 (Pck-1). (F) Periodic Acid–Schiff staining of glycogen, overall quantification at 20 × magnification. Results are presented as mean ± SD, n = 8 per group (*p < 0.05, ***p < 0.001).
Figure 4
Figure 4
Mitochondrial respiration is unaffected in the liver and kidney following brain death. Maximal ADP-stimulated (state 3) O2 consumption rate and Respiratory Control Ratio (RCR) tested using substrates related to (A,E) the TCA cycle (Glutamate + Malate); (B,F) complex II-dependent respiration (Succinate + Rotenone); (C,G) glutamate transaminase (Glutamate + Malate); and (D,H) fatty acid β-oxidation (Palmitoyl-CoA + L-carnitine + Malate). Results are presented as mean ± SD, n = 8 per group.
Figure 5
Figure 5
Increased hepatic deoxyhaemoglobin concentration and decreased renal blood flow during brain death. (A,C,E) Hourly, R2* BOLD Magnetic Resonance Imaging (MRI) was performed to estimate deoxyhaemoglobin levels in brain-dead and sham rats, where time “0” represents baseline measurements. (B,D,F) Hourly, T1-weighted MRI data was used to estimate the relative change in tissue blood flow compared to baseline measurements in brain-dead and sham animals. Results are presented as mean ± SD, n = 8 per group (interaction group * time: *p < 0.05, **p < 0.001) (G,I) An example of a greyscale T2 map for liver (G) and kidney (I) tissue with on the left-hand side a grayscale, T2 signal image. On the right-hand side a T2*-weighted signal is represented as a colour map. (H,J) Examples of T1 signal images of liver (H) and kidney (J) tissue at different inversion times. From the top left to bottom right the signal passes from the vessels through to the tissue.
Figure 6
Figure 6
Mitochondrial proteomics profile. Data are represented as mean fold induction of average protein concentration (fmol/µg total protein) in BD versus sham groups in the liver and kidney. Differences in protein concentrations are considered significant when p < 0.05 in BD versus sham groups per individual organ, n = 8 per group.

Similar articles

Cited by

References

    1. National Data: Donors Recovered in the U.S. by Donor Type. Available at: https://optn.transplant.hrsa.gov/data/view-data-reports/national-data/# (Accessed: 1st March 2017).
    1. Annual Report 2015. Available at: https://eurotransplant.org/cms/mediaobject.php?file=AR_ET_20153.pdf (Accessed: 1st March 2017).
    1. Rudge C, Matesanz R, Delmonico FL, Chapman J. International practices of organ donation. Br J Anaesth. 2012;108(Suppl 1):i48–55. doi: 10.1093/bja/aer399. - DOI - PubMed
    1. Bos EM, Leuvenink HGD, van Goor H, Ploeg RJ. Kidney grafts from brain dead donors: Inferior quality or opportunity for improvement? Kidney International. 2007;72:797–805. doi: 10.1038/sj.ki.5002400. - DOI - PubMed
    1. Terasaki PI, Cecka JM, Gjertson DW, Takemoto S. High survival rates of kidney transplants from spousal and living unrelated donors. N. Engl. J. Med. 1995;333:333–336. doi: 10.1056/NEJM199508103330601. - DOI - PubMed

Publication types