. 2018 Mar 13;9(1):1056.
doi: 10.1038/s41467-018-03348-z.

miR200-regulated CXCL12β promotes fibroblast heterogeneity and immunosuppression in ovarian cancers

Affiliations

miR200-regulated CXCL12β promotes fibroblast heterogeneity and immunosuppression in ovarian cancers

Anne-Marie Givel et al. Nat Commun. .

Abstract

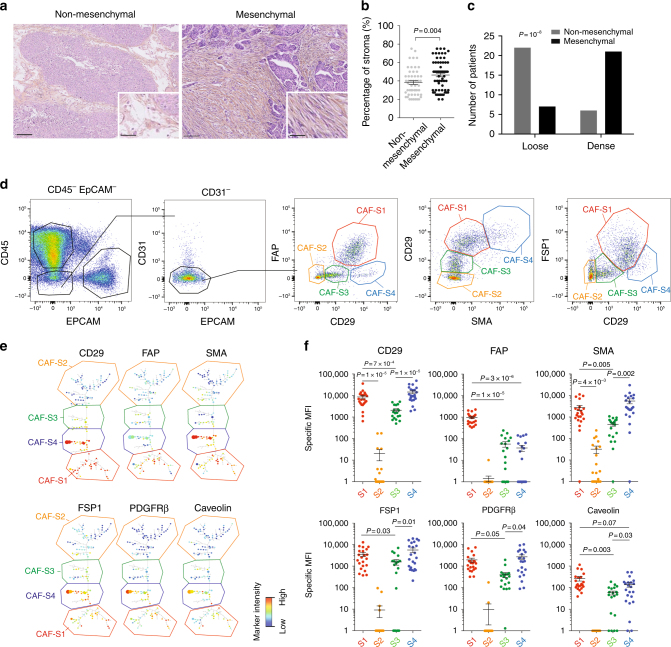
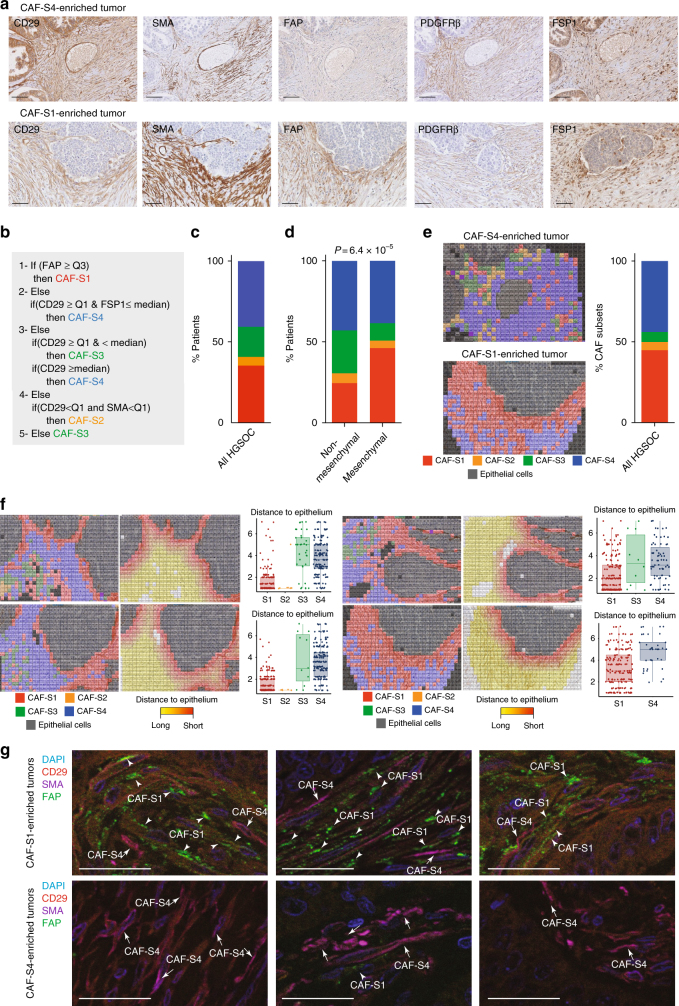
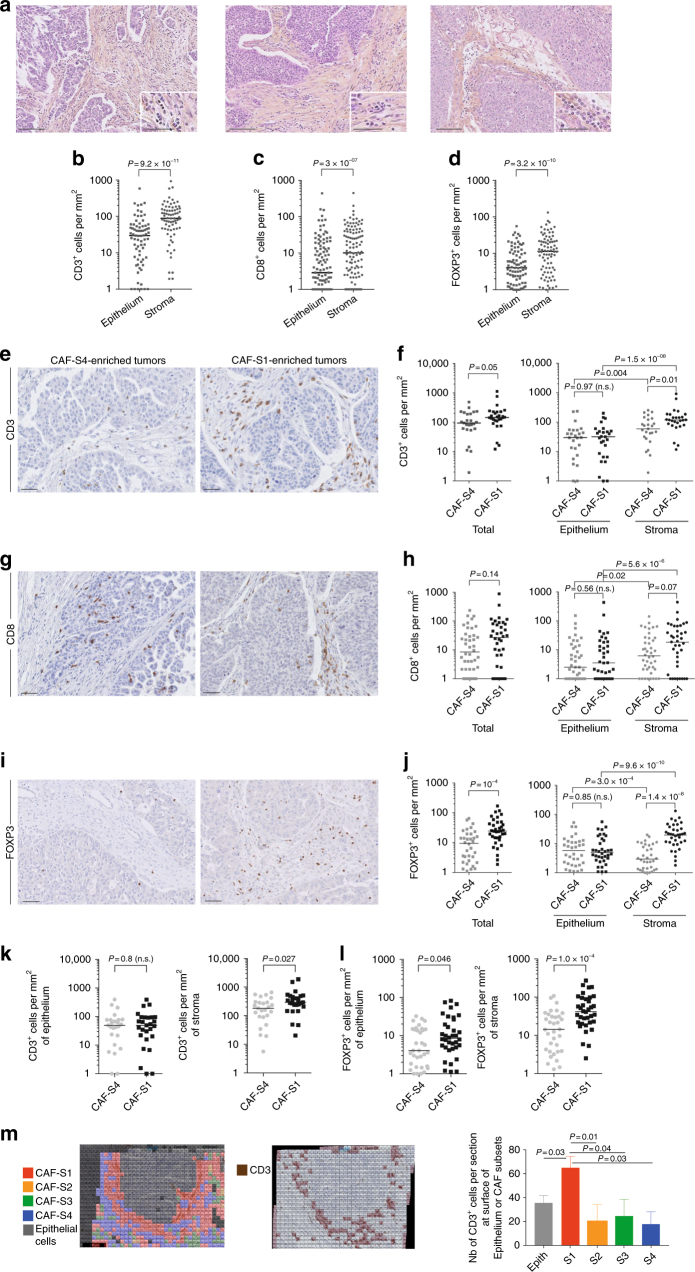
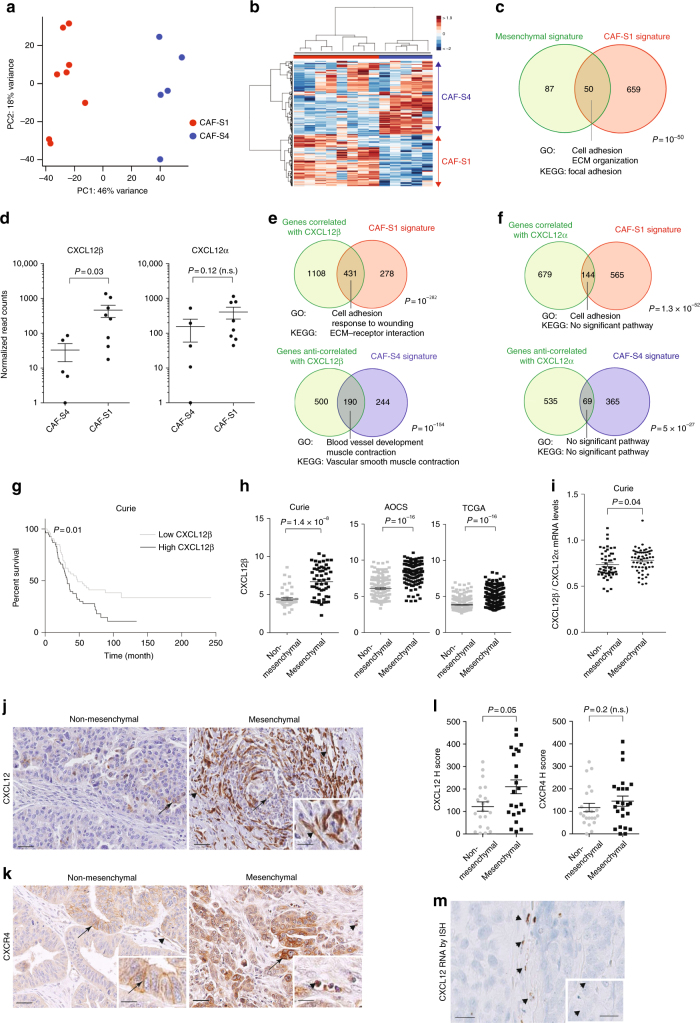
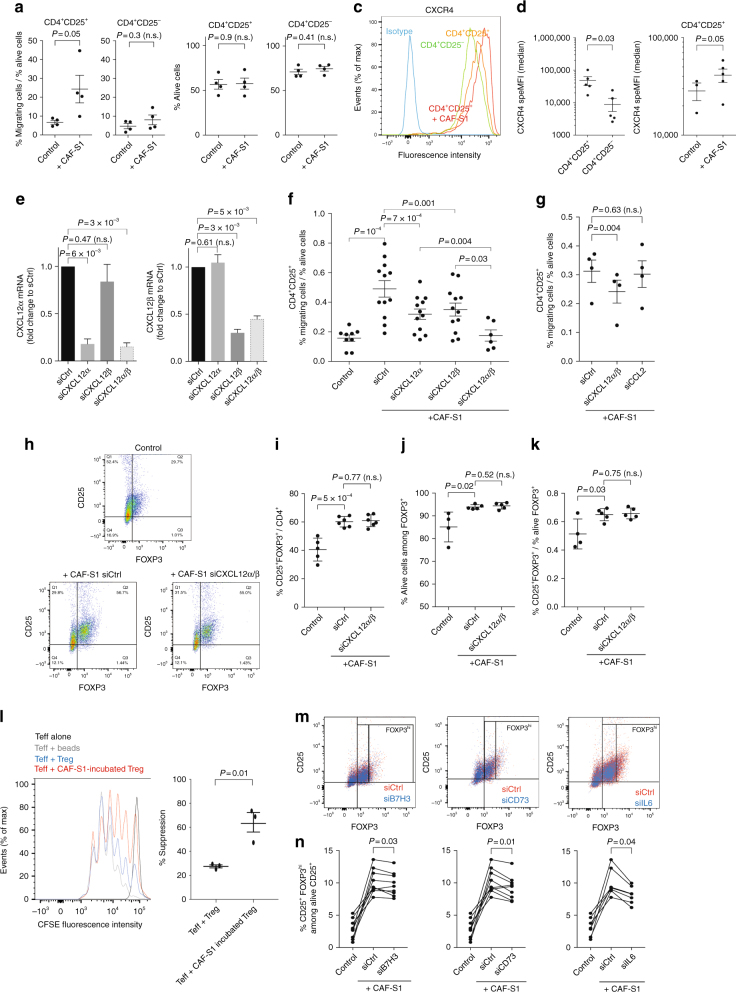
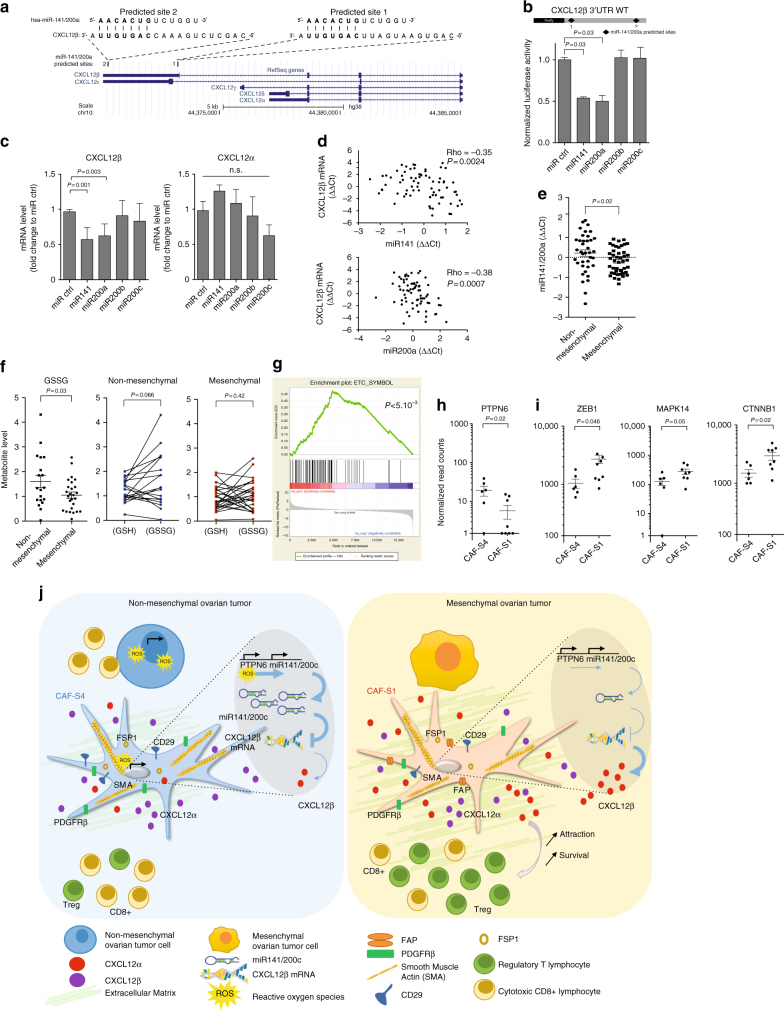
High-grade serous ovarian cancers (HGSOC) have been subdivided into molecular subtypes. The mesenchymal HGSOC subgroup, defined by stromal-related gene signatures, is invariably associated with poor patient survival. We demonstrate that stroma exerts a key function in mesenchymal HGSOC. We highlight stromal heterogeneity in HGSOC by identifying four subsets of carcinoma-associated fibroblasts (CAF-S1-4). Mesenchymal HGSOC show high content in CAF-S1 fibroblasts, which exhibit immunosuppressive functions by increasing attraction, survival, and differentiation of CD25+FOXP3+ T lymphocytes. The beta isoform of the CXCL12 chemokine (CXCL12β) specifically accumulates in the immunosuppressive CAF-S1 subset through a miR-141/200a dependent-mechanism. Moreover, CXCL12β expression in CAF-S1 cells plays a crucial role in CAF-S1 immunosuppressive activity and is a reliable prognosis factor in HGSOC, in contrast to CXCL12α. Thus, our data highlight the differential regulation of the CXCL12α and CXCL12β isoforms in HGSOC, and reveal a CXCL12β-associated stromal heterogeneity and immunosuppressive environment in mesenchymal HGSOC.


Conflict of interest statement

The authors declare no competing interests.

Figures

Fig. 1
Fig. 1
Identification of four CAF subsets in HGSOC. a Representative view of HES staining of non-mesenchymal and mesenchymal HGSOC sections (Institut Curie cohort). Scale bar, 100 μm (low magnification) and 40 μm (inset). b Scatter plot showing the percentage of stroma in HGSOC. N = 107. Data are shown as mean ± SEM. P values are from Mann-Whitney test. c Bar plot showing association of mesenchymal HGSOC with stromal features, defined by pathologists as loose (low stromal cellularity) or dense (high stromal cellularity). N = 56. P value is from Fisher’s Exact Test. d Gating strategy to identify CAF subsets in HGSOC by FACS. Results from a representative HGSOC patient are shown. Cells isolated from freshly dissociated human HGSOC were first gated on DAPI, EPCAM, CD45, CD31 cells, for excluding dead cells (DAPI+), epithelial cells (EPCAM+), hematopoietic cells (CD45+), and endothelial cells (CD31+). Selected cells were next examined using six fibroblast markers. Representative flow cytometry plots show gating strategies based on FAP, CD29, SMA, and FSP1 that allow the identification of four sub-populations of fibroblasts in HGSOC: CAF-S1 are CD29Med FAPHigh SMAHigh FSP1High, CAF-S4 are CD29High FAPLow SMAHigh FSP1Med, CAF-S3 are CD29Low FAPLow SMALow FSP1Med/High and CAF-S2 are CD29Low FAPLow SMALow FSP1Low. e CytoSpade trees annotated with each marker expression in HGSOC analyzed by FACS. Colors show staining intensity for each marker. Size of the nodes is proportional to the number of cells showing similar staining for the markers analyzed. f Scatter plots showing specific mean fluorescent intensity (MFI) detected for each marker in each CAF sub-population. Each dot represents the specific median of fluorescent intensity of the cellular population by patient. N = 22. Data are shown as mean ± SEM. P values are from Student’s t-test
Fig. 2
Fig. 2
Mesenchymal HGSOC accumulate mostly the CAF-S1 subset. a Representative views of CD29, SMA, FAP, PDGFRβ, and FSP1 immunostaining of serial sections in CAF-S4- or CAF-S1-enriched HGSOC. Scale bar, 100 μm. b Decision tree used to define CAF identity, based on four equal quartiles (Q) and median (Mdn) distribution of each CAF marker intensity. Thresholds (Mdn, Q) and order of decisions were first established from FACS data of a prospective cohort of HGSOC patients (N = 22) and next transposed to values of IHC data, using a learning set of tumors containing both non-activated and activated CAF (N = 60). c Bar plot showing percentage of HGSOC according to the predominant CAF subset detected in each tumor. CAF enrichment per tumor is defined by applying the histological scores of all markers on the decision tree described in (b). HGSOC enriched in CAF-S1 (red), CAF-S2 (orange), CAF-S3 (green), or CAF-S4 (blue) are shown as percentage (%). N = 118 HGSOC patients. d Same as in (c) considering mesenchymal (N = 66) versus non-mesenchymal (N = 49) HGSOC. P values are from Fisher’s exact test. e Maps of CAF subsets at cellular level, corresponding to the tumor sections shown in (a). Each square of 225 μm2 corresponded on average to a single cell. Each CAF subset is represented by a color code and epithelial cells are in grey. The bar plot shows the percentage of HGSOC according to the predominant CAF subset evaluated on CAF maps at cellular level (N = 9). f Representative views of CAF maps, with their corresponding heatmaps showing the distances (shortest in red, farthest in yellow) between cancer cells and CAF subsets. Scatter plots show the distance to epithelial cells according to CAF subsets (distance calculated in a maximum area of five successive tiles in x and y). Data are shown as mean ± SEM (n = 425 cells per image in average). P values are from Student’s t-test. g Representative images showing triple immunofluorescence co-staining of CD29 (red), FAP (green), and SMA (violet) markers in HGSOC enriched in CAF-S1 (arrowheads) or CAF-S4 (arrows). Scale bar, 50 μm
Fig. 3
Fig. 3
CAF-S1-enriched HGSOC accumulate FOXP3+ T lymphocytes. a Representative views of HES staining of HGSOC tumor bed sections (Institut Curie cohort) showing lymphocytes accumulation at the surface of the stroma. Scale bar, 100 μm (low magnification) and 50 μm (inset). b−d Scatter plots showing the number of CD3+ (b), CD8+ (c), and FOXP3+ (d) lymphocytes per mm2 in epithelial and stromal compartments in HGSOC. N = 80 HGSOC (Institut Curie). P values are from Wilcoxon signed-rank test. e, g, i Representative views of CD3+ (e), CD8+ (g), and FOXP3+ (i) immunostaining in HGSOC enriched in CAF-S4 or CAF-S1. Scale bar, 50 μm. f, h, i Number of immune cells per mm2 in CAF-S1- and CAF-S4-enriched HGSOC, considering either the whole sections referred to as Total or the epithelial and stromal compartments. Positive cells for each staining were counted manually in at least 5−10 fields per tumor at ×20 magnification. The median is indicated. Mann-Whitney statistical test was performed to compare CAF-S1- versus CAF-S4-enriched tumors and Wilcoxon paired test was used to compare epithelial and stromal compartments within tumors. N = 80 HGSOC (Institut Curie). k, l Scatter plots showing the number of CD3+ (k) and FOXP3+ (j) T lymphocytes per mm2 relative to the stromal or epithelial content per tumor, in CAF-S1- or CAF-S4 enriched HGSOC. P values are from Mann-Whitney test. m Representative views of CAF maps, with the corresponding heatmap showing the localization of CD3+ T lymphocytes (0.25 mm2). The bar plot shows the number of CD3+ T lymphocytes detected at the surface of epithelial cells (Epith) or of each CAF subset cell (n = 936 total cells per image, five images from different HGSOC were analyzed). P values are from Student’s t-test
Fig. 4
Fig. 4
CXCL12β discriminates CAF-S1 and CAF-S4 cells. a PCA based on the 500 most variant transcripts differentiating CAF-S1 (red) and CAF-S4 (blue). b HC (500 most variant transcripts) using Ward’s method with Euclidean distances. Each column represents a CAF subset and each row a gene. Color saturation shows gene expression deviation from the mean (above in red, below in blue). c Venn diagram showing overlap between mesenchymal signature (defined in ref. ) and CAF-S1 signature (Supplementary Data 1). P value is from hypergeometric test. d Scatter plots of CXCL12α (NM_000609) or CXCL12β (NM_199168) mRNA levels in CAF-S1 and CAF-S4 subsets. e, f Venn diagrams showing overlap between genes correlated or anti-correlated with CXCL12β (e) or CXCL12α (f) and CAF-S1 or CAF-S4 signatures (Supplementary Data 1 and 2). P values are from hypergeometric test. g Kaplan−Meier curves of overall survival according to low- and high-CXCL12β mRNA levels (N = 53 in low-CXCL12β subgroup and N = 54 patients in high-CXCL12β subgroup, Institut Curie). P value is based on log-rank test. h Scatter plots showing CXCL12β mRNA levels in mesenchymal and non-mesenchymal HGSOC from the Institut Curie, AOCS, and TCGA cohorts. Data (log2 of probeset (203666_at) intensity) are shown as mean ± SEM. P values are from Mann-Whitney test. i Scatter plot showing ratio of CXCL12α and CXCL12β expression levels in mesenchymal and non-mesenchymal HGSOC of the Institut Curie cohort. Data are shown as mean ± SEM. P values are from Mann-Whitney test. j, k Representative views of CXCL12 (j) and CXCR4 (k) immunostaining in HGSOC. Scale bar, 50 μm (low magnification) and 20 μm (inset). l Scatter plots showing histological scores (H score) of CXCL12 and CXCR4 proteins. H score corresponds to the percentage of positive cells (in CAF and at epithelial cell surface, arrows in j, k) multiplied by the staining intensity. Data are shown as mean ± SEM. P values are from Mann-Whitney test. m Representative view of CXCL12 mRNA detected in fibroblasts by in situ hybridization, using RNAscope® Technology on HGSOC tissue section. Scale bar, 20 μm (low magnification) and 6 μm (inset)
Fig. 5
Fig. 5
CAF-S1 stimulate CD25+FOXP3+ T lymphocytes. a Percentage of CD4+CD25+ or CD4+CD25 lymphocytes migrating towards CAF-S1. Data are shown as mean ± SEM. n = 4 independent experiments. P values from Student’s t-test. b Percentage of alive CD4+CD25+ or CD4+CD25 T lymphocytes in absence (Control) or presence of CAF-S1. Data are shown as mean ± SEM. n = 4. P values from Student’s t-test. c Density curves showing CXCR4 expression in CD4+CD25 (green), untreated CD4+CD25+ (orange) or after culture with CAF-S1 (red), compared to control isotype (blue). Cell count is normalized, as percentage of maximal number of cells (% of max). d CXCR4 protein levels in CD4+CD25 or CD4+CD25+ lymphocytes without (Control) or with CAF-S1. Specific MFI are shown as mean ± SEM. n = 5. P values from paired ttest. e CXCL12α and CXCL12β mRNA levels after silencing of CXCL12α- or/and CXCL12β in CAF-S1 cells. Data are shown as mean ± SEM of fold change to control. n = 5. P values from one sample ttest. f Percentage of migrating CD4+CD25+ lymphocytes after CXCL12α/β silencing in CAF-S1 cells. Data are shown as mean ± SEM. n = 5. P values from paired ttest. g Same as in (f) after CXCL12α/β or CCL2 silencing. n = 3. h Flow cytometry plots showing CD4+CD25+ and FOXP3+ cells in absence (Control) or presence of CAF-S1 transfected with siCtrl or silenced for both CXCL12α and β (siCXCL12α/β). i, j, k Percentages of CD25+FOXP3+ among CD4+ cells (i), of alive CD25+FOXP3+ lymphocytes (j) and of CD25+FOXP3+ lymphocytes relative to alive cells (k). Data are shown as mean ± SEM. n = 4. P values from Student’s t-test. l CFSE fluorescence intensities quantifying CD4+ effector T cells (Teff) proliferation. Teff were incubated alone (black curve), with CD3+CD25+ beads (grey), or in presence of CD4+CD25HighCD127lowCD45RAlow (+Treg) either pre-incubated with CAF-S1 fibroblasts (red) or not (blue). Scatter plot shows percentage of suppression (see Methods). m Flow cytometry plots showing CD4+CD25+FOXP3+/− cells without (Control) or with CAF-S1 transfected with siCtrl or silenced for B7H3, CD73 or IL-6. n Percentages of alive FOXP3High lymphocytes as in (m). P values from paired ttest. n ≥ 6
Fig. 6
Fig. 6
CXCL12β mRNA is targeted by miR-141/200a in CAF-S4. a Schema (from https://genome.ucsc.edu) of CXCL12 human genomic locus. Two predicted miR141/200a sites are shown, site 1 specific of CXCL12β and site 2 also detected in CXCL12ε. b Normalized luciferase activity of CXCL12β-3’UTR-luciferase reporter construct after co-transfection with miR200s. Values are fold changes of Firefly/Renilla activity ratio (normalized to control) ± SEM. n = 2. P values from Student’s t-test. c CXCL12α and CXCL12β mRNA levels in miR-200-overexpressing CAF-S1. Data are mean of fold change ± SEM. n = 3. P values from Student’s t-test. d Correlation plots between CXCL12β mRNA and miR-141 or miR-200a levels. P values from Spearman’s test. e miR-141/miR-200a levels in non-mesenchymal (N = 38) versus mesenchymal (N = 45) HGSOC (Institut Curie cohort). Normalized cycle thresholds are centered to the mean (ΔΔCt). P value from Student’s t-test. f Reduced (GSH) and oxidized (GSSG) glutathione levels evaluated by mass spectrometry in non-mesenchymal (N = 19) and mesenchymal (N = 25) HGSOC. P value from Student’s t-test (non-mesenchymal/mesenchymal) and paired ttest (GSH/GSSG). g Significant enrichment of electron transport chain (ETC) gene signature in CAF-S4. P refers to false discovery rate q-value. h, i PTPN6 (h) and ZEB1, MAPK14, CTNNB1 (miR-141/200a-target genes,,) (i) mRNA levels in CAF-S1 and CAF-S4. Data are mean ± SEM. P values from Student’s t-test. j Model, mesenchymal HGSOC, accumulate a dense stroma enriched in CAF-S1 fibroblasts (Right). CAF-S1, characterized by expression of FAP, SMA and PDGFRβ, promotes attraction of regulatory T cells through CXCL12β and CXCL12α. CAF-S4 fibroblasts accumulate in non-mesenchymal HGSOC (Left), characterized by genes correlated with miR-200,, involved in oxidative stress response. Accordingly, non-mesenchymal HGSOC suffer from a chronic oxidative stress. CAF-S4 fibroblasts exhibit lower levels of CXCL12β mRNA than CAF-S1, and thus show reduced attraction of regulatory T lymphocytes. In contrast to CXCL12α, CXCL12β is targeted by miR-141/200a that accumulate in CAF-S4-enriched non-mesenchymal HGSOC

Similar articles

Cited by

References

    1. Audeh MW, et al. Oral poly(ADP-ribose) polymerase inhibitor olaparib in patients with BRCA1 or BRCA2 mutations and recurrent ovarian cancer: a proof-of-concept trial. Lancet. 2010;376:245–251. doi: 10.1016/S0140-6736(10)60893-8. - DOI - PubMed
    1. Fong PC, et al. Poly(ADP)-ribose polymerase inhibition: frequent durable responses in BRCA carrier ovarian cancer correlating with platinum-free interval. J. Clin. Oncol. 2010;28:2512–2519. doi: 10.1200/JCO.2009.26.9589. - DOI - PubMed
    1. Ledermann J, et al. Olaparib maintenance therapy in platinum-sensitive relapsed ovarian cancer. N. Engl. J. Med. 2012;366:1382–1392. doi: 10.1056/NEJMoa1105535. - DOI - PubMed
    1. Pujade-Lauraine E, Combe P. Recurrent ovarian cancer. Ann. Oncol. 2016;27(Suppl 1):i63–i65. doi: 10.1093/annonc/mdw079. - DOI - PubMed
    1. Mirza MR, et al. Niraparib maintenance therapy in platinum-sensitive, recurrent ovarian cancer. N. Engl. J. Med. 2016;375:2154–2164. doi: 10.1056/NEJMoa1611310. - DOI - PubMed

Publication types