. 2018 Mar 13;9(1):1061.
doi: 10.1038/s41467-018-03278-w.

A LATS biosensor screen identifies VEGFR as a regulator of the Hippo pathway in angiogenesis

Affiliations

A LATS biosensor screen identifies VEGFR as a regulator of the Hippo pathway in angiogenesis

T Azad et al. Nat Commun. .

Abstract

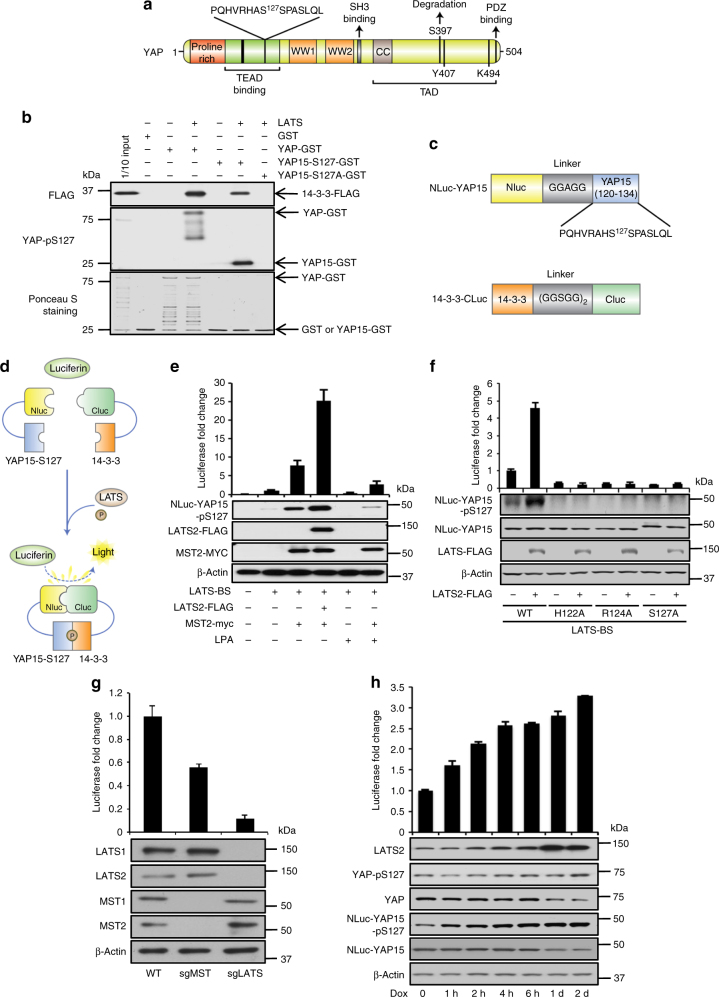
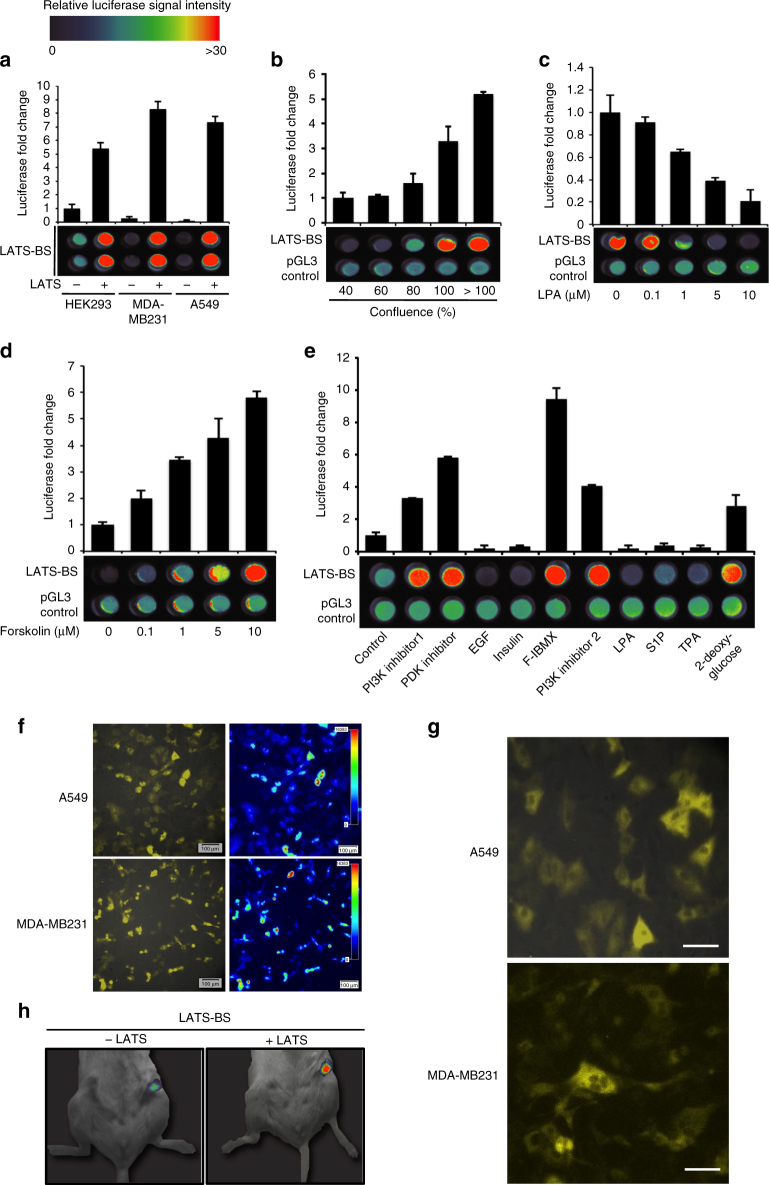
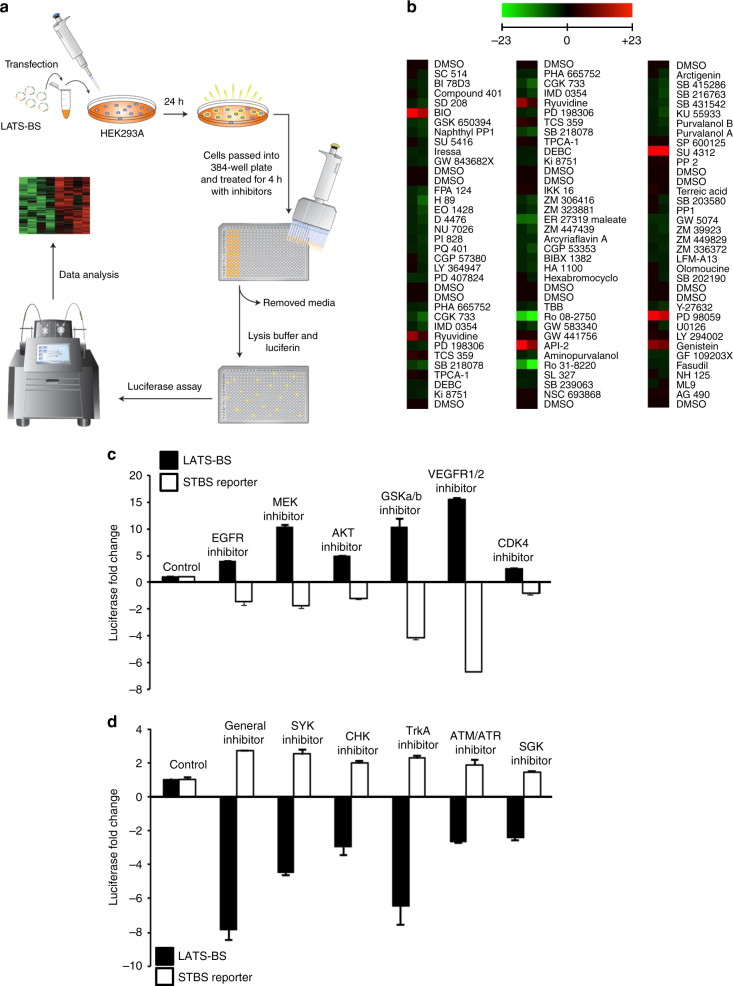
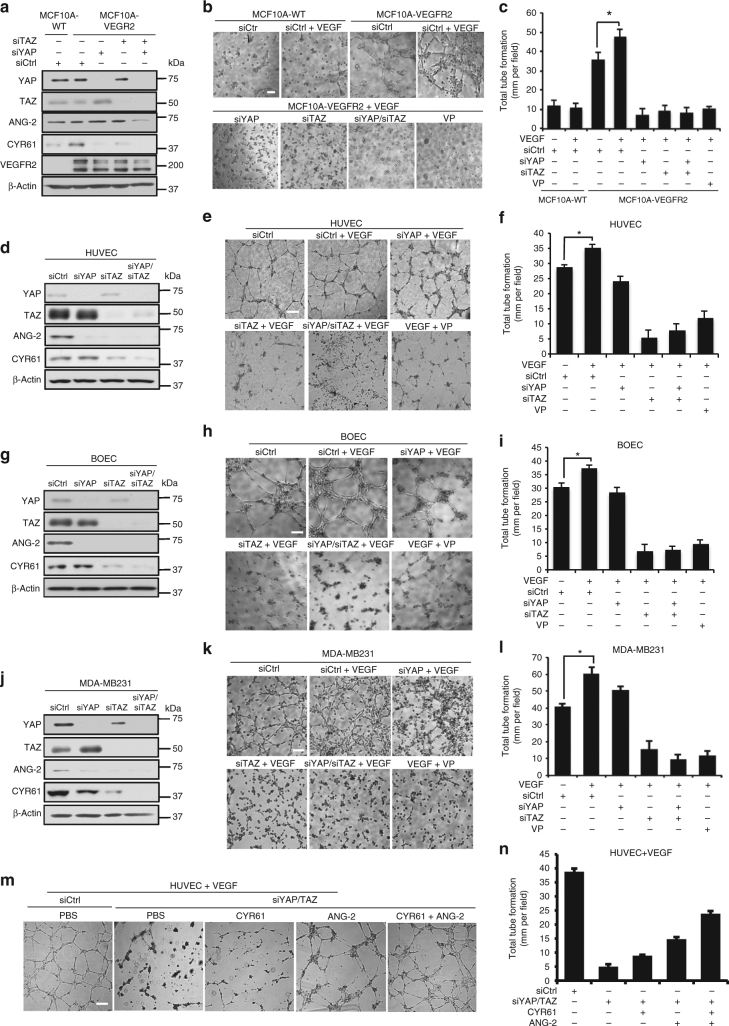
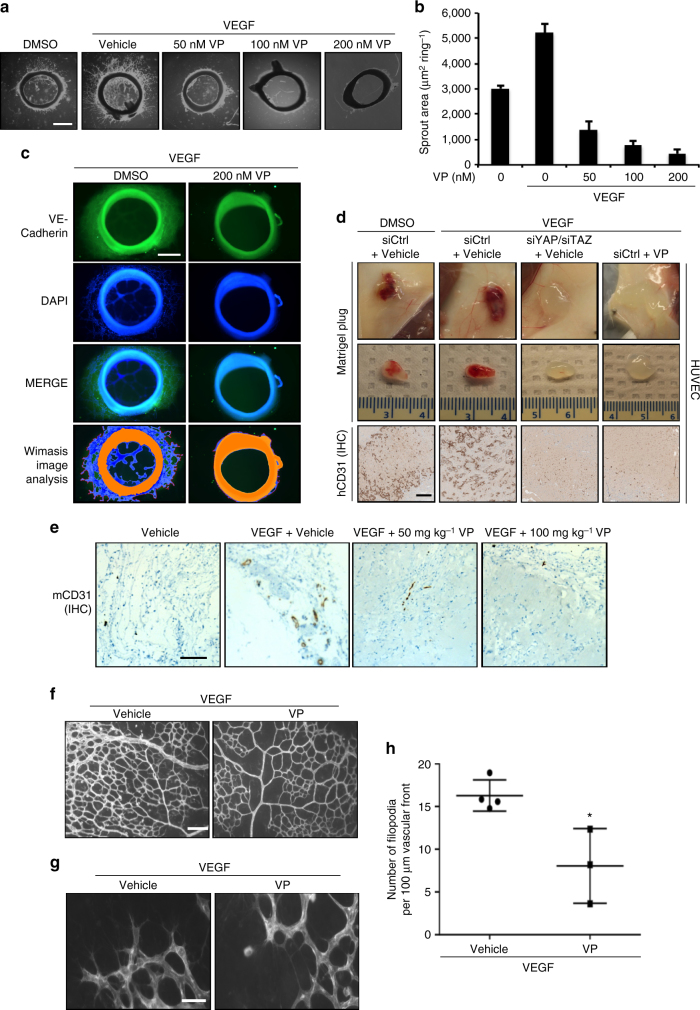
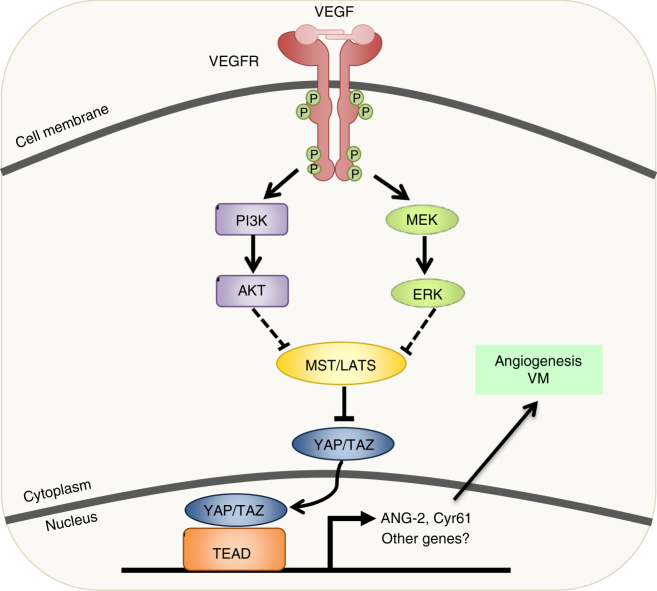
The Hippo pathway is a central regulator of tissue development and homeostasis, and has been reported to have a role during vascular development. Here we develop a bioluminescence-based biosensor that monitors the activity of the Hippo core component LATS kinase. Using this biosensor and a library of small molecule kinase inhibitors, we perform a screen for kinases modulating LATS activity and identify VEGFR as an upstream regulator of the Hippo pathway. We find that VEGFR activation by VEGF triggers PI3K/MAPK signaling, which subsequently inhibits LATS and activates the Hippo effectors YAP and TAZ. We further show that the Hippo pathway is a critical mediator of VEGF-induced angiogenesis and tumor vasculogenic mimicry. Thus, our work offers a biosensor tool for the study of the Hippo pathway and suggests a role for Hippo signaling in regulating blood vessel formation in physiological and pathological settings.


Conflict of interest statement

The authors declare no competing interests.

Figures

Fig. 1
Fig. 1
Establishment of a split luciferase LATS biosensor (LATS-BS). a Schematic diagram of YAP1 structure with LATS phosphorylation site (S127) and surrounding 15 amino acids (YAP15) indicated. b YAP15 is sufficient for interaction with 14-3-3. GST-tagged YAP (YAP-GST), YAP15 with wild-type sequence (YAP15-S127-GST), or LATS phosphorylation-mutant YAP15 (YAP15-S127A-GST) was purified. Five micrograms of GST fusion protein was incubated with recombinant LATS kinase. One hundred micrograms of cell lysate from HEK293 transiently expressing 14-3-3-FLAG was added. YAP, YAP15-S127, or YAP15-S127A/14-3-3 binding was assessed by GST pull-down assay, followed by western blotting. c Domain structure of the LATS-BS. For Nluc-YAP15, firefly luciferase amino acids 1-416 (Nluc) were fused to the N-terminal of YAP15 (120–134) separated by a glycine/alanine linker (5′-GGAGG-3′). For 14-3-3-Cluc, luciferase amino acids 394–550 (Cluc) were fused to the C-terminal of 14-3-3 separated by a glycine/serine linker (5′-GGSGGGGSGG-3′). d Mechanism of action for the LATS-BS. At baseline, there is no interaction between YAP15 and 14-3-3; thus, the LATS-BS shows minimal bioluminescence activity. However, LATS-dependent phosphorylation of YAP15-S127 leads to 14-3-3 binding, luciferase complementation, and high biosensor signal. e Validation of LATS-BS activity. LATS-BS was transfected alone or with LATS2 or/and MST2 into HEK293. Biosensor activity or NLuc-YAP15-S127 phosphorylation was determined 48 h after transfection. For lysophosphatidic acid (LPA) treatment, cells were stimulated with 10 μM LPA for 1 h (n = 3). f LATS-BS responds specifically to LATS kinase activity. Mutation of the LATS kinase consensus motif (HXRXXS/T; H, histidine; R, arginine; S, serine; T, threonine; X, any amino acid) in Nluc-YAP15 abolishes LATS-BS activation and Nluc-YAP15 S127-phosphorylation (n = 3). g LATS-BS activity is reduced by MST or LATS knockout. LATS-BS was transfected into CRISPR-Cas9-generated LATS1/2 or MST1/2 knockout HEK293A. Biosensor activity was determined 48 h after transfection (n = 3). h LATS-BS can be stably expressed to detect LATS activity. HEK293A with doxycycline (Dox)-inducible LATS2 overexpression and stable LATS-BS expression were treated with Dox for the indicated times. Biosensor activity and endogenous YAP (YAP-pS127) phosphorylation status and Nluc-YA15P-S127 (Nluc-YAP15-pS127) were determined by luciferase assay and western blotting, respectively (n = 3). Data are represented as mean ± SD
Fig. 2
Fig. 2
LATS-BS can be used to measure LATS activity in vitro and in vivo. a LATS-BS can be used to assess LATS activity in different cell lines. LATS-BS was transfected alone or together with LATS2-FLAG into HEK293, MDA-MB231, or A549 cells. Biosensor activity was measured by luciferase assay or BLI of live cells (n = 3). For BLI, data were heat-mapped (red signal denotes an increase in LATS-BS activity, whereas blue indicates a decrease). b The LATS-BS responds to cell confluency. LATS-BS or pGL3-control were transfected into HEK293 at different confluencies. After 48 h, biosensor activity was determined by luciferase assay using cell lysate (top) or bioluminescent imaging (BLI) of live cells (bottom) (n = 3). c, d LATS-BS is inhibited by LPA (c) and activated by forskolin (d). LATS-BS or pGL3-control were transfected into HEK293. Cells were treated with increasing concentrations of LPA for 1 h or with forskolin for 30 min before luciferase assay and BLI (n = 3). e LATS-BS responds to drug treatments regulating Hippo signaling. HEK293 were transfected with LATS-BS and treated with the following: PI3K inhibitor 1 (GDC0941), 10 μM for 4 h; PDK inhibitor (GSK2334470), 10 μM for 4 h; EGF, 100 ng ml−1 for 1 h; Insulin, 10 μg ml−1 for 1 h; F/IBMX (Forskolin/IBMX), 10 μM Forskolin/100 μM IBMX for 1 h; PI3K inhibitor 2 (LY294002), 10 μM for 4 h; LPA, 10 μM for 1 h; Sphin gosine1-phosphophate (S1P), 1 μM for 1 h; 12-O-tetradecanoylphorbol-13-acetate (TPA), 5 nM for 1 h; 2-deoxy glucose, 25 mM for 1 h. Biosensor activity was determined by luciferase assay or BLI of live cells (n = 3). f, g LATS-BS can be used to observe LATS activity under the microscope. LATS-BS was stably overexpressed in A549 and MDA-MB231. Cells were imaged using LV200 BLI. Images in g are higher magnification of images in f. Scale bar represents 100 μm (f) or 20 μm (g). h LATS-BS can be used to determine LATS activity in vivo. HEK293 were transfected with LATS-BS. Cells were injected into the mammary fat pad of immunocompromised mice. After 48 h, BLI was performed. Data are represented as mean ± SD
Fig. 3
Fig. 3
Kinase inhibitor screen using the LATS-BS. a Experimental design for kinase inhibitor screen. LATS-BS was transfected into HEK293A and cells were passed into a 384-well plate the next day. Forty-eight hours after transfection, cells were treated with a kinase inhibitor library (Tocriscreen Kinase Inhibitor Toolbox) with each drug administered at 10 μM for 4 h in duplicate. Biosensor activity was measured by luciferase assay. b Heat map summarizing the results of the kinase inhibitor screen. Red color denotes drug treatments that activated the LATS-BS, whereas green color indicates treatments that inhibited the LATS-BS. c, d Validation of the top candidate drugs activating (c) or inhibiting (d) the LATS-BS from the small-scale kinase inhibitor screen. LATS-BS or STBS-luciferase reporter (YAP/TAZ/TEAD reporter) were transfected into HEK293A. Forty-eight hours after transfection, cells were treated with each inhibitor for 4 h at 10 μM. Reporter activity was measured by luciferase assay (n = 3). Data are represented as mean ± SD
Fig. 4
Fig. 4
VEGFR is an upstream regulator of Hippo signaling. VEGFR inhibition activates LATS-BS a and suppresses YAP/TAZ transcriptional co-activation in HEK293A b. Cells were treated with each inhibitor for 4 h at 10 μM (n = 3). c VEGFR inhibition diminishes expression of YAP/TAZ targets, CYR61/CTGF. HEK293A were treated with inhibitors for 4 h at 10 μM. CYR61 or CTGF mRNA expression was determined by qRT-PCR (n = 3). d VEGFR reduces YAP-S127 phosphorylation in HEK293 (western blotting). e VEGF stimulation inhibits LATS-BS activity in MCF10A stably overexpressing VEGFR1/2. MCF10A-VEGFR1/2 were transfected with LATS-BS. Cells were treated with VEGF (100 ng ml−1) for the indicated times. For some samples, cells were pre-treated with axitinib at 10 μM for 3 h before VEGF treatment (n = 3). f, g VEGF increases YAP/TAZ transcriptional co-activation of CYR61 in MCF10A-VEGFR1/2 (f), as well as in BOEC and MDA-MB231 (g). Cells were treated with 100 ng ml−1 VEGF for the indicated times. CYR61 expression was measured by qRT-PCR. For some samples, cells were pre-treated with Axitinib at 10 μM for 3 h before VEGF treatment (n = 3). h-m VEGF stimulation increases YAP/TAZ nuclear localization in MCF10A-VEGFR2 (h, i), MDA-MB231 (j, k), and BOEC (l, m). h, j, l Representative images of YAP or TAZ immunostaining are shown after treatment with 100 ng ml−1 VEGF for the indicated times. Scale bar represents 15 μm. i, k, m YAP/TAZ subcellular localization was quantified in three separate experiments in which at least 200 cells were examined. n, o VEGFR2 signals through PI3K, AKT, and MEK to inhibit LATS-BS (n) and activate the STBS reporter (o). Cells were untreated or treated with VEGFR inhibitor (axitinib), PI3K inhibitor (LY294002), AKT inhibitor (triciribine), or MEK inhibitor (PD98059) at 10 μM for 4 h (n = 3). *p < 0.05 in two-sample unpaired t-test. p VEGF stimulates phosphorylation of VEGFR, AKT, and ERK in HUVEC cells, and reduces MST1 and LATS1 phosphorylation (western blotting). HUVEC cells were treated with 100 ng ml−1 VEGF for the indicated times. VEGFR was inhibited using 10 μM axitinib for 3 h before VEGF treatment. All data are represented as mean ± SD
Fig. 5
Fig. 5
VEGFR regulates angiogenesis and tumor VM through YAP/TAZ in vitro. a Transient knockdown of YAP and/or TAZ in MCF10A overexpressing VEGFR2 decreases expression of ANG-2 and CYR61. Western blotting exposures indicate relative expression of YAP and TAZ. b, c VEGFR2 overexpression and VEGF treatment increases tube formation by MCF10A through YAP/TAZ. YAP and/or TAZ were transiently knocked down by siRNA in MCF10A stably overexpressing VEGFR2 and subjected to tube-formation assay on Matrigel 48 h after transfection alongside wild type MCF10A. For some conditions, cells were stimulated with 100 ng ml−1 VEGF or were treated with 100 nM verteporfin for the duration of the tube formation assay. Representative images are shown in b. Scale bar denotes 200 μm. Total tube formation was quantified in c (n = 3). *p < 0.05 in two-sample unpaired t-test. dl YAP/TAZ are critical for VEGF-induced angiogenesis in HUVEC (df) and BOEC (gi), as well as for vasculogenic mimicry in MDA-MB231 (jl). d, g, j YAP and/or TAZ were transiently knocked down by siRNA in each cell line which reduced ANG-2 and CYR61 expression. Western blotting exposures indicate relative expression of YAP and TAZ for each cell line. e, h, k Representative images of tube formation on Matrigel assessed 48 h after transfection. For some conditions, cells were stimulated with 100 ng ml−1 VEGF or were treated with 100 nM verteporfin for the duration of the tube formation assay. Scale bar denotes 200 μm. Total tube formation was quantified in f, i, l (n = 3). *p < 0.05 in two-sample unpaired t-test. m, n Exogenous CYR61 and ANG-2 can partially rescue tube formation in YAP/TAZ knockdown HUVEC. YAP and/or TAZ were transiently knocked down by siRNA in HUVEC. Tube formation on Matrigel was assessed 48 h after transfection. For some conditions, cells were stimulated with 100 ng ml−1 VEGF, 200 ng ml−1 CYR61, and/or 200 ng ml−1ANG-2 for the duration of the tube formation assay. Scale bar denotes 200 μm. Representative images are shown in m and total tube formation was quantified in n. (n = 3). All data are represented as mean ± SD
Fig. 6
Fig. 6
YAP/TAZ are mediators of VEGF-induced angiogenesis ex vivo and in vivo. ac Pharmacological inhibition of YAP/TAZ reduces angiogenesis ex vivo in a rat aorta model. Sections of aorta were cultured for 7 days in Matrigel with 100 ng ml−1 VEGF and the indicated concentrations of VP. Representative images are shown in a. Sprout area is quantified in b. Scale bar denotes 500  μm. c Immunostaining of aorta sections demonstrates that outgrowths are positive for VE-cadherin. Scale bar denotes 300 μm. Wimasis image analysis software was used to visualize sprouts (n = 3). d Transient knockdown of YAP/TAZ or pharmacological inhibition of YAP/TAZ with VP reduces angiogenesis by HUVECs in vivo in Matrigel plug experiments. Five million cells were injected subcutaneously into mice with Matrigel and 200 ng mL−1 VEGF. VP was administered by intraperitoneal injection every other day. Plugs were excised after 1 week. Representative images are shown in the top two rows. In the bottom panels, angiogenesis in the Matrigel plugs was stained by IHC for the human endothelial cell marker hCD31. Scale bar denotes 500 μm. e YAP/TAZ inhibition reduces endogenous angiogenesis in vivo in Matrigel plug experiments. Matrigel plugs with 200 ng ml−1 VEGF were implanted subcutaneously in mice. VP was administered by intraperitoneal injection every other day. Plugs were excised after 2 weeks. Angiogenesis was assessed by IHC staining for mouse mCD31 endothelial cell marker. Scale bar denotes 500 μm. fh YAP/TAZ inhibition diminishes angiogenesis in vivo in a mouse retinal model. Mice were injected with 1 mg kg−1 VEGF with or without 100 mg kg−1 VP at postnatal day 3 (P3) and 4 (P4). At P5, retinal blood vasculature was stained. Representative images of the retinal vessel density are shown in f, whereas g shows images of the vascular front. Scale bar denotes 100 μm f or 30 μm g. Number of filopodia (active angiogenesis) is quantified in h. Each data point represents the average of two retinas from a single mouse (n = 4 for control, n = 3 for VP). *p < 0.05 in two-sample unpaired t-test. All data are represented as mean ± SD
Fig. 7
Fig. 7
Model for VEGFR and Hippo signaling in angiogenesis/VM. When VEGF binds to its receptor, VEGFR, signaling through PI3K and MAPK is initiated. This leads to the inhibition of MST/LATS and subsequent activation of YAP/TAZ. YAP and TAZ induce ANG-2 and CYR61 expression, leading to enhanced angiogenesis and vasculogenic mimicry in endothelial and tumor cell lines, respectively

References

    1. Justice RW, Zilian O, Woods DF, Noll M, Bryant PJ. The Drosophila tumor suppressor gene warts encodes a homolog of human myotonic dystrophy kinase and is required for the control of cell shape and proliferation. Genes Dev. 1995;9:534–546. doi: 10.1101/gad.9.5.534. - DOI - PubMed
    1. Xu T, Wang W, Zhang S, Stewart RA, Yu W. Identifying tumor suppressors in genetic mosaics: the Drosophila lats gene encodes a putative protein kinase. Development. 1995;121:1053–1063. - PubMed
    1. Zhao B, et al. Inactivation of YAP oncoprotein by the Hippo pathway is involved in cell contact inhibition and tissue growth control. Genes Dev. 2007;21:2747–2761. doi: 10.1101/gad.1602907. - DOI - PMC - PubMed
    1. Hao Y, Chun A, Cheung K, Rashidi B, Yang X. Tumor suppressor LATS1 is a negative regulator of oncogene YAP. J. Biol. Chem. 2008;283:5496–5509. doi: 10.1074/jbc.M709037200. - DOI - PubMed
    1. Wu S, Huang J, Dong J, Pan D. Hippo encodes a Ste-20 family protein kinase that restricts cell proliferation and promotes apoptosis in conjunction with salvador and warts. Cell. 2003;114:445–456. doi: 10.1016/S0092-8674(03)00549-X. - DOI - PubMed

Publication types

MeSH terms

Substances