. 2018 Mar 13;9(1):1048.
doi: 10.1038/s41467-018-03099-x.

Integrative genomic profiling of large-cell neuroendocrine carcinomas reveals distinct subtypes of high-grade neuroendocrine lung tumors

Julie George  1 Vonn Walter  2   3 Martin Peifer  4   5 Ludmil B Alexandrov  6 Danila Seidel  4 Frauke Leenders  4 Lukas Maas  4 Christian Müller  4 Ilona Dahmen  4 Tiffany M Delhomme  7 Maude Ardin  8 Noemie Leblay  7 Graham Byrnes  9 Ruping Sun  10 Aurélien De Reynies  11 Anne McLeer-Florin  12 Graziella Bosco  4 Florian Malchers  4 Roopika Menon  13 Janine Altmüller  5   14   15 Christian Becker  14 Peter Nürnberg  5   14   16 Viktor Achter  17 Ulrich Lang  17   18 Peter M Schneider  19 Magdalena Bogus  19 Matthew G Soloway  2 Matthew D Wilkerson  20 Yupeng Cun  4   5 James D McKay  7 Denis Moro-Sibilot  21 Christian G Brambilla  21 Sylvie Lantuejoul  22   23 Nicolas Lemaitre  22 Alex Soltermann  24 Walter Weder  25 Verena Tischler  24 Odd Terje Brustugun  26   27 Marius Lund-Iversen  28 Åslaug Helland  25   26 Steinar Solberg  29 Sascha Ansén  30 Gavin Wright  31 Benjamin Solomon  32 Luca Roz  33 Ugo Pastorino  34 Iver Petersen  35 Joachim H Clement  36 Jörg Sänger  37 Jürgen Wolf  30 Martin Vingron  10 Thomas Zander  38   39 Sven Perner  40 William D Travis  41 Stefan A Haas  10 Magali Olivier  8 Matthieu Foll  7 Reinhard Büttner  39 David Neil Hayes  2 Elisabeth Brambilla  42 Lynnette Fernandez-Cuesta  4   7 Roman K Thomas  43   44   45
Affiliations

Integrative genomic profiling of large-cell neuroendocrine carcinomas reveals distinct subtypes of high-grade neuroendocrine lung tumors

Julie George et al. Nat Commun. .

Abstract

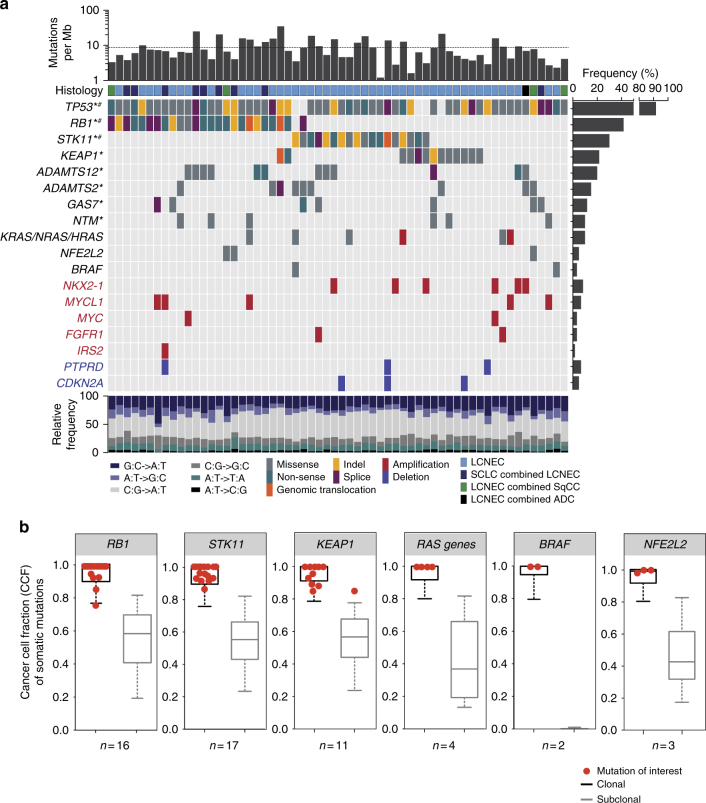
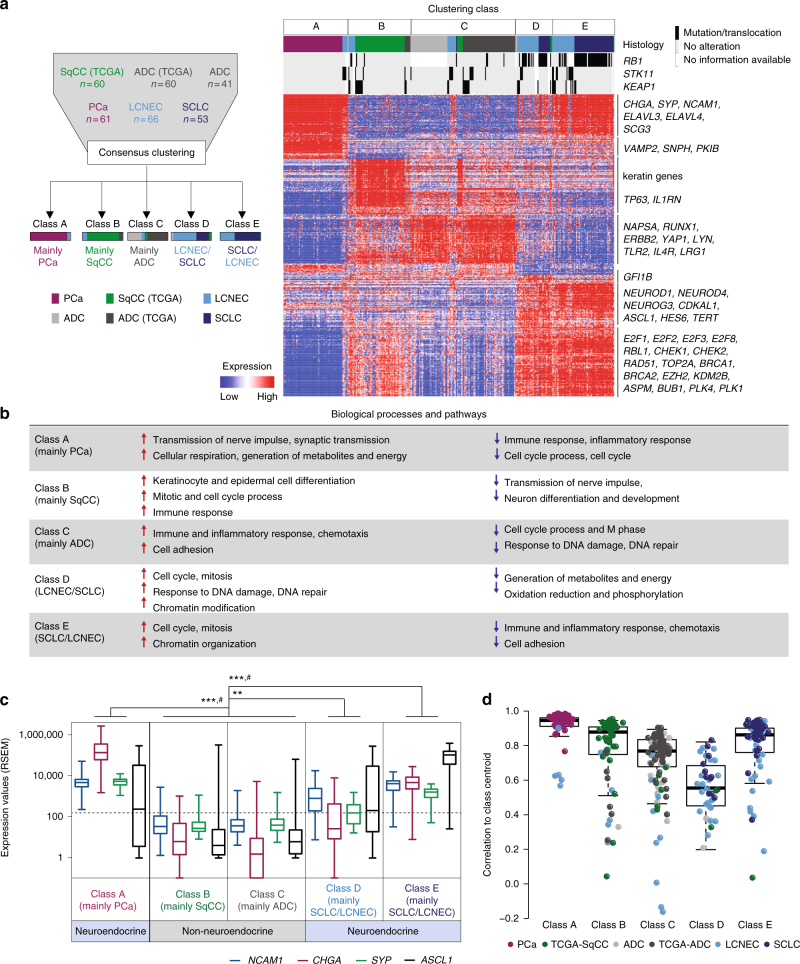
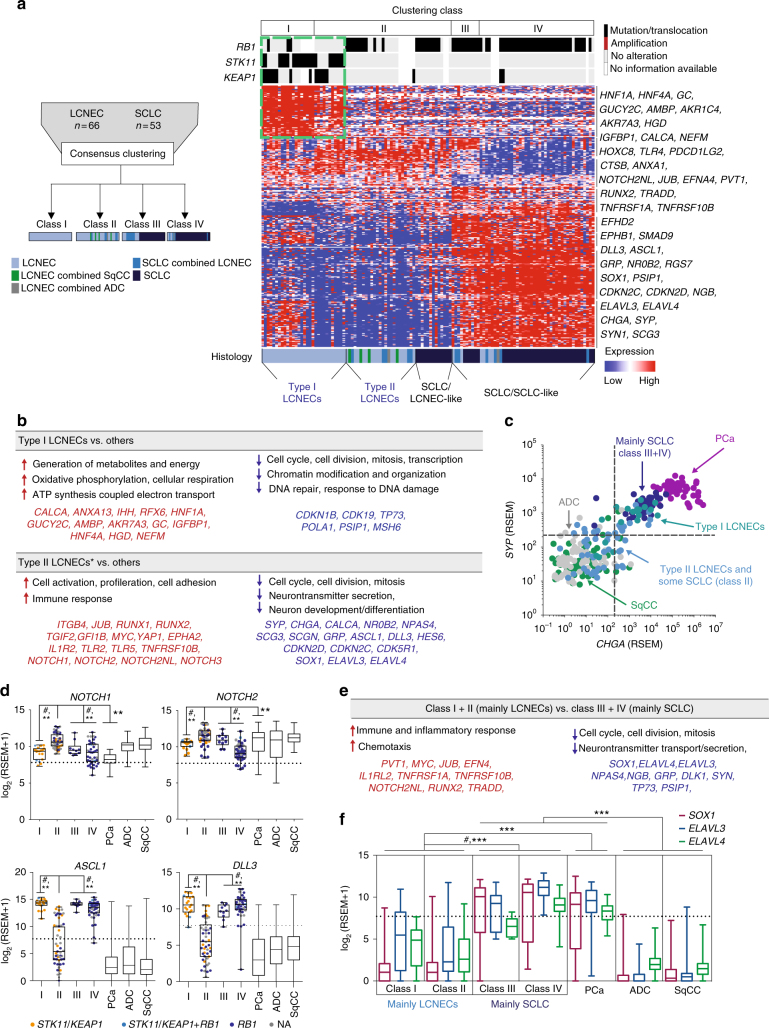
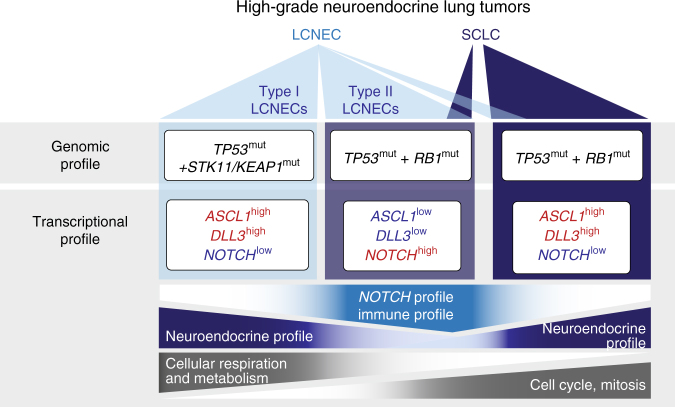
Pulmonary large-cell neuroendocrine carcinomas (LCNECs) have similarities with other lung cancers, but their precise relationship has remained unclear. Here we perform a comprehensive genomic (n = 60) and transcriptomic (n = 69) analysis of 75 LCNECs and identify two molecular subgroups: "type I LCNECs" with bi-allelic TP53 and STK11/KEAP1 alterations (37%), and "type II LCNECs" enriched for bi-allelic inactivation of TP53 and RB1 (42%). Despite sharing genomic alterations with adenocarcinomas and squamous cell carcinomas, no transcriptional relationship was found; instead LCNECs form distinct transcriptional subgroups with closest similarity to SCLC. While type I LCNECs and SCLCs exhibit a neuroendocrine profile with ASCL1high/DLL3high/NOTCHlow, type II LCNECs bear TP53 and RB1 alterations and differ from most SCLC tumors with reduced neuroendocrine markers, a pattern of ASCL1low/DLL3low/NOTCHhigh, and an upregulation of immune-related pathways. In conclusion, LCNECs comprise two molecularly defined subgroups, and distinguishing them from SCLC may allow stratified targeted treatment of high-grade neuroendocrine lung tumors.


Conflict of interest statement

L.F.-C. and R.K.T. are inventors on a patent application related to findings described in this manuscript. R.K.T. is a founder of NEO New Oncology GmbH, now part of Siemens Healthcare. R.K.T. received consulting and lecture fees (Merck, Roche, Lilly, Boehringer Ingelheim, AstraZeneca, Daiichi-Sankyo, MSD, NEO New Oncology, Puma, Clovis). R.B. is a cofounder and owner of Targos Molecular Diagnostics and received honoraria for consulting and lecturing from AstraZeneca, Boehringer Ingelheim, Merck, Roche, Novartis, Lilly, and Pfizer. J.W. received consulting and lecture fees from Roche, Novartis, Boehringer Ingelheim, AstraZeneca, Bayer, Lilly, Merck, Amgen and research support from Roche, Bayer, Novartis, Boehringer Ingelheim. T.Z. received honoraria from Roche, Novartis, Boehringer Ingelheim, Lilly, Merck, Amgen and research support from Novartis. B.S. received consulting fees from AstraZeneca, Roche-Genentech, Pfizer, Novartis, Merck, and Bristol Myers Squibb. The remaining authors declare no competing financial interest.

Figures

Fig. 1
Fig. 1
Genomic alterations in pulmonary large-cell neuroendocrine carcinomas (LCNECs). a Tumor samples are arranged from left to right. Histological assignments and somatic alterations in candidate genes are annotated for each sample according to the color panel below the image. The somatic mutation frequencies for each candidate gene are plotted on the right panel. Mutation rates and the type of base-pair substitutions are displayed in the top and bottom panel, respectively; a dashed black line indicates the average value. Significantly mutated genes and genes with a significant enrichment of damaging mutations are denoted with * and #, respectively (Q < 0.01, Methods section). Genes with significant copy number (CN) amplifications (CN > 4) and deletions (CN < 1) (Supplementary Fig. 2a, Supplementary Dataset 5) are displayed in red and blue, respectively (Q < 0.01, Methods section). b The distribution of clonal and sub-clonal mutations was analyzed for tumor samples that harbored mutations in key candidate genes. The cancer cell fractions (CCF) of all mutations were determined, assigned to clonal or sub-clonal fractions (Methods section), and displayed as whiskers box-plot (median and interquartile range, whiskers: 5–95 percentile). The CCF of candidate gene mutations is highlighted in red
Fig. 2
Fig. 2
Gene expression studies on lung cancer subtypes. a A schematic description of the unsupervised consensus clustering approach is provided on the left panel. The clustering results are displayed on the right panel as a heatmap, in which tumor samples are arranged in columns, grouped according to their expression clustering class, annotated for the histological subtype and for the somatic alteration status. Expression values of genes identified by ClaNC (Methods section) are represented as a heatmap; red and blue indicate high and low expression, respectively. Selected candidate genes are shown on the right. b Significant enrichment of differentially expressed genes in signaling pathways is displayed for all clustering classes (P < 0.0001, Methods section). c Expression values for key neuroendocrine differentiation markers are plotted for each clustering class as box-plots (median and interquartile range, whiskers: min–max values). Dashed black lines indicate the threshold for low expression (Methods section). Q < 0.05 (#), significance determined by SAM (Supplementary Dataset 12); P < 0.001 (***) Mann–Whitney U-test. d The correlation of each sample to the centroid of its clustering class was calculated and displayed as box-plot (median and interquartile range, whiskers 5–95 percentile)
Fig. 3
Fig. 3
Gene expression studies on LCNEC and SCLC. a The expression profiles of LCNEC and SCLC tumors were analyzed following the annotation and approach described in Fig. 2a. Expression values of genes identified by ClaNC (Methods section) are represented as a heatmap in which red and blue indicate high and low expression, respectively.  Selected candidate genes are shown on the right. Dashed green lines indicate an expression profile shared by LCNEC tumors with STK11/KEAP1 alterations (type I LCNECs). b The significant enrichment of differentially expressed genes and signaling pathways are displayed for type I LCNECs and type II LCNECs. P < 0.0001 (Methods section); * some SCLC tumors that co-clustered with type II LCNECs were included in this analysis. Key candidate genes are highlighted in bold. c, d Expression values for c the key neuroendocrine differentiation markers SYP (synaptophysin) and CHGA (chromogranin A) (scatter plot), and d NOTCH pathways genes (box plots: median and interquartile range, whiskers: min–max values). e Significant enrichment of differentially expressed genes and signaling pathways was analyzed for class I and II vs class III and IV tumor samples; P < 0.0001 (Methods section). f Expression values of SOX1, ELAVL3, and ELAVL4 are plotted for the clustering classes and other lung cancer subtypes (box plots: median and interquartile range, whiskers: min–max values). Q < 0.05 (#), SAM (Supplementary Dataset 12); P < 0.01 (**) Mann–Whitney U-test
Fig. 4
Fig. 4
Schematic overview of somatic alterations and expression profiles in high-grade neuroendocrine lung tumors. Significantly mutated genes are shown in black and differentially expressed genes are highlighted in red and blue, describing higher and lower expression, respectively. Upregulated expression profiles and signaling pathways are indicated by color gradients

Comment in

References

    1. Imielinski M, et al. Mapping the hallmarks of lung adenocarcinoma with massively parallel sequencing. Cell. 2012;150:1107–1120. doi: 10.1016/j.cell.2012.08.029. - DOI - PMC - PubMed
    1. Collisson Ea, et al. Comprehensive molecular profiling of lung adenocarcinoma. Nature. 2014;511:543–550. doi: 10.1038/nature13385. - DOI - PMC - PubMed
    1. Hammerman PS, et al. Comprehensive genomic characterization of squamous cell lung cancers. Nature. 2012;489:519–525. doi: 10.1038/nature11404. - DOI - PMC - PubMed
    1. Peifer M, et al. Integrative genome analyses identify key somatic driver mutations of small-cell lung cancer. Nat. Genet. 2012;44:1104–1110. doi: 10.1038/ng.2396. - DOI - PMC - PubMed
    1. Rudin CM, et al. Comprehensive genomic analysis identifies SOX2 as a frequently amplified gene in small-cell lung cancer. Nat. Genet. 2012;44:1111–1116. doi: 10.1038/ng.2405. - DOI - PMC - PubMed

Publication types

MeSH terms