

Hepatitis C virus core impacts expression of miR122 and miR204 involved in carcinogenic progression via regulation of TGFBRAP1 and HOTTIP expression
- PMID: 29535540
- PMCID: PMC5841326
- DOI: 10.2147/OTT.S149254
Hepatitis C virus core impacts expression of miR122 and miR204 involved in carcinogenic progression via regulation of TGFBRAP1 and HOTTIP expression
Abstract
Background: Despite the breadth of understanding the noncoding RNAs' function in molecular biology, their functional roles in hepatocellular carcinoma (HCC) is poorly understood. In this study, we investigated the effect of hepatitis C virus (HCV) core upon the expression of noncoding RNAs.
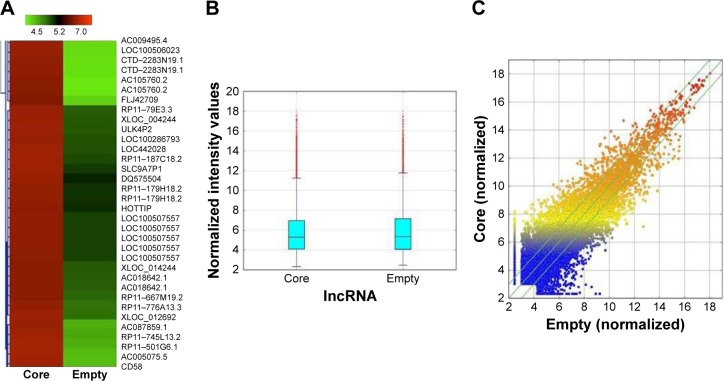
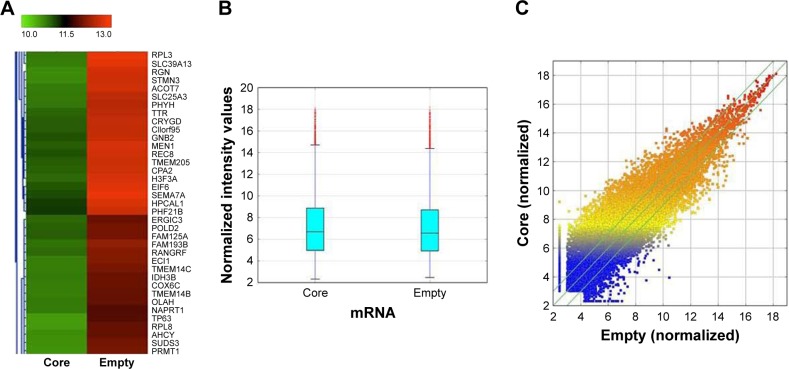
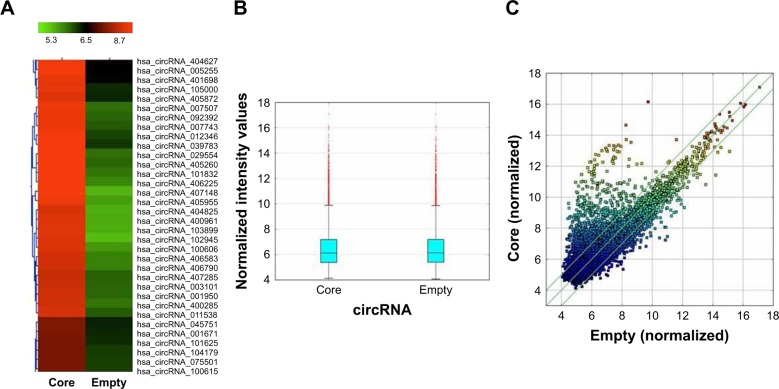
Methods: The lncRNAs, mRNAs, and circRNAs were employed for identification of HCV core protein gene expression in human Huh7 hepatoma (Huh7) cell line. In data analysis, we applied a threshold that eliminated all genes that were not increased or decreased by at least a 2-fold change in a comparison between transfected and control cells. Hierarchical Clustering and the Kyoto encyclopedia of genes and genome pathway analyses were performed to show the distinguishable lncRNA, mRNAs, and circRNAs expression pattern among samples.
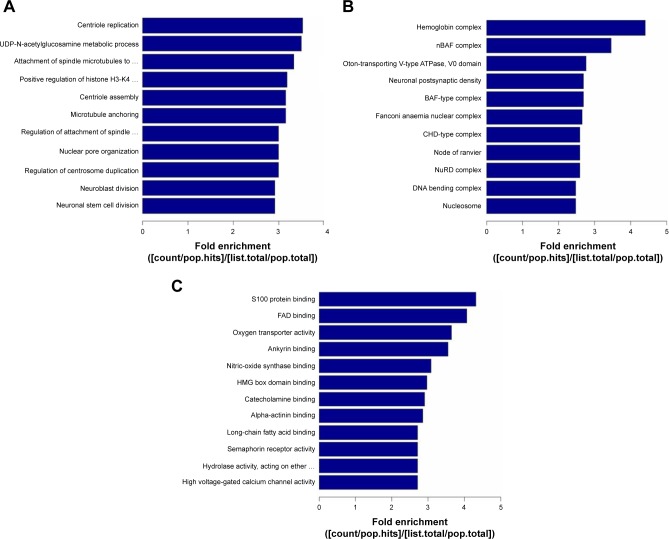
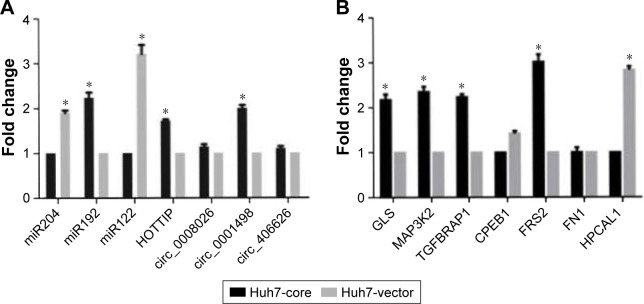
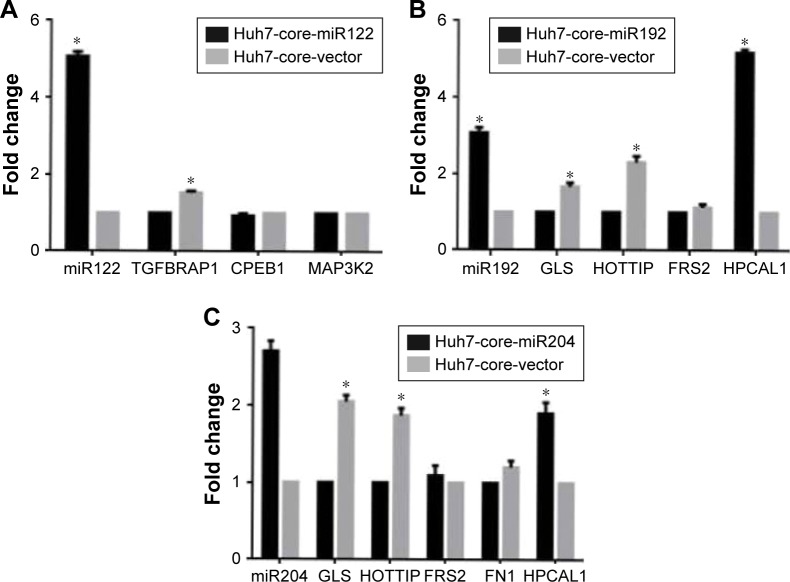
Results: The array data showed that 4,851 lncRNAs, 4,785 mRNAs, and 823 circRNAs were 2-fold up-regulated but 3,569 lncRNAs, 3,192 mRNAs, and 419 circRNAs were 2-fold down-regulated in Huh 7-core cells. The genes in the enriched set were associated with macromolecule and nucleic acid metabolic processes, DNA damage response and regulation of voltage-gated calcium channel. We identified 10 genes from the selected 14 genes that were higher or lower expression in Huh7-core cells than that of Huh7-vector cells by quantitative real-time polymerase chain reaction. Interestingly, overexpression of miR122 and miR204 partly abrogated the expression of TGFBRAP1 and HOTTIP, and increased the HPCAL1 expression in the predicted carcinogenic pathways.
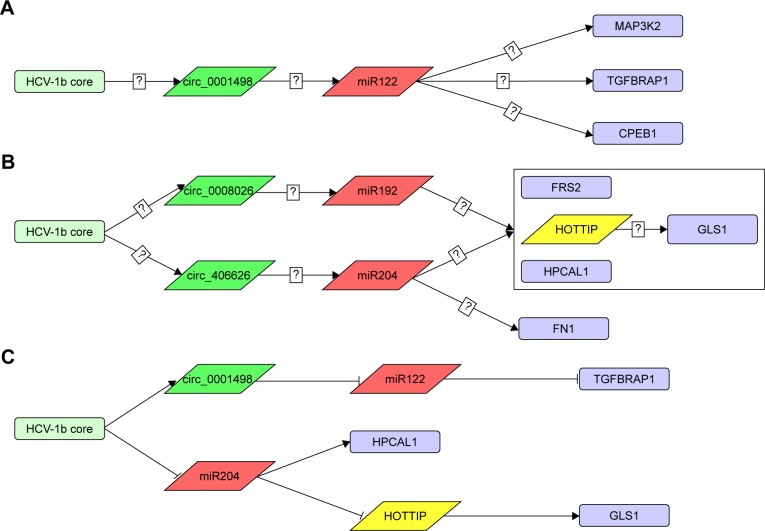
Conclusion: Our data suggests that the pathways of miR204-HPCAL1-lncRNAHOTTIP and miR122-TGFBRAP1 were likely involved in the carcinogenic progress due to the presence of HCV core, and that overexpression of miR122 and miR204 might inhibit the HCC progress by down-regulation of TGFBRAP1 and HOTTIP expression.
Keywords: Core; HOTTIP; gene expression; hepatitis C virus; hepatocellular carcinoma; lncRNA microarray; miR122.
Conflict of interest statement
Disclosure The authors report no conflicts of interest in this work.
Figures
Similar articles
-
Long non-coding RNA HOTTIP is frequently up-regulated in hepatocellular carcinoma and is targeted by tumour suppressive miR-125b.Liver Int. 2015 May;35(5):1597-606. doi: 10.1111/liv.12746. Epub 2015 Jan 27. Liver Int. 2015. PMID: 25424744
-
Changing expression profiles of lncRNAs, circRNAs and mRNAs in esophageal squamous carcinoma.Oncol Lett. 2019 Nov;18(5):5363-5373. doi: 10.3892/ol.2019.10880. Epub 2019 Sep 19. Oncol Lett. 2019. PMID: 31612046 Free PMC article.
-
Establishment of a novel permissive cell line for the propagation of hepatitis C virus by expression of microRNA miR122.J Virol. 2012 Feb;86(3):1382-93. doi: 10.1128/JVI.06242-11. Epub 2011 Nov 23. J Virol. 2012. PMID: 22114337 Free PMC article.
-
Long noncoding RNAs: Novel insights into hepatocelluar carcinoma.Cancer Lett. 2014 Mar 1;344(1):20-27. doi: 10.1016/j.canlet.2013.10.021. Epub 2013 Oct 30. Cancer Lett. 2014. PMID: 24183851 Review.
-
Roles of long noncoding RNAs in hepatocellular carcinoma.Virus Res. 2016 Sep 2;223:131-9. doi: 10.1016/j.virusres.2016.06.008. Epub 2016 Jun 29. Virus Res. 2016. PMID: 27374059 Review.
Cited by
-
LncRNAs in HCV Infection and HCV-Related Liver Disease.Int J Mol Sci. 2020 Mar 24;21(6):2255. doi: 10.3390/ijms21062255. Int J Mol Sci. 2020. PMID: 32214045 Free PMC article. Review.
-
Long non-coding RNAs and autophagy: dual drivers of Hepatocellular carcinoma progression.Cell Death Discov. 2025 Aug 11;11(1):376. doi: 10.1038/s41420-025-02667-7. Cell Death Discov. 2025. PMID: 40789840 Free PMC article. Review.
-
The Variant at TGFBRAP1 but Not TGFBR2 Is Associated with Antituberculosis Drug-Induced Liver Injury.Evid Based Complement Alternat Med. 2019 Aug 22;2019:1685128. doi: 10.1155/2019/1685128. eCollection 2019. Evid Based Complement Alternat Med. 2019. PMID: 31534460 Free PMC article.
-
Micro-Players of Great Significance-Host microRNA Signature in Viral Infections in Humans and Animals.Int J Mol Sci. 2022 Sep 11;23(18):10536. doi: 10.3390/ijms231810536. Int J Mol Sci. 2022. PMID: 36142450 Free PMC article. Review.
-
Abnormal expression of miRNA-122 in cerebral infarction and related mechanism of regulating vascular endothelial cell proliferation and apoptosis by targeting CCNG1.Clinics (Sao Paulo). 2023 Apr 27;78:100199. doi: 10.1016/j.clinsp.2023.100199. eCollection 2023. Clinics (Sao Paulo). 2023. PMID: 37119591 Free PMC article.
References
-
- Dou J, Liu P, Wang J, Zhang X. Effect of hepatitis C virus core shadow protein expressed in human hepatoma cell line on human gene expression profiles. J Gastroenterol Hepatol. 2006;21(12):1794–1800. - PubMed
-
- Dou J, Liu K, Chen Z, et al. Effect of immunization in mice with recombinant DNA encoding the hepatitis C virus structural protein. Chin Med J (Engl) 1999;112(11):1036–1039. - PubMed
-
- Gale M, Jr, Foy EM. Evasion of intracellular host defence by hepatitis C virus. Nature. 2005;436(7053):939–945. - PubMed
-
- Afzal MS, Alsaleh K, Farhat R, et al. Regulation of core expression during the hepatitis C virus life cycle. J Gen Virol. 2015;96(Pt 2):311–321. - PubMed
LinkOut - more resources
Full Text Sources
Other Literature Sources
