Functional Analysis and Immunochemical Analyses of Ca2+ Homeostasis-Related Proteins Expression of Glaucoma-Induced Retinal Degeneration in Rats
- PMID: 29535566
- PMCID: PMC5840458
- DOI: 10.5607/en.2018.27.1.16
Functional Analysis and Immunochemical Analyses of Ca2+ Homeostasis-Related Proteins Expression of Glaucoma-Induced Retinal Degeneration in Rats
Abstract
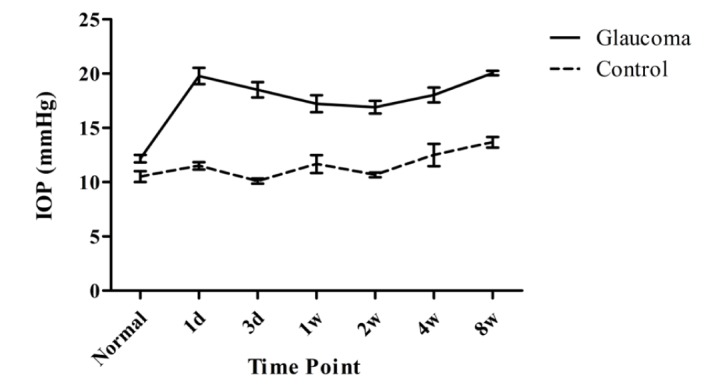
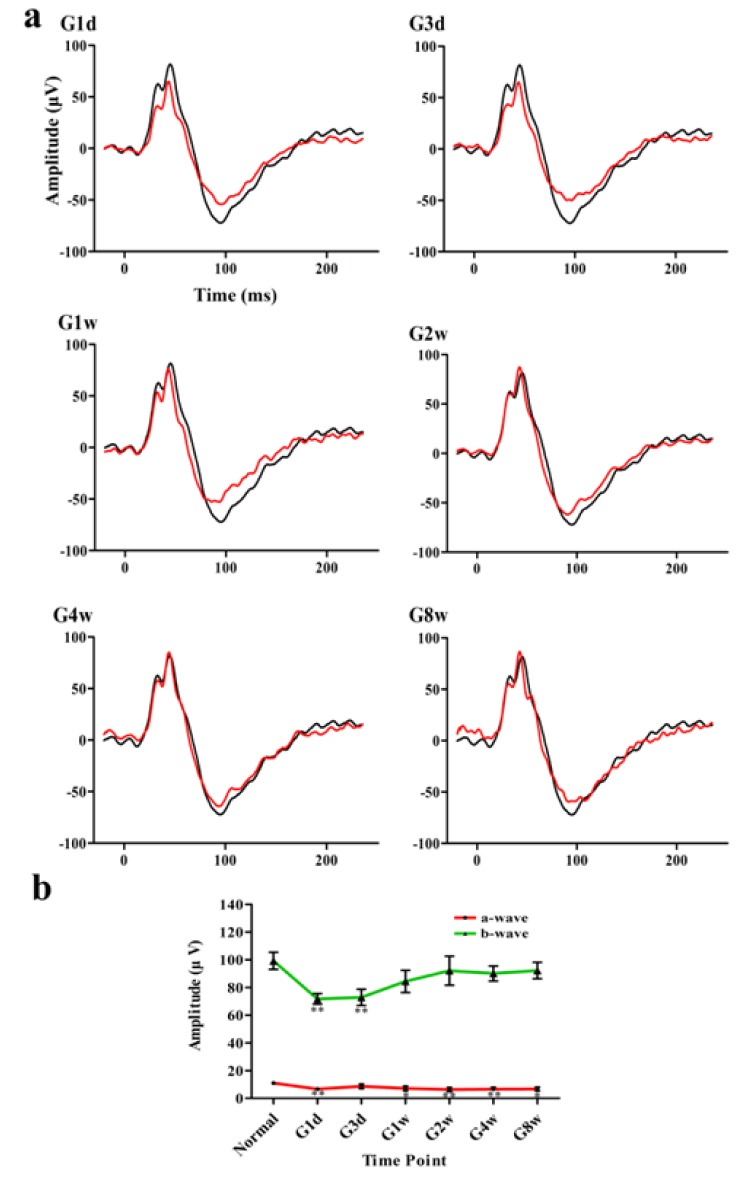
The retinal degeneration resulting from elevated intraocular pressure was evaluated through functional and morphological analyses, for better understanding of the pathophysiology of glaucoma. Ocular hypertension was induced via unilateral episcleral venous cauterization in rats. Experimental time was set at 1 and 3 days, and 1, 2, 4, and 8 weeks post-operation. Retinal function was analyzed using electroretinography. For morphological analysis, retinal tissues were processed for immunochemistry by using antibodies against the calcium-sensing receptor and calcium-binding proteins. Apoptosis was analyzed using the TUNEL method and electron microscopy. Amplitudes of a- and b-wave in scotopic and photopic responses were found to be reduced in all glaucomatous retinas. Photopic negative response for ganglion cell function significantly reduced from 1-day and more significantly reduced in 2-week glaucoma. Calcium-sensing receptor immunoreactivity in ganglion cells remarkably reduced at 8 weeks; conversely, protein amounts increased significantly. Calcium-binding proteins immunoreactivity in amacrine cells clearly reduced at 8 weeks, despite of uneven changes in protein amounts. Apoptosis appeared in both photoreceptors and ganglion cells in 8-week glaucomatous retina. Apoptotic feature of photoreceptors was typical, whereas that of ganglion cells was necrotic in nature. These findings suggest that elevated intraocular pressure affects the sensitivity of photoreceptors and retinal ganglion cells, and leads to apoptotic death. The calcium-sensing receptor may be a useful detector for alteration of extracellular calcium levels surrounding the ganglion cells.
Keywords: Ca2+-sensing receptor; apoptosis; electroretinography; glaucoma; rats; retinal ganglion cell.
Figures


Similar articles
-
The elevation of intraocular pressure is associated with apoptosis and increased immunoreactivity for nitric oxide synthase in rat retina whereas the effectiveness of retina derived relaxing factor is unaffected.Exp Eye Res. 2016 Apr;145:401-411. doi: 10.1016/j.exer.2016.03.002. Epub 2016 Mar 4. Exp Eye Res. 2016. PMID: 26948455
-
Selective ganglion cell functional loss in rats with experimental glaucoma.Invest Ophthalmol Vis Sci. 2004 Jun;45(6):1854-62. doi: 10.1167/iovs.03-1411. Invest Ophthalmol Vis Sci. 2004. PMID: 15161850
-
Comparative analysis of retinal ganglion cell damage in three glaucomatous rat models.Exp Eye Res. 2018 Jul;172:112-122. doi: 10.1016/j.exer.2018.03.019. Epub 2018 Mar 30. Exp Eye Res. 2018. PMID: 29605491
-
Understanding glaucomatous damage: anatomical and functional data from ocular hypertensive rodent retinas.Prog Retin Eye Res. 2012 Jan;31(1):1-27. doi: 10.1016/j.preteyeres.2011.08.001. Epub 2011 Sep 21. Prog Retin Eye Res. 2012. PMID: 21946033 Review.
-
[New insights into the pathogenesis of glaucomatous optic neuropathy and refinement of the objective assessment of its functional damage].Nippon Ganka Gakkai Zasshi. 2012 Mar;116(3):298-344; discussion 345-6. Nippon Ganka Gakkai Zasshi. 2012. PMID: 22568105 Review. Japanese.
Cited by
-
Retinal cytotoxicity of silica and titanium dioxide nanoparticles.Toxicol Res (Camb). 2021 Dec 24;11(1):88-100. doi: 10.1093/toxres/tfab117. eCollection 2022 Feb. Toxicol Res (Camb). 2021. PMID: 35237414 Free PMC article.
-
A Dietary Combination of Forskolin with Homotaurine, Spearmint and B Vitamins Protects Injured Retinal Ganglion Cells in a Rodent Model of Hypertensive Glaucoma.Nutrients. 2020 Apr 23;12(4):1189. doi: 10.3390/nu12041189. Nutrients. 2020. PMID: 32340314 Free PMC article.
-
Modulation of Dopaminergic Neuronal Excitability by Zinc through the Regulation of Calcium-related Channels.Exp Neurobiol. 2019 Oct 31;28(5):578-592. doi: 10.5607/en.2019.28.5.578. Exp Neurobiol. 2019. PMID: 31698550 Free PMC article.
-
Effects of Acute High-Altitude Exposure on Morphology and Function of Retinal Ganglion Cell in Mice.Invest Ophthalmol Vis Sci. 2024 Aug 1;65(10):19. doi: 10.1167/iovs.65.10.19. Invest Ophthalmol Vis Sci. 2024. PMID: 39133471 Free PMC article.
References
-
- Gupta N, Weinreb RN. New definitions of glaucoma. Curr Opin Ophthalmol. 1997;8:38–41. - PubMed
-
- Weinreb RN, Khaw PT. Primary open-angle glaucoma. Lancet. 2004;363:1711–1720. - PubMed
-
- Quigley HA, Hohman RM. Laser energy levels for trabecular meshwork damage in the primate eye. Invest Ophthalmol Vis Sci. 1983;24:1305–1307. - PubMed
-
- Yamamoto T, Kitazawa Y. Vascular pathogenesis of normal-tension glaucoma: a possible pathogenetic factor, other than intraocular pressure, of glaucomatous optic neuropathy. Prog Retin Eye Res. 1998;17:127–143. - PubMed
LinkOut - more resources
Full Text Sources
Other Literature Sources
Miscellaneous