. 2018 Feb 26:9:142.
doi: 10.3389/fphar.2018.00142. eCollection 2018.

Downregulation of TLR4 by miR-181a Provides Negative Feedback Regulation to Lipopolysaccharide-Induced Inflammation

Affiliations

Downregulation of TLR4 by miR-181a Provides Negative Feedback Regulation to Lipopolysaccharide-Induced Inflammation

Kangfeng Jiang et al. Front Pharmacol. .

Abstract

Acute lung injury (ALI) is a progressive clinical disease with a high mortality rate, and characterized by an excessive uncontrolled inflammatory response. MicroRNAs (miRNAs) play a critical role in various human inflammatory diseases, and have been recognized as important regulators of inflammation. However, the regulatory mechanisms mediated by miRNAs involved in Lipopolysaccharide (LPS)-induced inflammation in ALI remain hazy. In this study, we found that miR-181a expression in the lung tissues of ALI mice and LPS-stimulated RAW 264.7 macrophages is dramatically reduced. We also show that over-expression of miR-181a significantly decreased the production of inflammatory cytokines, such as IL-1β, IL-6, and TNF-α, whereas inhibition of miR-181a reversed this decrease. Moreover, miR-181a inhibits NF-κB activation and accumulation of reactive oxygen species (ROS) by targeting TLR4 expression. We further verify that miR-181a suppresses TLR4 expression by binding directly to the 3'-UTR of TLR4. Therefore, we provide the first evidence for the negative regulation of miR-181a in LPS-induced inflammation via the suppression of ROS generation and TLR4-NF-κB pathway.

Keywords: LPS; NF-κB; ROS; acute lung injury; miR-181a.


Figures

FIGURE 1
FIGURE 1
miR-181a is down-regulated in the lung tissues of LPS-induced ALI mice. (A) Histopathological analysis of lung tissues. Mice were intratracheally administered with LPS for 24 h, and the degree of inflammation of lung samples was assessed with H&E staining (n = 3). (B) Lung W/D ratio (n = 3). (C,D) Infiltration of neutrophils into the lung tissues was measured by myeloperoxidase (MPO) immunofluorescence staining and MPO activity (n = 3). (E) The levels of cytokines IL-1β, IL-6, and TNF-α was detected by ELISA (n = 3). (F) The miR-181a expression was detected in the lung tissues of LPS treated mice by qPCR (n = 6). U6 snRNA was used as an endogenous control. Data are expressed as mean ± SEM of three independent experiments. P < 0.05; ∗∗P < 0.01 (Student’s t-test).
FIGURE 2
FIGURE 2
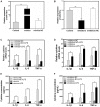
miR-181a is down-regulated in LPS-stimulated RAW264.7 macrophages. (A) Macrophages were stimulated with different concentrations of LPS for 12 h. (B) Macrophages were stimulated with 2 μg/mL LPS at different times as indicated. Cells were harvested, and miR-181a expression was measured by qPCR. The relative expression of miR-181a was normalized to U6 snRNA. (C) The viability of macrophages after treatment with LPS (2 μg/mL) was assessed using a CCK-8 assay kit. Data are expressed as mean ± SEM of three independent experiments. P < 0.05; ∗∗P < 0.01 (Student’s t-test).
FIGURE 3
FIGURE 3
miR-181a decreases the LPS-induced production of pro-inflammatory cytokines. (A,B) Macrophages were transfected with miR-181a mimics or inhibitors. At 24 h post-transfection, miR-181a levels were measured by qPCR. The relative expression of miR-181a was normalized to U6 snRNA. (C,D) Cells were transfected with 50 nM miR-181a mimics or 100 nM miR-181a inhibitors for 24 h, and then stimulated with 2 μg/mL LPS for 12 h. The expression of cytokines IL-1β, IL-6, and TNF-α was determined by qPCR. GAPDH was used as an endogenous control. (E,F) The levels of cytokines IL-1β, IL-6, and TNF-α was detected by ELISA. Data are expressed as mean ± SEM of three independent experiments. P < 0.05; ∗∗P < 0.01 (Student’s t-test).
FIGURE 4
FIGURE 4
miR-181a suppressed LPS-induced activation of NF-κB pathway. (A) Macrophages were transfected with miR-181a mimics or mimics NC for 24 h, then stimulated with 2 μg/mL LPS for 12 h. (B) The protein levels of NF-κB p65 and IκBα were measured by western blotting. β-actin was used as an internal control. (C) The NF-κB luciferase activity was measured by dual-luciferase assay. (D) Translocation of the p65 subunit from the cytoplasm into the nucleus was assessed by immunofluorescence staining (×400), scale bar = 50 μm. Blue spots represent cell nuclei, and green spots indicate p-p65 staining. (E) The IOD and area of cells were measured by IPP 6.0 software, and the fluorescence intensity of p-p65 was expressed as IOD/area. (F) Cells were treated as (A), and the protein levels of upstream molecules of NF-κB pathway were measured by western blotting. (B,G) Gray values of the indicated proteins were measured by Image-Pro Plus (IPP) 6.0 software. Data are expressed as mean ± SEM of three independent experiments. P < 0.05; ∗∗P < 0.01 (Student’s t-test).
FIGURE 5
FIGURE 5
TLR4 is a molecular target of miR-181a. (A) Macrophages were transfected with miR-181a mimics or mimics NC for 48 h, and the protein level of TLR4 was measured by western blotting. β-actin was used as an internal control. (B) Gray values of TLR4 protein were measured by IPP software. (C) Cells were treated as (A), the mRNA level of TLR4 was detected by qPCR. GAPDH was used as an internal control. (D) Immunofluorescence staining was performed to identify the expression of TLR4 (×400), scale bar = 50 μm. Blue spots represent cell nuclei, and red spots indicate TLR4 staining. (E) The fluorescence intensity of TLR4. (F) The alignment of miR-181a and TLR4 3′-UTR by computational prediction via the TargetScan and miRanda. (G) The dual-luciferase reporter assay was performed in 293T cells. Cells were co-transfected with the wild- or mutant-type TLR4 3′-UTR luciferase reporter vectors, as well as miR-181a mimics or mimics NC. The ratio of Renilla activity/Firefly activity represents luciferase activity. Data are expressed as mean ± SEM of three independent experiments. P < 0.05; ∗∗P < 0.01 (Student’s t-test).
FIGURE 6
FIGURE 6
Knockdown of TLR4 alleviates LPS-induced inflammatory responses. (A) Macrophages were transfected with the siRNA specific for TLR4 (si-TLR4) or the negative control siRNA (si-NC) at a concentration of 200 nM for 24 or 48 h, and the mRNA level of TLR4 was measured by qPCR. GAPDH was used as an internal control. (B) The protein level of TLR4 was determined by western blotting. β-actin was used as an internal control. (D) Cells were transfected with 200 nM si-TLR4 or si-NC for 24 h, and then stimulated with 2 μg/mL LPS for 12 h. The levels of cytokines IL-1β, IL-6, and TNF-α were detected by ELISA. (E) The protein levels of NF-κB p65 and IκBα were measured by western blotting. β-actin was used as an internal control. (G) Translocation of the p65 subunit from the cytoplasm into the nucleus was assessed by immunofluorescence staining (×400), scale bar = 50 μm. Blue spots represent cell nuclei, and green spots indicate p-p65 staining. (H) The fluorescence intensity of p-p65. (C,F) Gray values of the indicated proteins were measured by IPP 6.0 software. Data are expressed as mean ± SEM of three independent experiments. P < 0.05; ∗∗P < 0.01 (Student’s t-test).
FIGURE 7
FIGURE 7
miR-181a reduces LPS-induced intracellular ROS accumulation in macrophages. Macrophages were transfected with miR-181a mimics or si-TLR4 or the respective controls for 24 h, then incubated with 10 μM DCFH-DA for 30 min followed by stimulation with 2 μg/mL LPS for an additional 30 min. (A) Qualitative characterization of ROS were viewed using an inverted fluorescence microscope. (B) The IOD and area of cells were measured by IPP 6.0 software, and the ROS fluorescence intensity was expressed as IOD/area. (C) The ROS levels of cells were detected using flow cytometry. (D) The relative fluorescence intensity was analyzed by FlowJo software. Data are expressed as mean ± SEM of three independent experiments. P < 0.05; ∗∗P < 0.01 (Student’s t-test).
FIGURE 8
FIGURE 8
Schematic diagram of signaling pathways related to anti-inflammatory effects of miR-181a on LPS-induced inflammation.

Similar articles

Cited by

References

    1. Akira S., Hemmi H. (2003). Recognition of pathogen-associated molecular patterns by TLR family. Immunol. Lett. 85 85–95. 10.1016/S0165-2478(02)00228-6 - DOI - PubMed
    1. Biswas S. K., Lopez-Collazo E. (2009). Endotoxin tolerance: new mechanisms, molecules and clinical significance. Trends Immunol. 30 475–487. 10.1016/j.it.2009.07.009 - DOI - PubMed
    1. Cai Z. G., Zhang S. M., Zhang Y., Zhou Y. Y., Wu H. B., Xu X. P. (2012). MicroRNAs are dynamically regulated and play an important role in LPS-induced lung injury. Can. J. Physiol. Pharmacol. 90 37–43. 10.1139/y11-095 - DOI - PubMed
    1. Case S. R., Martin R. J., Jiang D., Minor M. N., Chu H. W. (2011). MicroRNA-21 inhibits toll-like receptor 2 agonist-induced lung inflammation in mice. Exp. Lung Res. 37 500–508. 10.3109/01902148.2011.596895 - DOI - PubMed
    1. Chen K., Rajewsky N. (2007). The evolution of gene regulation by transcription factors and microRNAs. Nat. Rev. Genet. 8 93–103. 10.1038/nrg1990 - DOI - PubMed

LinkOut - more resources