

Multifunctional Roles of the Ventral Stream in Language Models: Advanced Segmental Quantification in Post-Stroke Aphasic Patients
- PMID: 29535675
- PMCID: PMC5835331
- DOI: 10.3389/fneur.2018.00089
Multifunctional Roles of the Ventral Stream in Language Models: Advanced Segmental Quantification in Post-Stroke Aphasic Patients
Abstract
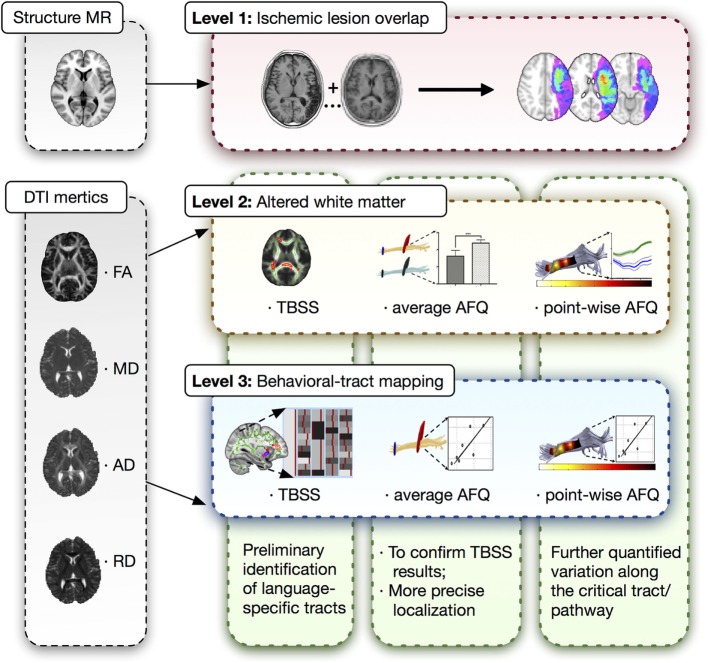
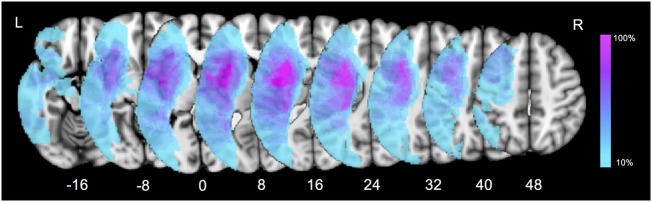
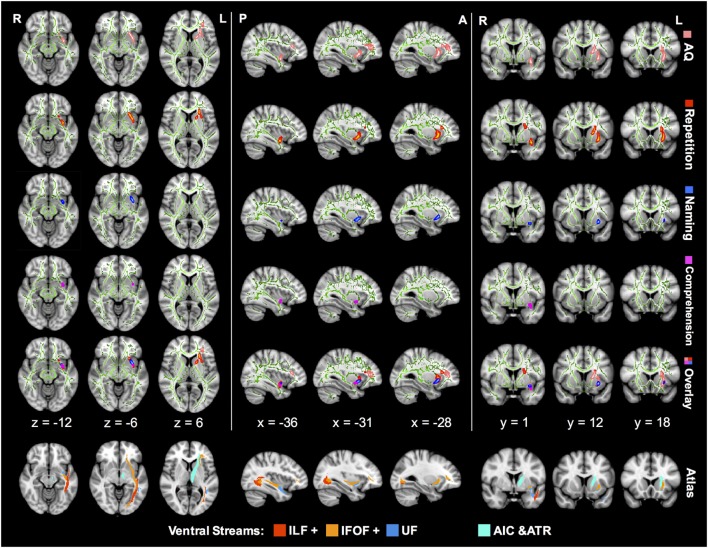
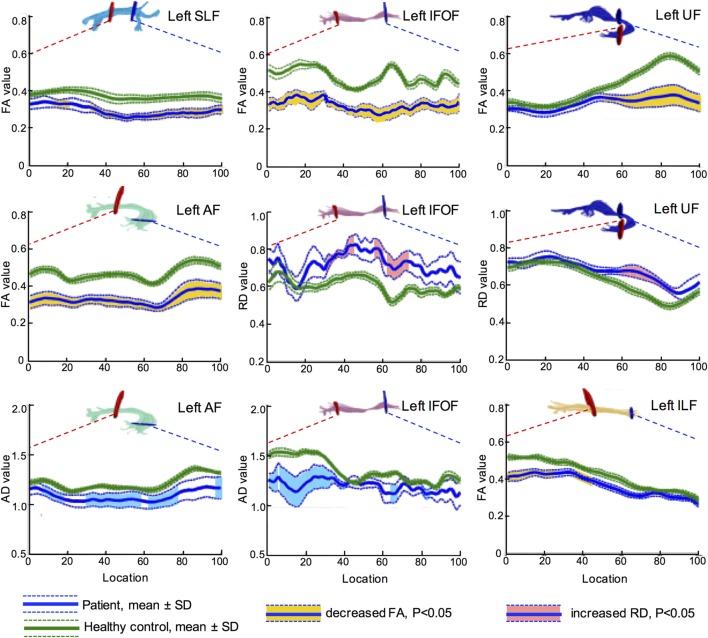
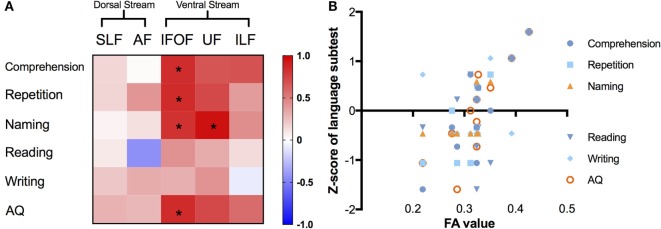
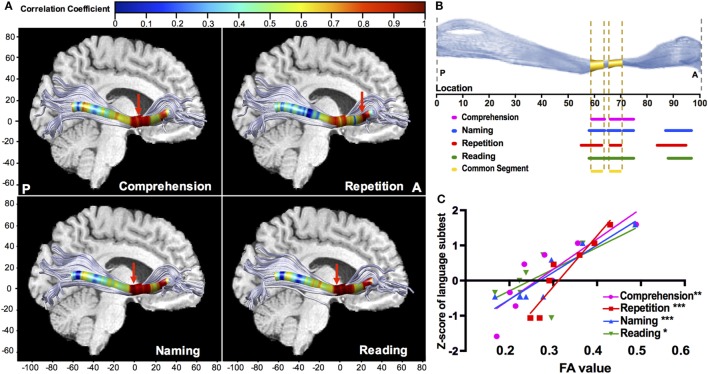
In the dual-route language model, the dorsal pathway is known for sound-to-motor mapping, but the role of the ventral stream is controversial. With the goal of enhancing our understanding of language models, this study investigated the diffusion characteristics of candidate tracts in aphasic patients. We evaluated 14 subacute aphasic patients post-stroke and 11 healthy controls with language assessment and diffusion magnetic resonance imaging. Voxel-based lesion-symptom mapping found multiple linguistic associations for the ventral stream, while automated fiber quantification (AFQ) showed, via reduced fractional anisotropy (FA) and axial diffusivity with increased radial diffusivity (all corrected p < 0.05), that the integrity of both the left dorsal and ventral streams was compromised. The average diffusion metrics of each fascicle provided by AFQ also confirmed that voxels with significant FA-language correlations were located in the ventral tracts, including the left inferior fronto-occipital fascicle (IFOF) (comprehension: r = 0.839, p = 0.001; repetition: r = 0.845, p = 0.001; naming: r = 0.813, p = 0.002; aphasia quotient: r = 0.847, p = 0.001) and uncinate fascicle (naming: r = 0.948, p = 0.001). Furthermore, point-wise AFQ revealed that the segment of the left IFOF with the strongest correlations was its narrow stem. The temporal segment of the left inferior longitudinal fascicle was also found to correlate significantly with comprehension (r = 0.663, p = 0.03) and repetition (r = 0.742, p = 0.009). This preliminary study suggests that white matter integrity analysis of the ventral stream may have the potential to reveal aphasic severity and guide individualized rehabilitation. The left IFOF, specifically its narrow stem segment, associates with multiple aspects of language, indicating an important role in semantic processing and multimodal linguistic functions.
Keywords: aphasia; diffusion tensor imaging; language model; stroke; ventral pathway.
Figures
Similar articles
-
Fixel-based evidence of microstructural damage in crossing pathways improves language mapping in Post-stroke aphasia.Neuroimage Clin. 2021;31:102774. doi: 10.1016/j.nicl.2021.102774. Epub 2021 Jul 25. Neuroimage Clin. 2021. PMID: 34371239 Free PMC article.
-
Beyond the Arcuate Fasciculus: Damage to Ventral and Dorsal Language Pathways in Aphasia.Brain Topogr. 2017 Mar;30(2):249-256. doi: 10.1007/s10548-016-0503-5. Epub 2016 Jun 20. Brain Topogr. 2017. PMID: 27324257
-
Anatomical integrity within the inferior fronto-occipital fasciculus and semantic processing deficits in schizophrenia spectrum disorders.Schizophr Res. 2020 Apr;218:267-275. doi: 10.1016/j.schres.2019.12.025. Epub 2020 Jan 13. Schizophr Res. 2020. PMID: 31948896
-
Contemporary model of language organization: an overview for neurosurgeons.J Neurosurg. 2015 Feb;122(2):250-61. doi: 10.3171/2014.10.JNS132647. Epub 2014 Nov 28. J Neurosurg. 2015. PMID: 25423277 Review.
-
Disruption of structural connectivity along the dorsal and ventral language pathways in patients with nonfluent and semantic variant primary progressive aphasia: a DT MRI study and a literature review.Brain Lang. 2013 Nov;127(2):157-66. doi: 10.1016/j.bandl.2013.06.003. Epub 2013 Jul 26. Brain Lang. 2013. PMID: 23890877 Review.
Cited by
-
A normative modeling approach to quantify white matter changes and predict functional outcomes in stroke patients.Front Neurosci. 2024 Feb 5;18:1334508. doi: 10.3389/fnins.2024.1334508. eCollection 2024. Front Neurosci. 2024. PMID: 38379757 Free PMC article.
-
Investigating Gray and White Matter Structural Substrates of Sex Differences in the Narrative Abilities of Healthy Adults.Front Neurosci. 2020 Jan 29;13:1424. doi: 10.3389/fnins.2019.01424. eCollection 2019. Front Neurosci. 2020. PMID: 32063823 Free PMC article.
-
Predicting Early Post-stroke Aphasia Outcome From Initial Aphasia Severity.Front Neurol. 2020 Feb 21;11:120. doi: 10.3389/fneur.2020.00120. eCollection 2020. Front Neurol. 2020. PMID: 32153496 Free PMC article.
-
Neuroplasticity and functional reorganization of language in patients with arteriovenous malformations: insights from neuroimaging and clinical interventions.Front Hum Neurosci. 2025 Jan 31;19:1503864. doi: 10.3389/fnhum.2025.1503864. eCollection 2025. Front Hum Neurosci. 2025. PMID: 39958956 Free PMC article. Review.
-
Evidence of motor injury due to damaged corticospinal tract following acute hemorrhage in the basal ganglia region.Sci Rep. 2020 Oct 1;10(1):16346. doi: 10.1038/s41598-020-73305-8. Sci Rep. 2020. PMID: 33004960 Free PMC article.
References
LinkOut - more resources
Full Text Sources
Other Literature Sources