

Beyond Chloride Brines: Variable Metabolomic Responses in the Anaerobic Organism Yersinia intermedia MASE-LG-1 to NaCl and MgSO4 at Identical Water Activity
- PMID: 29535699
- PMCID: PMC5835128
- DOI: 10.3389/fmicb.2018.00335
Beyond Chloride Brines: Variable Metabolomic Responses in the Anaerobic Organism Yersinia intermedia MASE-LG-1 to NaCl and MgSO4 at Identical Water Activity
Abstract
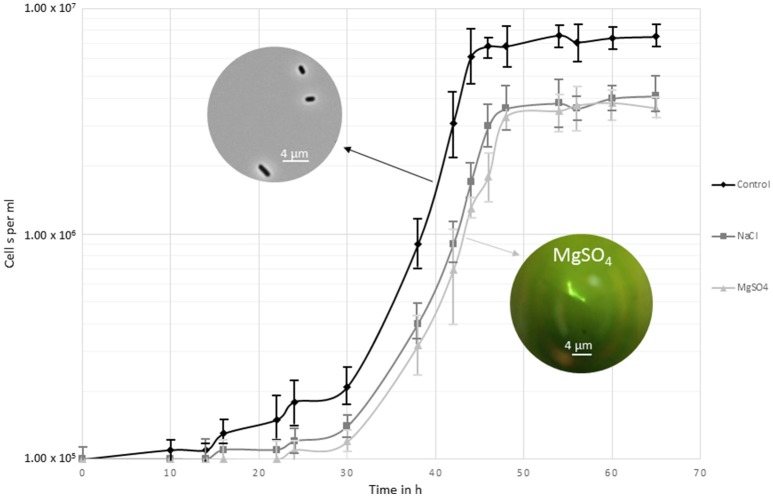
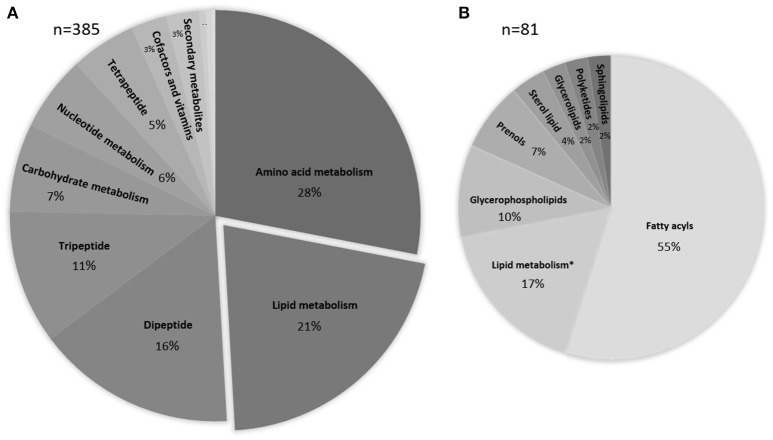
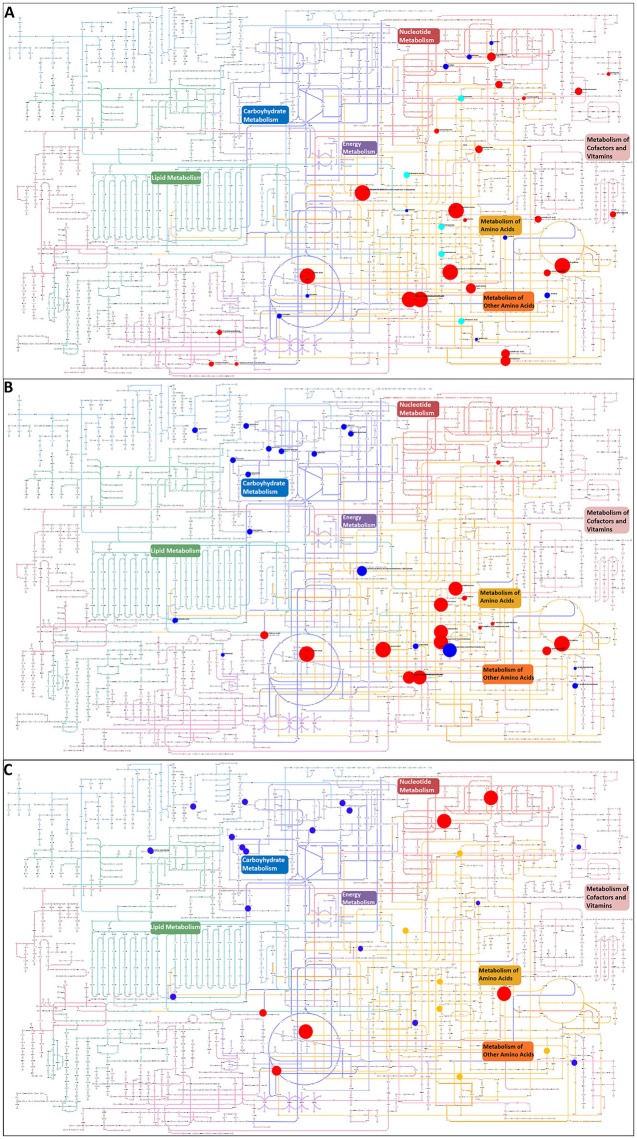
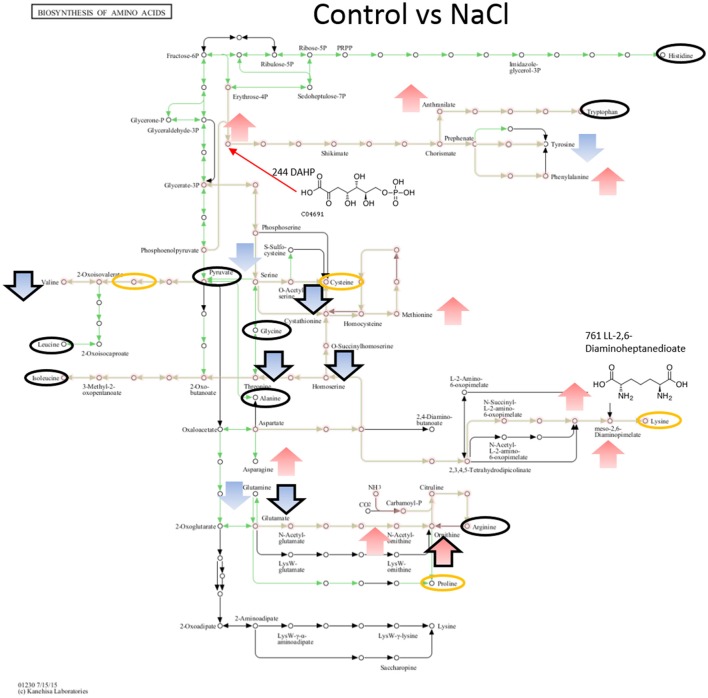
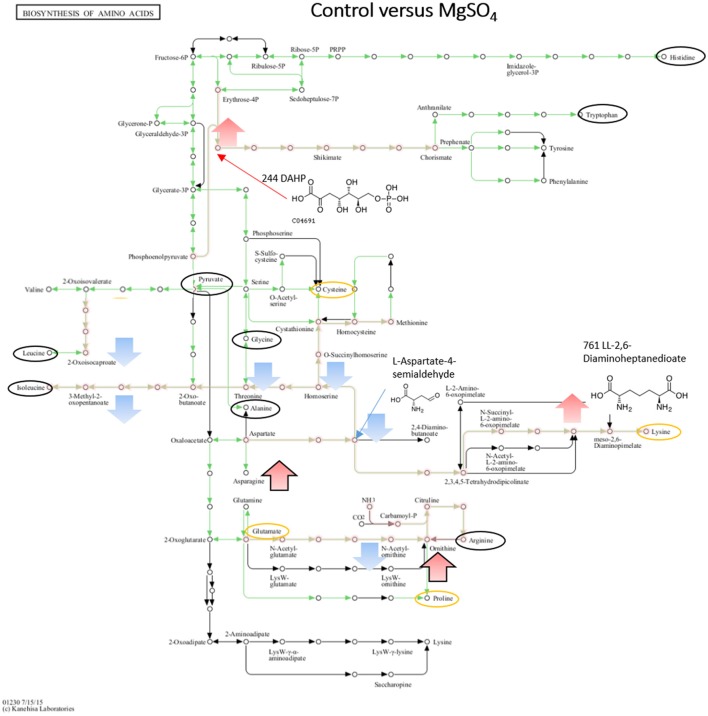
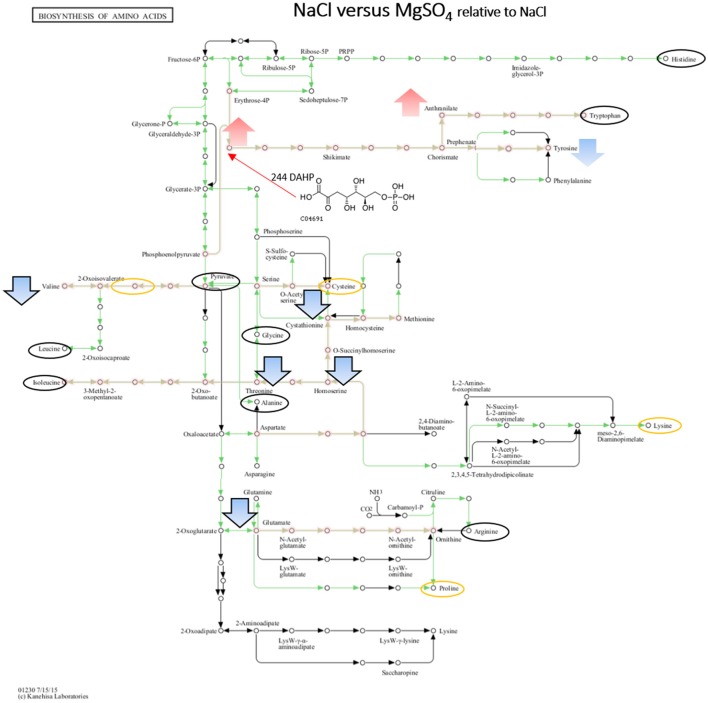
Growth in sodium chloride (NaCl) is known to induce stress in non-halophilic microorganisms leading to effects on the microbial metabolism and cell structure. Microorganisms have evolved a number of adaptations, both structural and metabolic, to counteract osmotic stress. These strategies are well-understood for organisms in NaCl-rich brines such as the accumulation of certain organic solutes (known as either compatible solutes or osmolytes). Less well studied are responses to ionic environments such as sulfate-rich brines which are prevalent on Earth but can also be found on Mars. In this paper, we investigated the global metabolic response of the anaerobic bacterium Yersinia intermedia MASE-LG-1 to osmotic salt stress induced by either magnesium sulfate (MgSO4) or NaCl at the same water activity (0.975). Using a non-targeted mass spectrometry approach, the intensity of hundreds of metabolites was measured. The compatible solutes L-asparagine and sucrose were found to be increased in both MgSO4 and NaCl compared to the control sample, suggesting a similar osmotic response to different ionic environments. We were able to demonstrate that Yersinia intermedia MASE-LG-1 accumulated a range of other compatible solutes. However, we also found the global metabolic responses, especially with regard to amino acid metabolism and carbohydrate metabolism, to be salt-specific, thus, suggesting ion-specific regulation of specific metabolic pathways.
Keywords: compatible solutes; magnesium sulfate; metabolome; sodium chloride; stress response.
Figures


Similar articles
-
The responses of an anaerobic microorganism, Yersinia intermedia MASE-LG-1 to individual and combined simulated Martian stresses.PLoS One. 2017 Oct 25;12(10):e0185178. doi: 10.1371/journal.pone.0185178. eCollection 2017. PLoS One. 2017. PMID: 29069099 Free PMC article.
-
Impact of Simulated Martian Conditions on (Facultatively) Anaerobic Bacterial Strains from Different Mars Analogue Sites.Curr Issues Mol Biol. 2020;38:103-122. doi: 10.21775/cimb.038.103. Epub 2020 Jan 22. Curr Issues Mol Biol. 2020. PMID: 31967578
-
Examining the Osmotic Response of Acidihalobacter aeolianus after Exposure to Salt Stress.Microorganisms. 2021 Dec 23;10(1):22. doi: 10.3390/microorganisms10010022. Microorganisms. 2021. PMID: 35056469 Free PMC article.
-
[Study progress on compatible solutes in moderately halophilic bacteria].Wei Sheng Wu Xue Bao. 2007 Oct;47(5):937-41. Wei Sheng Wu Xue Bao. 2007. PMID: 18062278 Review. Chinese.
-
Diversity and biosynthesis of compatible solutes in hyper/thermophiles.Int Microbiol. 2006 Sep;9(3):199-206. Int Microbiol. 2006. PMID: 17061210 Review.
Cited by
-
Microbial Markers Profile in Anaerobic Mars Analogue Environments Using the LDChip (Life Detector Chip) Antibody Microarray Core of the SOLID (Signs of Life Detector) Platform.Microorganisms. 2019 Sep 18;7(9):365. doi: 10.3390/microorganisms7090365. Microorganisms. 2019. PMID: 31540500 Free PMC article.
-
Taxonomic and functional analyses of intact microbial communities thriving in extreme, astrobiology-relevant, anoxic sites.Microbiome. 2021 Feb 18;9(1):50. doi: 10.1186/s40168-020-00989-5. Microbiome. 2021. PMID: 33602336 Free PMC article.
-
Lack of correlation of desiccation and radiation tolerance in microorganisms from diverse extreme environments tested under anoxic conditions.FEMS Microbiol Lett. 2018 Mar 1;365(6):fny044. doi: 10.1093/femsle/fny044. FEMS Microbiol Lett. 2018. PMID: 29474542 Free PMC article.
-
Integrated transcriptomic, proteomic and metabolomic analyses revealing the roles of amino acid and sucrose metabolism in augmenting drought tolerance in Agropyron mongolicum.Front Plant Sci. 2024 Dec 16;15:1515944. doi: 10.3389/fpls.2024.1515944. eCollection 2024. Front Plant Sci. 2024. PMID: 39741683 Free PMC article.
References
-
- Barbour E. A., Priest F. G. (1986). The preservation of lactobacilli: a comparison of three methods. Lett. Appl. Microbiol. 2, 68–71. 10.1111/j.1472-765X.1986.tb01518.x - DOI
-
- Beblo-Vranesevic K., Bohmeier M., Perras A. K., Schwendner P., Rabbow E., Moissl-Eichinger C. (2017b). The responses of an anaerobic microorganism, Yersinia intermedia MASE-LG-1, to individual and combined simulated Martian stresses. PLoS ONE 12:e0185178. 10.1371/journal.pone.0185178 - DOI - PMC - PubMed
LinkOut - more resources
Full Text Sources
Other Literature Sources
Molecular Biology Databases
Miscellaneous