. 2018 Feb 26:9:263.
doi: 10.3389/fimmu.2018.00263. eCollection 2018.

Dectin-1 Positive Dendritic Cells Expand after Infection with Leishmania major Parasites and Represent Promising Targets for Vaccine Development

Affiliations

Dectin-1 Positive Dendritic Cells Expand after Infection with Leishmania major Parasites and Represent Promising Targets for Vaccine Development

Nicole Zimara et al. Front Immunol. .

Abstract

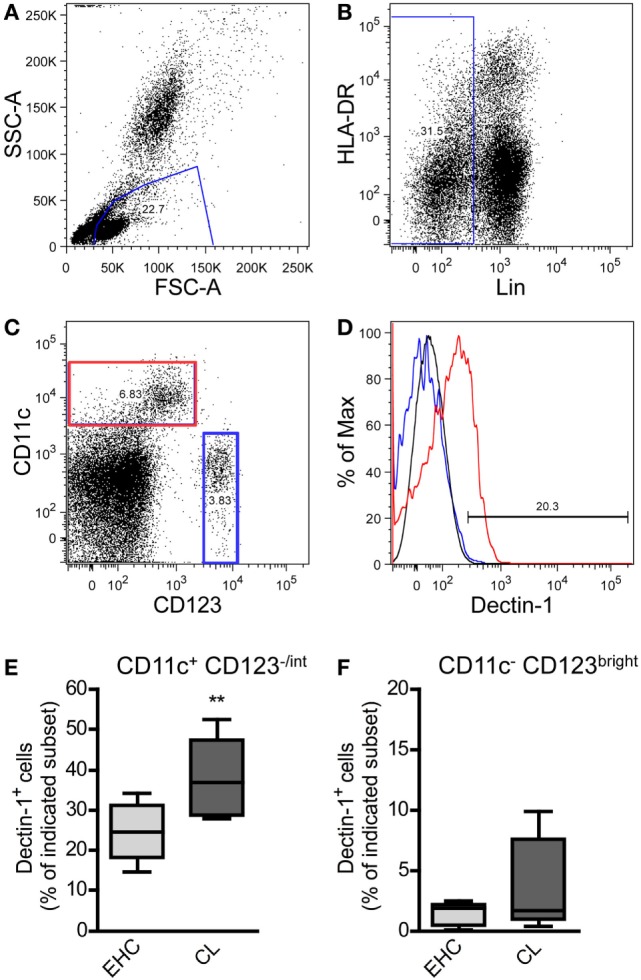
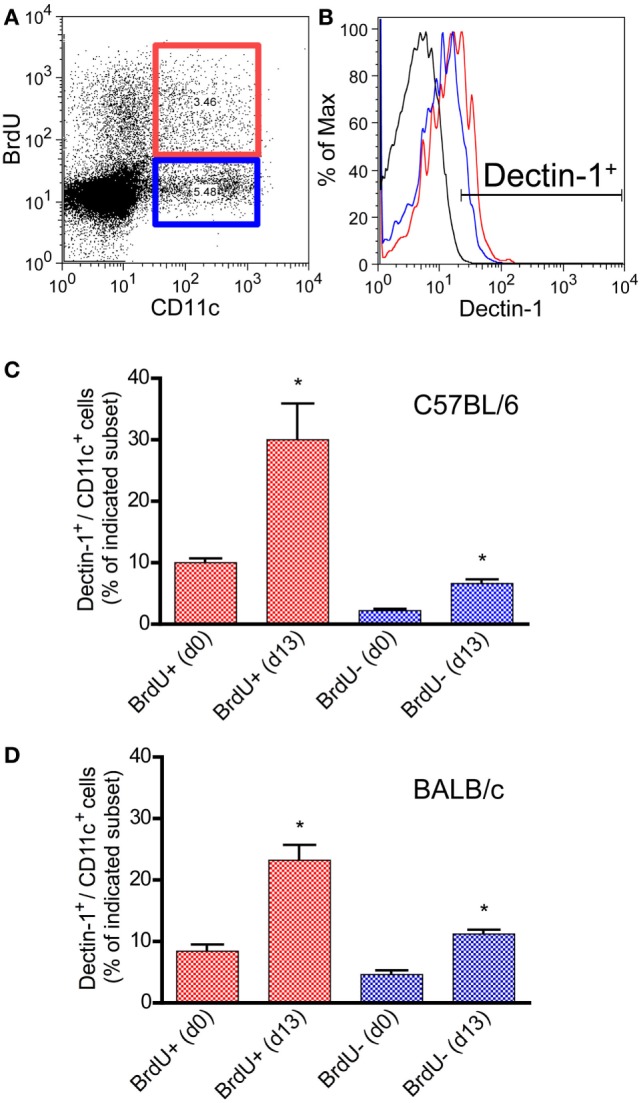
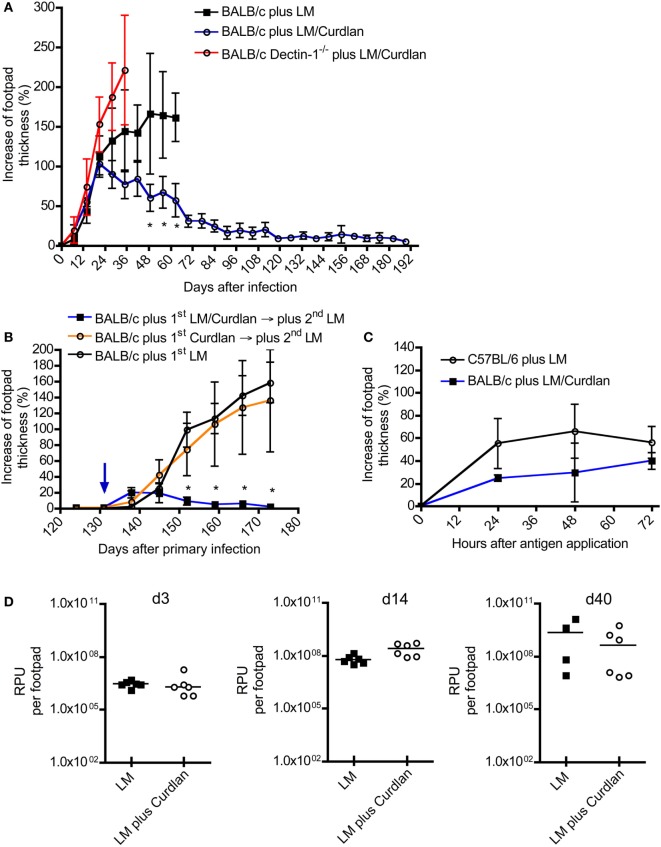
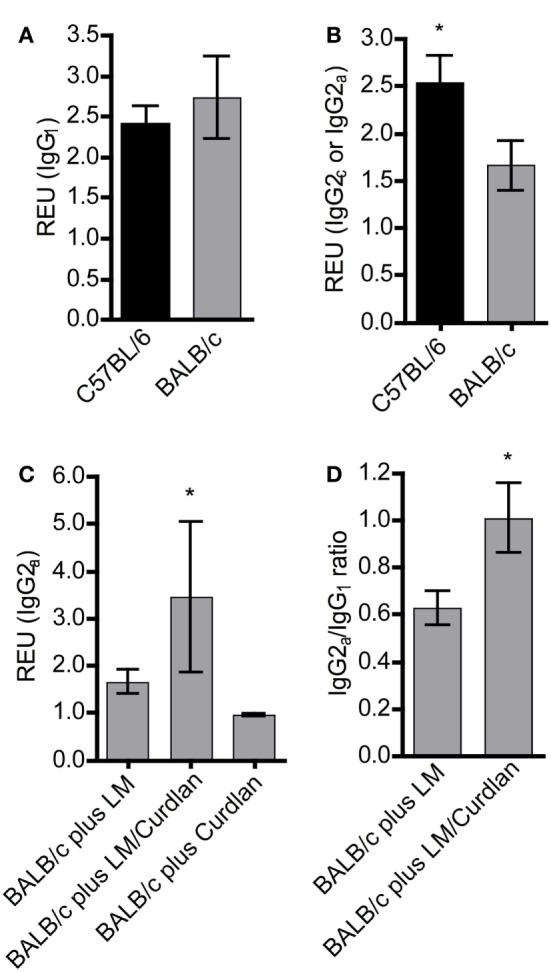
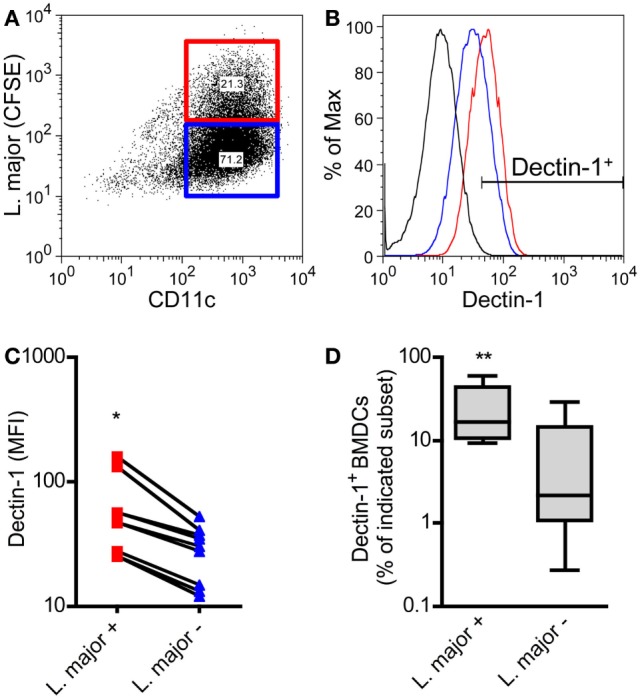
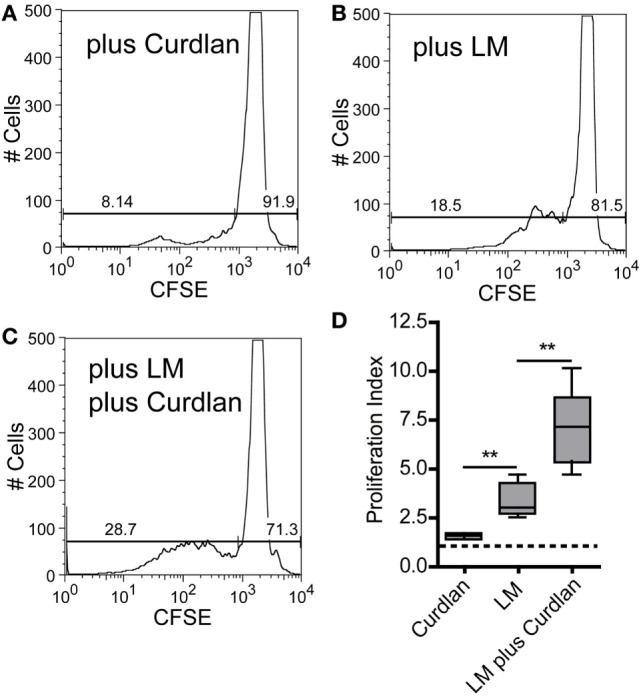
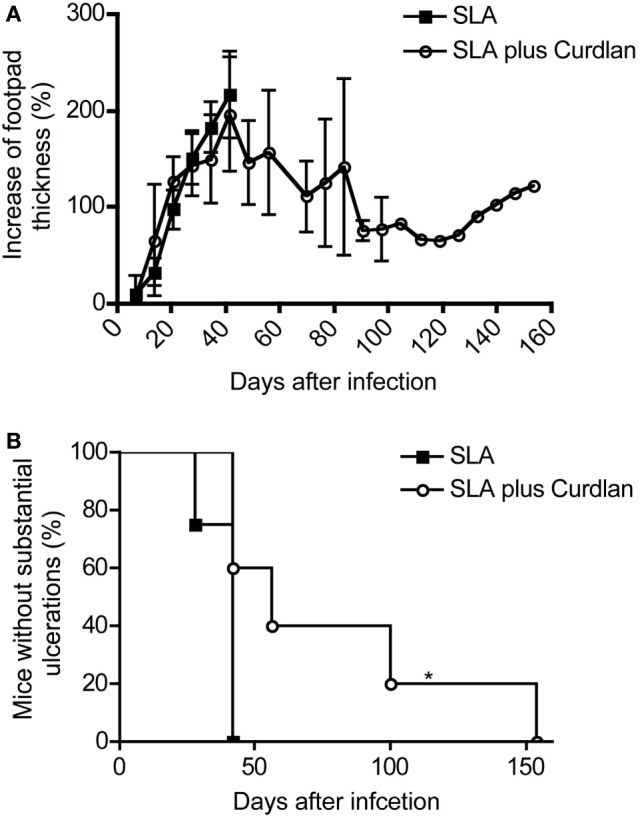
Resistant mouse strains mount a protective T cell-mediated immune response upon infection with Leishmania (L.) parasites. Healing correlates with a T helper (Th) cell-type 1 response characterized by a pronounced IFN-γ production, while susceptibility is associated with an IL-4-dependent Th2-type response. It has been shown that dermal dendritic cells are crucial for inducing protective Th1-mediated immunity. Additionally, there is growing evidence that C-type lectin receptor (CLR)-mediated signaling is involved in directing adaptive immunity against pathogens. However, little is known about the function of the CLR Dectin-1 in modulating Th1- or Th2-type immune responses by DC subsets in leishmaniasis. We characterized the expression of Dectin-1 on CD11c+ DCs in peripheral blood, at the site of infection, and skin-draining lymph nodes of L. major-infected C57BL/6 and BALB/c mice and in peripheral blood of patients suffering from cutaneous leishmaniasis (CL). Both mouse strains responded with an expansion of Dectin-1+ DCs within the analyzed tissues. In accordance with the experimental model, Dectin-1+ DCs expanded as well in the peripheral blood of CL patients. To study the role of Dectin-1+ DCs in adaptive immunity against L. major, we analyzed the T cell stimulating potential of bone marrow-derived dendritic cells (BMDCs) in the presence of the Dectin-1 agonist Curdlan. These experiments revealed that Curdlan induces the maturation of BMDCs and the expansion of Leishmania-specific CD4+ T cells. Based on these findings, we evaluated the impact of Curdlan/Dectin-1 interactions in experimental leishmaniasis and were able to demonstrate that the presence of Curdlan at the site of infection modulates the course of disease in BALB/c mice: wild-type BALB/c mice treated intradermally with Curdlan developed a protective immune response against L. major whereas Dectin-1-/- BALB/c mice still developed the fatal course of disease after Curdlan treatment. Furthermore, the vaccination of BALB/c mice with a combination of soluble L. major antigens and Curdlan was able to provide a partial protection from severe leishmaniasis. These findings indicate that the ligation of Dectin-1 on DCs acts as an important checkpoint in adaptive immunity against L. major and should therefore be considered in future whole-organism vaccination strategies.

Keywords: Curdlan; Dectin-1; T helper 1 and T helper 2 cells; adaptive immunity; cutaneous leishmaniasis; dendritic cells; β-glucan.


Figures

Figure 1
Figure 1
Characterization of Dectin-1+ DC subsets in blood samples from patients suffering from cutaneous leishmaniasis (CL). Peripheral blood samples from patients suffering from CL and Ethiopian healthy controls (EHCs) were stained for CD11c, Dectin-1, HLA-DR, CD123, and a lineage cocktail (anti-CD3, anti-CD14, anti-CD16, anti-CD19, anti-CD20, and anti-CD56) abbreviated as Lin. The following gating strategy was used. (A) FSC and SSC plots were used to define the leukocyte population. (B) Lin cells were selected for further analysis. (C) Lin cells were differentiated into CD11c+/CD123−/int and CD11c/CD123bright populations displayed as dot plot. (D) The histogram plot indicates the expression of Dectin-1 on CD11c+/CD123−/int (highlighted in red) and CD11c/CD123bright cells (highlighted in blue). The black line represents the isotype control. (E,F) The frequency of Dectin-1+ cells within the indicated subset is shown by box plot diagrams. Number of analyzed donors, n = 5. Data were analyzed using Student’s t-test (**p = 0.004).
Figure 2
Figure 2
Characterization of Dectin-1 expression on proliferating CD11c+ DCs in blood samples of infected C57BL/6 and BALB/c mice. Mice were infected intradermally with Leishmania major parasites into the hind footpad, and the peripheral blood was analyzed 13 days after infection. Naïve mice served as controls (day 0). BrdU+ was given 3 days before the analysis. Peripheral blood leukocytes were gated. (A) The dot plot diagram displays the CD11c and BrdU intensities. BrdU+/CD11c+ cells are highlighted by a red and BrdU/CD11c+ by a blue gate. (B) Dectin-1 expression of the BrdU subsets is shown as histogram displaying isotype control in black, BrdU+/CD11c+ cells in red, and BrdU/CD11c+ cells in blue line. (C) The frequencies of Dectin-1+/CD11c+ cells (blue bars, BrdU/CD11c+; red bars, BrdU+/CD11c+) within the peripheral blood of C57BL/6 mice were analyzed. Pooled data from three different experiments are shown (mean ± SD). Data were analyzed using Student’s t-test (**p = 0.004, ***p = 0.0003). (D) The frequencies of Dectin-1+/CD11c+ cells (blue bars, BrdU/CD11c+; red bars, BrdU+/CD11c+) within the peripheral blood of BALB/c mice are indicated (mean ± SD). Pooled data from three different experiments were analyzed using the non-parametric Mann–Whitney test (*p < 0.5).
Figure 3
Figure 3
The presence of Curdlan at the site of infection results in an adaptive immune response in normally susceptible BALB/c. (A) BALB/c control mice were infected intradermally with Leishmania (L.) major into the right footpad (black line, black squares; 3 × 106 parasites/30 μL; n = 19), abbreviated as BALB/c plus LM. Another group of BALB/c mice was infected with 30 µL of mixture of 3 × 106 parasites and Curdlan (c = 50 μg/μL, blue line, black circles; n = 16), abbreviated as BALB/c plus LM/Curdlan. BALB/c mice deficient for Dectin-1 were also infected with 30 µL of a mixture of 3 × 106 parasites and Curdlan (c = 50 µg/µL, red line, black circles; n = 5), abbreviated as BALB/c Dectin-1−/− plus LM/Curdlan. Based on severe necrosis of the infected footpads, the groups BALB/c plus LM and BALB/c Dectin-1−/− plus LM/Curdlan had to be terminated at days 60 and 36, respectively. The y-axis depicts the increase in footpad thickness (mean ± SD). Data were analyzed using Student’s t-test and highlighted if differences are significant (*p < 0.05; BALB/c plus LM compared to BALB/c plus LM/Curdlan). (B) Resistant BALB/c mice that had been treated with Curdlan in the presence of L. major parasites were reinfected at day 131 (blue arrow) after primary infection (abbreviated as BALB/c plus 1st LM/Curdlan → 2nd LM, blue line, black squares; n = 3). BALB/c mice that had been treated with Curdlan alone 131 days before (abbreviated as BALB/c plus 1st Curdlan → 2nd LM, orange line, black circles; n = 3) were also infected. Naïve BALB/c mice were infected (BALB/c plus 1st LM, black line, black circle; n = 5), too. The y-axis depicts the increase in footpad thickness (mean ± SD). Data (BALB/c plus 1st LM compared to BALB/c plus 1st LM/Curdlan → 2nd LM) were analyzed using two-way ANOVA (*p < 0.05). (C) A delayed-type hypersensitivity (DTH) response is shown, comparing C57BL/6 mice infected with 3 × 106 parasites (plus LM, black line, black circles; n = 3) with BALB/c mice infected with 3 × 106 parasites plus Curdlan (plus LM/Curdlan, blue line, black squares; n = 3). The DTH response was induced 217 days after primary infection as described in Section “Materials and Methods.” The y-axis depicts the increase in footpad thickness (mean ± SD), the x-axis hours after antigen application. (D) Relative parasite units (RPU) representing the relative amount of parasites per footpad at days 3, 14, and 40 after infection are displayed. Infected BALB/c mice (LM, black squares) were compared with BALB/c mice that had been infected with parasites plus Curdlan (LM plus Curdlan, black circles). The mean (horizontal line) is shown. Each circle or square represents one analyzed footpad. Data were analyzed using Student’s t-test (d3 p = 0.779, d14 p = 0.062, and d40 p = 0.286).
Figure 4
Figure 4
The presence of Curdlan at the site of infection modulates the humoral immune response of BALB/c mice toward a pronounced production of Leishmania-specific IgG2a. C57BL/6 and BALB/c mice were infected with a volume of 30 µL PBS containing 3 × 106 Leishmania (L.) major (LM) parasites in the presence or absence of Curdlan (c = 50 µg/µL). Blood samples were collected 25 days after infection. Leishmania-specific IgG1, IgG2a, and IgG2c in sera of infected mice were quantified by ELISA as described in Section “Materials and Methods.” (A) Relative ELISA units (REU) of Leishmania-specific IgG1 of infected BALB/c and C57BL/6 mice are depicted (n = 3). (B) REU of Leishmania-specific IgG2a and IgG2c of infected BALB/c and C57BL/6 mice were compared (n = 3; *p < 0.05). (C) REU of Leishmania-specific IgG2a of three groups are shown: infected BALB/c mice (plus LM), infected BALB/c mice in the presence of Curdlan (plus LM/Curdlan), and Curdlan-treated BALB/c mice (plus Curdlan) (n = 3; *p = 0.043). (D) The ratio of Leishmania-specific IgG2a/IgG1 was calculated in BALB/c mice infected with L. major (plus LM) and BALB/c mice infected with L. major in the presence of Curdlan (plus LM/Curdlan) (n = 3; *p < 0.05). Data were analyzed using the non-parametric Mann–Whitney test. The mean ± SD is displayed.
Figure 5
Figure 5
Lymph node-resident CD4+ T cells from Curdlan-treated BALB/c mice show a shift toward an impaired T helper (Th) 2 response. BALB/c mice were infected with a volume of 30 µL PBS containing 3 × 106Leishmania (L.) major (LM) parasites in the presence (abbreviated as LM plus Curdlan, c = 50 µg/µL) or absence of Curdlan (abbreviated as LM). CD4+ T cells were purified at days 10 and 28 after infection, and qRT-PCR was performed to determine the relative mRNA levels of target genes referred to GAPDH. The ratios of T-bet/GATA-binding protein 3 (GATA3) and of IFN-γ/IL-4 relative mRNA levels are shown. (A,B) The scatter plots depict the relative expression ratio of IFN-γ/IL-4 from the analyzed groups (LM and LM plus Curdlan) at day 10 [(A), *p = 0.042] and day 28 [(B), *p = 0.032]. (C,D) The scatter plots depict the relative expression ratios of IFN-γ/IL-4 from the analyzed groups in a time-dependent manner. (C) LM plus Curdlan (***p = 0.0007) and (D) plus LM (p > 0.05). (E,F) The scatter plots depict the relative expression ratio of T-bet/GATA3 from the analyzed groups (LM and LM plus Curdlan). Day 10 [(E), p > 0.05] and day 28 [(F), *p = 0.048] are shown. (G,H) The scatter plots depict the relative expression ratios of T-bet/GATA3 from the analyzed groups in a time-dependent manner. (G) LM plus Curdlan (**p = 0.008) and (D) plus LM. Data were analyzed using Student’s t-test. Each symbol represents an individual mouse, and the bars indicate the medians.
Figure 6
Figure 6
Dectin-1 is expressed to a stronger degree by Leishmania (L.) major harboring bone marrow-derived dendritic cells (BMDCs) compared to non-infected BMDCs. BMDCs were infected with CFSE-labeled L. major promastigote parasites. After 24 h, BMDCs were harvested and characterized by flow cytometry analysis for the markers CD11c and Dectin-1. (A) The dot plot diagram depicts two populations of L. major harboring (L. major CFSE+; red square) and not infected (L. major CFSE; blue square) CD11c+ BMDCs. The gates were placed according to the isotype controls of not infected BMDCs. (B) The histogram visualizes the expression of Dectin-1 of infected (L. major+; red line) and not infected (L. major; blue line) BMDCs. The black line depicts the isotype control. (C) The mean fluorescence intensity (MFI) of Dectin-1 expressed by L. major+ (red squares) and not infected subsets (L. major; blue triangles) is shown. Each symbol represents an individual mouse. Pooled data of three independent experiments are included (*p = 0.018). (D) The frequency of Dectin-1+ cells within the infected (L. major+) and not infected (L. major) subsets is displayed as a box plot (n = 5 experiments, **p = 0.0029). Data were analyzed using the non-parametric Mann–Whitney test.
Figure 7
Figure 7
Leishmania (L.) major (LM) harboring bone marrow-derived dendritic cells (BMDCs) mature after Curdlan stimulation. The effect of Curdlan on BMDC maturation was analyzed. 24 h after the Curdlan stimulation, BMDCs were harvested and characterized by flow cytometry using the markers CD11c and CD86. (A) The dot plot diagram depicts CD11c+ BMDCs that had been cultured in the absence of Curdlan and CFSE-labeled L. major promastigote (control). The red population indicates the isotype control for the anti-CD86 antibody. The quadrants of interest are upper right (Q2, red; L. major CFSE+/CD86+/bright) and lower right (Q3, blue: L. major CFSE/CD86+/bright). The quadrants were placed according to the isotype control and CD11c+ BMDCs negative for CFSE-labeled parasites. (B) The dot plot diagram depicts the quadrants of interest of CD11c+ BMDCs incubated with CFSE-labeled parasites (LM). (C) The dot plot diagram depicts the quadrants of interest of Curdlan stimulated CD11c+ BMDCs cocultured with CFSE-labeled parasites (LM plus Curdlan). (D) The frequency of L. major CFSE+ and CD86+/bright BMDCs (Q2) is shown. (E) The frequency of L. major CFSE and CD86+/bright (Q3) BMDCs is depicted. The following culture conditions were compared: not infected, not stimulated BMDCs [Control, compare (A)], L. major harboring BMDCs [LM, compare (B)], and L. major harboring BMDCs stimulated with Curdlan [LM plus Curdlan, compare (C)]. The box plots (D,E) depict pooled data out of two independent experiments (n = 4). Data were analyzed using the non-parametric Mann–Whitney test [(C,D), *p = 0.0286].
Figure 8
Figure 8
Curdlan stimulation enhances the potential of parasite harboring bone marrow-derived dendritic cells (BMDCs) toward the expansion of Leishmania-specific CD4+ T cells. BALB/c mice were infected with a volume of 30 µL PBS containing 3 × 106 Leishmania (L.) major parasites. Ten days after infection, CD3+ T cells were isolated from skin-draining lymph nodes (SDLNs) and labeled with CFSE. BALB/c BMDCs were harvested at day 10 after ex vivo differentiation with GM-CSF and incubated for 24 h with L. major parasites (5:1) in the presence or absence of Curdlan (50 μg/200 μL). CFSE-labeled CD3+ T cells and BMDCs (10:1) were incubated for 72 h and analyzed by flow cytometry. The proliferative (left gate) and resting (right gate) CD4+ T cells are visualized by gates within the histogram plots. Following experimental approaches are displayed: (A) Curdlan activated but not infected BMDCs (plus Curdlan), (B) infected but not activated BMDCs (plus L. major), and (C) Curdlan-activated and infected BMDCs (plus L. major; plus Curdlan). The percentage of resting and proliferating cells is indicated inside the corresponding gates. (D) The proliferation index (described in detail in Section “Materials and Methods”) is displayed as a box plot diagram. Pooled data from two independent experiments are shown. Data were analyzed using Student’s t-test (Curdlan compared with LM, **p = 0.0018 and LM plus Curdlan compared with LM, **p = 0.0058; n = 5).
Figure 9
Figure 9
Course of disease in vaccinated mice challenged with Leishmania (L.) major. Soluble L. major antigens (SLA, black square) or SLA plus Curdlan (black circle) treated were injected intradermally into the left footpad of BALB/c mice. The contralateral right footpad was used for the intradermal infection with 3 × 106 L. major parasites 28 days later. (A) The increase in footpad thickness after infection is shown (mean ± SD; n = 11 per group). (B) The number of mice that do not develop substantial ulcerations after intradermal infection into the contralateral hind footpad is depicted (n = 11; *p = 0.017). Significances were calculated using a log-rank test.

Similar articles

Cited by

References

    1. Dostalova A, Volf P. Leishmania development in sand flies: parasite-vector interactions overview. Parasit Vectors (2012) 5:276.10.1186/1756-3305-5-276 - DOI - PMC - PubMed
    1. Pace D. Leishmaniasis. J Infect (2014) 69(Suppl 1):S10–8.10.1016/j.jinf.2014.07.016 - DOI - PubMed
    1. Sacks D, Noben-Trauth N. The immunology of susceptibility and resistance to Leishmania major in mice. Nat Rev Immunol (2002) 2(11):845–58.10.1038/nri933 - DOI - PubMed
    1. Solbach W, Bogdan C, Moll H, Lohoff M, Rollinghoff M. [Parasitic evasion mechanisms: Leishmania as an example]. Immun Infekt (1989) 17(4):129–40. - PubMed
    1. Alexander J, Bryson K. T helper (h)1/Th2 and Leishmania: paradox rather than paradigm. Immunol Lett (2005) 99(1):17–23.10.1016/j.imlet.2005.01.009 - DOI - PubMed

Publication types