. 2018 Feb 26:9:301.
doi: 10.3389/fimmu.2018.00301. eCollection 2018.

Molecular Signatures of a TLR4 Agonist-Adjuvanted HIV-1 Vaccine Candidate in Humans

Affiliations

Molecular Signatures of a TLR4 Agonist-Adjuvanted HIV-1 Vaccine Candidate in Humans

Jenna Anderson et al. Front Immunol. .

Abstract

Systems biology approaches have recently provided new insights into the mechanisms of action of human vaccines and adjuvants. Here, we investigated early transcriptional signatures induced in whole blood of healthy subjects following vaccination with a recombinant HIV-1 envelope glycoprotein subunit CN54gp140 adjuvanted with the TLR4 agonist glucopyranosyl lipid adjuvant-aqueous formulation (GLA-AF) and correlated signatures to CN54gp140-specific serum antibody responses. Fourteen healthy volunteers aged 18-45 years were immunized intramuscularly three times at 1-month intervals and whole blood samples were collected at baseline, 6 h, and 1, 3, and 7 days post first immunization. Subtle changes in the transcriptomic profiles were observed following immunization, ranging from over 300 differentially expressed genes (DEGs) at day 1 to nearly 100 DEGs at day 7 following immunization. Functional pathway analysis revealed blood transcription modules (BTMs) related to general cell cycle activation, and innate immune cell activation at early time points, as well as BTMs related to T cells and B cell activation at the later time points post-immunization. Diverse CN54gp140-specific serum antibody responses of the subjects enabled their categorization into high or low responders, at early (<1 month) and late (up to 6 months) time points post vaccination. BTM analyses revealed repression of modules enriched in NK cells, and the mitochondrial electron chain, in individuals with high or sustained antigen-specific antibody responses. However, low responders showed an enhancement of BTMs associated with enrichment in myeloid cells and monocytes as well as integrin cell surface interactions. Flow cytometry analysis of peripheral blood mononuclear cells obtained from the subjects revealed an enhanced frequency of CD56dim NK cells in the majority of vaccines 14 days after vaccination as compared with the baseline. These results emphasize the utility of a systems biology approach to enhance our understanding on the mechanisms of action of TLR4 adjuvanted human vaccines.

Trial registration: ClinicalTrials.gov NCT01966900.

Keywords: HIV vaccine; TLR4; adjuvant; glucopyranosyl lipid adjuvant-aqueous formulation; systems vaccinology; transcriptomics.


Figures

Figure 1
Figure 1
Transcriptional changes in gene expression over time following vaccination. Subjects were intramuscularly immunized with CN54gp140 + GLA. In the Venn diagram, (A) the number of unique and shared differentially expressed genes (DEGs) in whole blood at 6 h, 1 day, 3 days, and 7 days after immunization (compared to baseline, 0 h) are shown, while the numbers and magnitudes (y-axis) of upregulated (red dots) or downregulated (blue dots) DEGs at 6 h (B), 1 day (C), 3 days (D), and 7 days (E), are depicted in volcano plots. An overview of all DEGs hierarchically clustered and arranged by time, are shown in a heat map (F), according to the color legend (upregulated DEGs in red, downregulated in blue, log2FC scale).
Figure 2
Figure 2
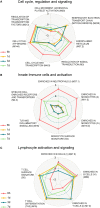
Enrichment of blood transcription modules (BTMs) regulated upon vaccination. Spider web chart indicating enriched BTMs at 6 h (red), 1 day (yellow), 3 days (blue), and 7 days (green). BTMs are functionally divided into: cell cycle regulation and signaling (A), innate immune cells and activation (B), and B and T cell activation and signaling (C). Only BTMs with FDR q values < 0.05 at at least one of the four time points (those time points are marked with asterisk) are considered. Points inside the dashed blue circle are negative enrichment and points outside the blue circle are positive enrichment.
Figure 3
Figure 3
Molecular signatures associated with early (A) and late (B) humoral responses. Blood transcription modules (BTMs) at early time points (6 h, 1 day, 3 days, and 7 days) associated with IgA (measured at 14 days), IgG (measured at 28 days), and IgM (measured at 28 days) responses in high and low responders (A). BTMs at early time points (6 h, 1 day, 3 days, and 7 days) associating with IgA, IgG, IgG1, IgG2a, IgG3, and IgG4, all measured at 168 days except IgG3 (measured at 84 days) responses in high and low responders (B). Size of the circles indicate level of significance [−log10(FDR)]. Only BTMs with FDR q value < 0.25 are included in the plot. Negative association is indicated by blue color and positive association is indicated by red color.
Figure 4
Figure 4
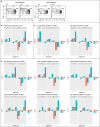
Frequency of CD56dim NK cell was enhanced in high antibody responders 14 days post vaccination. FACS plots showing NK cell populations of representative low (no IgM 14 days and low IgG 168 days) and high (IgM response 14 days and high IgG 168 days) responder before (D0) and 14 days following vaccination (A). Average frequency of the CD56bright and CD56dim NK cell populations at 0 h and 14 days (B). Log2 fold change of CD56bright and CD56dim NK cell population divided into IgM responders (Y) and non-responders (N) Day 14 following vaccination (C). Log2 fold change of CD56bright and CD56dim NK cell populations divided into early (84–168 days) high and low responders (IgG, IgG1, IgG2, IgG3, IgG4, and IgA) (D).

Similar articles

Cited by

References

    1. WHO. HIV/AIDS. WHO; (2017). Available from: http://www.who.int/gho/hiv/en/
    1. Shattock RJ, Warren M, McCormack S, Hankins CA. Turning the tide against HIV. Science (2011) 333(6038):42–3.10.1126/science.1206399 - DOI - PubMed
    1. de Bruyn G. Cofactors that may influence vaccine responses. Curr Opin HIV AIDS (2010) 5(5):404–8.10.1097/COH.0b013e32833d1fca - DOI - PMC - PubMed
    1. Haynes BF, Gilbert PB, McElrath MJ, Zolla-Pazner S, Tomaras GD, Alam SM, et al. Immune-correlates analysis of an HIV-1 vaccine efficacy trial. N Engl J Med (2012) 366(14):1275–86.10.1056/NEJMoa1113425 - DOI - PMC - PubMed
    1. Cotugno N, De Armas L, Pallikkuth S, Rossi P, Palma P, Pahwa S. Paediatric HIV infection in the ‘omics era: defining transcriptional signatures of viral control and vaccine responses. J Virus Erad (2015) 1:153–8. - PMC - PubMed

Publication types

MeSH terms

Substances

Associated data